Abstract
Electron cryomicroscopy (cryo-EM) yields images of macromolecular assemblies and their components, from which 3D structures can be determined, by using an image processing method commonly known as “single-particle reconstruction.” During the past two decades, this technique has become an important tool for 3D structure determination, but it generally has not been possible to determine atomic models. In principle, individual molecular images contain high-resolution information contaminated by a much higher level of noise. In practice, it has been unclear whether current averaging methods are adequate to extract this information from the background. We present here a reconstruction, obtained by using recently developed image processing methods, of the rotavirus inner capsid particle (“double-layer particle” or DLP) at a resolution suitable for interpretation by an atomic model. The result establishes single-particle reconstruction as a high-resolution technique. We show by direct comparison that the cryo-EM reconstruction of viral protein 6 (VP6) of the rotavirus DLP is similar in clarity to a 3.8-Å resolution map obtained from x-ray crystallography. At this resolution, most of the amino acid side chains produce recognizable density. The icosahedral symmetry of the particle was an important factor in achieving this resolution in the cryo-EM analysis, but as the size of recordable datasets increases, single-particle reconstruction also is likely to yield structures at comparable resolution from samples of much lower symmetry. This potential has broad implications for structural cell biology.
Keywords: FREALIGN, virus structure, rotavirus, protein structure, image processing
Cryogenic preservation of macromolecular assemblies was introduced into electron microscopy 30 years ago (1, 2). Different applications of electron cryomicroscopy (cryo-EM) include 2D crystallography, helical reconstruction (helices are effectively rolled-up 2D lattices), single-particle reconstruction, and tomography (reviewed recently in ref. 3). In several cases, data collected from 2D crystals and helical specimens have led to structures at 4-Å resolution or better, enabling their interpretation by atomic models (for example, see refs. 4–6). The periodicity present in images of 2D crystals and helical specimens generates distinct diffraction patterns with signal-containing spots and lines that can be separated from the background. Removal of the background (noise) is straightforward and amounts to averaging over all unit cells in the crystal. The distinction between signal and background is not possible in images of single particles and tomographic reconstructions. Instead, in the case of single-particle reconstructions, averaging must be performed over many individual particle images. The resolution obtained by this averaging procedure depends critically on the accuracy with which each particle can be brought into register with the others. This computational step is not an issue for well ordered 2D crystals and helical specimens used in high-resolution studies because intermolecular contacts establish the alignment of molecules. Other important imaging parameters, such as the magnification, defocus, and beam tilt used to collect the images in the microscope, also are easier to determine for 2D crystals and helical specimens because a single image typically contains 100 to 1,000 times more signal than an image of an individual molecule or complex (3). For example, a purple membrane crystal containing ≈140 × 140 unit cells has a molecular mass of ≈1,760 MDa (7), generating ≈700 times the signal of a bacterial ribosome of 2.5 MDa (8). Finally, in most cases, a carbon film is used to support the crystalline specimens, providing additional stability to the specimen that can reduce movement during exposure to the electron beam (9).
Because of the lack of periodicity and, in many cases, the lack of a stable support film, single-particle reconstruction techniques have so far fallen short of yielding structures interpretable by atomic models. Efforts to achieve “atomic resolution” have continued, however, because the single-particle technique is applicable to a wide range of noncrystalline samples and can be used with just a few picomoles of material (10). Furthermore, single-particle techniques also can be applied to individual unit cells or mosaic blocks of crystalline samples, where they can perform better than crystallographic and helical techniques if the sample is partially disordered (11, 12). The single-particle technique therefore assumes a central role in cryo-EM. The cryo-EM-based 3D reconstruction of an icosahedral virus particle described in this article has a resolution adequate for tracing a polypeptide chain. The result demonstrates directly that recently developed computational techniques (13) can extract atomic-level detail from images recorded with contemporary instrumentation.
Rotaviruses are multishelled, nonenveloped, icosahedrally symmetric viruses with an 11-segment, double-strand RNA genome (14). Infectious virions are sometimes called “triple-layer particles” because three distinct protein shells surround the packaged viral RNA. During cell entry, the outer layer is lost, and the remaining “double-layer particle” (DLP), which contains approximately one copy of the viral RNA-dependent RNA polymerase and the capping enzyme for each genomic segment, generates mRNA transcripts and exports them into the cytoplasm of the infected cell. The inner layer of the DLP, which encloses the RNA, contains 120 copies of viral protein 2 (VP2; 102 kDa); the outer layer contains 780 copies of VP6 (41 kDa). VP6 forms stable trimers, which pack outside the VP2 layer in a T = 13 icosahedral array. A recently completed x-ray crystal structure of the DLP has yielded a full atomic model, refined at 3.8-Å resolution (B. McLain, E.S., R.B., and S.C.H., unpublished data). A previously determined structure of isolated VP6 trimers provides an even more precise view of that component (15).
Results
Quality of Data.
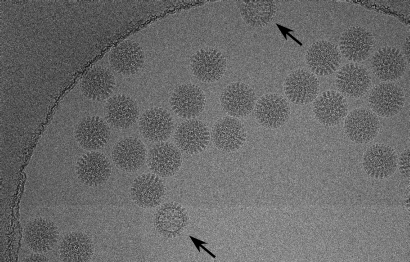
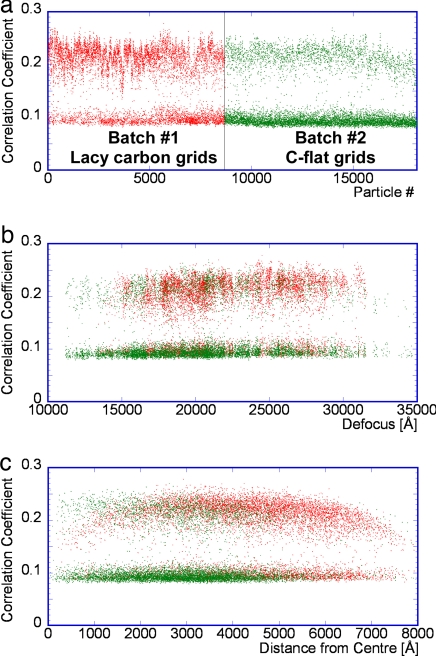
Data were collected from two DLP preparations. We aligned 18,125 images of rotavirus DLPs frozen in ice (Fig. 1) and merged a subset of these into a 3D reconstruction by using the computer program FREALIGN (13). Analysis of the aligned particles, which have a diameter of ≈710 Å, revealed a clear bimodal distribution of correlation coefficients between individual images and the refined reconstruction. A particle parameter search (see Materials and Methods) moved ≈13% of the particles from the lower cluster to the cluster with a higher correlation. This search was computationally expensive and had to be limited to a repeat of 50 times. The number of moved particles was found to depend on the number of search orientations, suggesting that one reason for a low correlation coefficient is misalignment. Other reasons may include more subtly damaged or otherwise disordered particles. An analysis of averaged power spectra calculated from particles selected from both clusters showed Thon rings (16) to a resolution of ≈6 Å, suggesting that the image quality is comparable in both cases. Selecting only the 8,400 particles from the cluster with a higher correlation, we computed a reconstruction with a resolution of ≈5 Å (Figs. 2–4). The icosahedral symmetry of the particle was applied during reconstruction, increasing the effective size of the dataset 60-fold. We also used the remaining particles to calculate a second reconstruction (data not shown), which had a resolution of only 25 Å. Thus, the correlation coefficient is a clear indicator of a usable particle.
Fig. 1.
Image of rotavirus DLPs frozen in ice over a hole in C-flat carbon grids. The arrows indicate particles that differ significantly in appearance from other particles in the image, indicating partially damaged particles. These particles were not used for further processing. More subtle damage to particles that is not readily visible may be one reason for the lower correlation coefficients with the reference seen for many particles (Fig. 5).
Fig. 2.
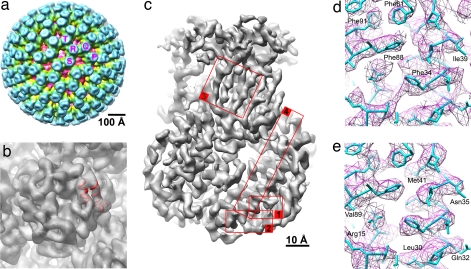
VP6 trimers in the DLP. (a) Rotavirus DLP structure filtered at 20 Å. VP6 trimers involved in the 13-fold nonicosahedral averaging are indicated by letters. The T trimer coincides with one of the icosahedral threefold axes and contains only one unique VP6 monomer. The other four trimers contain the additional 12 VP6 molecules that were used for nonicosahedral averaging. (b) T trimer of VP6, filtered at 7-Å resolution, with a bundle of three generic helices docked into easily identifiable density features; 12 other bundles were docked in equivalent density in the other four VP6 trimers. (c) Overview of the 13-fold averaged VP6 trimer at 3.8-Å resolution. Different areas are highlighted and labeled with numbers. They are shown in more detail in d and e and in Fig. 6. (d) Density in area 1 before 13-fold averaging, shown with the atomic model of VP6, determined by using the x-ray density map (B. McLain, E.S., R.B., and S.C.H., unpublished data). (e) Same as in d but after 13-fold averaging. All structures were prepared with UCSF CHIMERA (35).
Fig. 3.
Density map of part of the VP2 portion of DLP. The map was filtered at 4.5-Å resolution and sharpened by using a B factor of −450 Å2. The quality of the map is similar to that of VP6 before nonicosahedral averaging (Fig. 2d).
Fig. 4.
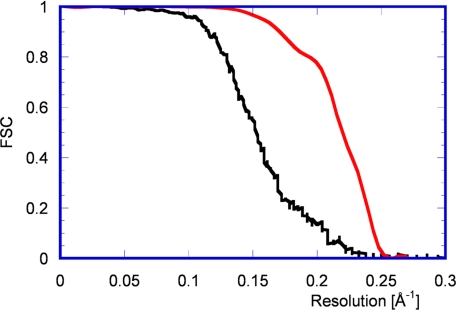
FSC curves before (black) and after (red) 13-fold nonicosahedral averaging. The black curve suggests a resolution of 5.1 Å (0.143 threshold value), and the red curve indicates a resolution of 4.1 Å. By using the more conservative threshold of 0.5, the cut-off values are 6.5 Å (black curve) and 4.5 Å (red curve).
The number of usable particles depends strongly on the batch number of the virus DLP preparation. Approximately 30% of the virus particles collected from the first batch fell below the threshold criterion for inclusion in the reconstruction, whereas it was ≈75% in the second batch (Fig. 5a). Data from both batches were recorded on several days and from different cryo grids, and properly aligned particles from both batches had approximately the same average correlation coefficient. Almost all micrographs contained both usable and discarded particles. However, virus particles from the first batch were frozen by using homemade lacy carbon, whereas material from the second batch was frozen by using commercially available C-flat grids that were lightly recoated with carbon before use to enhance conductivity. The dependence on batch number might reflect a difference in the quality of the particles. It is more likely, however, that the data from the second batch contained more misaligned particles because they were added at a different stage in the image processing, compared with the first batch (see Materials and Methods).
Fig. 5.
Correlation coefficients between images of DLPs and the reference. (a) Correlation coefficients are plotted as a function of particle and batch number (red, lacy carbon; green, C-flat). There is a bimodal distribution with a correlation coefficient of ≈0.14 separating the two clusters. (b) Correlation coefficients are plotted as a function of image defocus. (c) Correlation coefficients are plotted as a function of approximate particle distance from the center of hole in the carbon film.
The correlation coefficient also depends on the defocus used to collect the data (Fig. 5b). This dependence is not surprising because the defocus determines the spectral distribution of the signal in the image. A larger defocus amplifies the signal at low resolution where the molecular transform of the virus particle is strongest. Corresponding particles therefore show a higher correlation coefficient than particles imaged with a smaller defocus. The correlation coefficient also depends to some degree on the location of the virus particle in the carbon film hole (Fig. 5c). Particles closer to the edge of a hole tend to have a smaller correlation coefficient than particles closer to the center. We measured the ice thickness by burning a small hole into the ice layer at a tilt of −45° and then observing the hole length at a tilt of +45°. The measurements showed that the ice thickness close to the carbon was ≈1,200 Å, whereas it was only 700 Å near the center of the hole, similar to the diameter of the DLP. Thicker ice increases the fraction of inelastically and multiply scattered electrons, which add to the background in an image and reduce the signal produced by the remaining singly and elastically scattered electrons. This reduction in signal lowers the correlation coefficient between particle and reference. Some particles too close to the hole center also exhibited a slight decrease in correlation coefficient. These particles might have suffered some deformation because of the thin ice. The dependence on location was least noticeable in samples prepared by using C-flat grids, suggesting that the ice thickness in those samples was more uniform than in grids prepared with lacy carbon.
Nonicosahedral Averaging.
We used the atomic models for VP2 and VP6 built into the x-ray map to interpret the cryo-EM structure. In the icosahedrally averaged reconstruction of the DLP, the density corresponding to most aromatic side chains is clearly visible, whereas other, mostly smaller, side chains appear in incomplete or displaced density (Figs. 2d and 3).
The 780 VP6 monomers in the outer shell of DLP assume T = 13 icosahedral symmetry. The density map of VP6 therefore could be improved further by averaging the density of the 13 equivalent monomers that are not icosahedrally related. Bundles of three generic α-helices, generated with the computer program MOLEMAN (17, 18) and containing one 8-alanine and two 11-alanine helices, were placed in clearly identifiable density features of the three VP6 monomers around one of the icosahedral threefold axes. For the placement, we used a density map filtered at 7-Å resolution and sharpened with a B factor of −350 Å2 (Fig. 2b). The low-pass filter had a cosine-shaped cut-off with a width of ≈5 Fourier pixels. Copies of the trimer of helical bundles then were placed in the four other VP6 trimer densities containing the remaining 12 equivalent monomers (Fig. 2a). Approximate matrices transforming the coordinates of these four trimers into the trimer on the icosahedral threefold axis were determined by using the computer program LSQMAN (17, 18). The matrices were refined with the computer program IMP (17, 18) by aligning densities in the vicinity of the trimers of helical bundles against equivalent density of the VP6 trimer on the threefold icosahedral symmetry axis. For the refinement, we used a density map filtered at 4-Å resolution and sharpened with a B factor of −300 Å2. As before, the low-pass filter had a cosine-shaped cut-off with a width of ≈5 Fourier pixels. A full set of 12 transformation matrices was derived from the 4 initial matrices by combining the matrix transformations with additional 120° rotations around the threefold icosahedral symmetry axis. The VP6 densities were averaged by using the 12 matrices and the computer program AVE (17, 18). For the averaging, an ovoid mask with radii of 50 and 60 Å in the two orthogonal directions was defined that generously enveloped the VP6 trimer on the threefold axis. The refined matrix transformations were compared with transformations derived from an atomic model built into the x-ray map (B. McLain, E.S., R.B., and S.C.H., unpublished data). Coordinates transformed by the refined matrices deviated from those transformed by using matrices based on the atomic model with an rmsd of 0.7 Å. This alignment error contributed further to the signal attenuation in the final structure (see below).
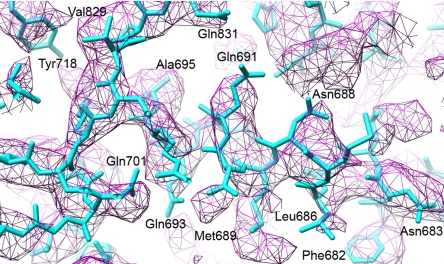
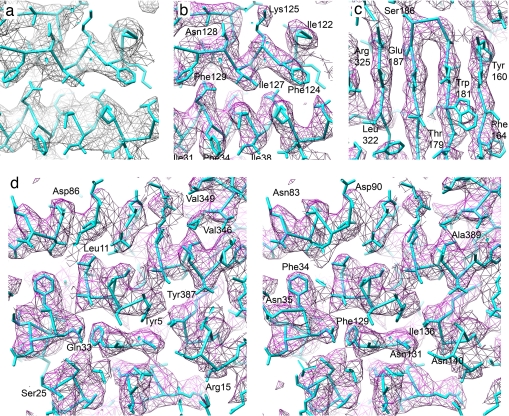
The final 13-fold averaged density is shown in Figs. 2e and 6b–d. It has clear features for most of the larger side chains, including aromatic, aliphatic, polar, and charged side chains. The map compares well with an electron density map determined by x-ray crystallography (B. McLain, E.S., R.B., and S.C.H., unpublished data) at 3.8-Å resolution (Fig. 6a), effectively calibrating the resolution of the 13-fold averaged density. The resolution also was estimated by using the Fourier shell correlation (FSC) criterion (Fig. 4), suggesting a resolution of ≈4 Å. The interpretation of the FSC curve comparing 13-fold averaged densities of reconstructions using two halves of the data is complicated by the tight masking imposed during the averaging procedure (see Materials and Methods), making the resolution estimate less accurate. The influence of the mask on the FSC was reduced by smoothing the edges of the mask.
Fig. 6.
Comparison of x-ray crystallographic and EM density maps. (a) X-ray crystallographic, icosahedrally averaged 2Fo − Fc density map at 3.8-Å resolution and atomic model built into this map (B. McLain, E.S., R.B., and S.C.H., unpublished data). The density corresponds to area 2 in Fig. 2c. (b) Same area as in a but showing the cryo-EM map. (c) Cryo-EM density in area 3 (Fig. 2c) showing clearly separated β-sheet strands. (d) Stereo image of area 4 (Fig. 2c) showing amino acid side chains protruding from different α-helices.
Discussion
The resolution obtained in the present work represents a substantial step forward in the application of cryo-EM. The promise of achieving a map interpretable by an atomic model has driven the development of new sample preparation techniques, instrumentation, and image processing methods (13, 19–21). An estimate of the number of images that might be required to attain near-atomic resolution was made 12 years ago (22). Subsequent single-particle reconstructions of hepatitis B virus capsids at 7- to 9-Å resolution were adequate to resolve secondary structures and permitted an approximate trace of the subunit polypeptide chain (23, 24). Virus particles are particularly suitable for high-resolution imaging because of their high symmetry, their generally high stability, and their solubility in aqueous buffers. Moreover, their high molecular mass gives rise to strong contrast in the EM, but limitations commonly encountered in cryo-EM applications, such as beam-induced movement and specimen charging, greatly reduce image contrast from the values expected under ideal conditions. Early estimates of the minimum number of images required to obtain a 3-Å resolution structure ranged between 1,400 and 12,600 (22, 25), depending on the assumed signal-to-noise ratio required in an interpretable reconstruction. Both estimates assumed physically perfect image formation, without loss of contrast because of the limitations mentioned above. Contrast in experimentally observed images usually is only ≈10% of the contrast expected in a perfect image (22). In our work, the images of 8,400 virus particles contain 8,400 × 60 × 13 = 6.6 million VP6 molecules. Besides the reduced image contrast, inaccuracies in the determination of image defocus and alignment parameters (three angles and x, y coordinates) also contribute to the requirement for a very large number of particles (26). An estimate of the alignment error (see Materials and Methods) suggests that angles were determined with an error of 0.2° and x, y coordinates within 0.2 Å. An angular error of 0.2° is expected to attenuate the signal in the reconstruction of a 700-Å particle by a factor of ≈0.3, whereas a 0.2-Å x, y error leaves the signal almost unchanged (26). A second limitation comes from the errors in the measurement of the defocus used to record images. This error has been estimated to be ≈100 Å for images containing carbon film and ≈1,000 Å for images without carbon. The imaged specimen area included in each micrograph contained ≈50% carbon, and the virus particles themselves also contributed significantly to the Thon ring pattern used to determine the defocus. If we assume a defocus error of 300 Å, we expect the signal in the reconstruction to be attenuated by a further factor of 0.4. Other limitations that are not detectable as easily include magnification variations among images (27) and unintentional beam tilt. Finally, the data were not corrected for the curvature of the Ewald sphere, introducing a phase error of ≈60° at 3.8-Å resolution (28), which will further attenuate the signal in the reconstruction by a factor of ≈0.5. The attenuation therefore is similar to that expected for a defocus error of half the particle diameter (350 Å).
The ability to trace the protein backbone in a structure introduces powerful additional constraints, which have been used in x-ray crystallography to improve the density map and ultimately the coordinates (“refinement”). Now that traceable maps also can be obtained by using single-particle reconstruction from cryo-EM, new refinement methods can be considered. For example, a partial model of a structure could be used to improve the reference used for particle alignment. A partial model also could be used to evaluate the quality of a structure and thus to provide an additional constraint in a refinement or to derive masks that reduce or remove noisy parts of the reconstructed image.
Materials and Methods
EM.
Two batches of rotavirus DLPs were prepared as described (29). DLP stock solution was diluted to ≈5 mg/ml, and 2 μl of batch no. 1 was applied to lacy carbon grids, whereas 2 μl of batch no. 2 was applied to C-flat holey carbon grids (CF-1/2–4C; Electron Microscopy Sciences). Images were collected on Kodak ISO163 film by using an FEI F30 electron microscope at 300 kV, ×59,000 magnification, and a Gatan 626 cryo holder. We used an underfocus of 1.1–3.5 μm and an electron dose of 15–20 e−/Å. The spot size was set to 6, and a C2 aperture of 50 μm was used, giving a beam cross-over of ≈5 nm and divergence of 5 μrad. This results in a spatial coherence width of ≈600 Å (30), sufficient to preserve contrast at 3.8-Å resolution and 3.5-μm defocus. The beam pivot points were centered with the specimen at eucentric height, and the beam tilt was aligned by aligning the objective rotation center. The condenser astigmatism was minimized, followed by coma-free alignment. These last two steps were repeated several times until there was no further improvement. Wherever possible, the beam was placed symmetrically over a hole in the carbon film to ensure the presence of carbon on all sides of the illuminated area.
A calibrated magnification of 58,080 was used for contrast transfer correction and image processing by FREALIGN. A more accurate magnification of 56,900 subsequently was determined with a standard (tropomyosin paracrystal) and used to perform nonicosahedral averaging. Comparison with the structure determined by x-ray crystallography gave a magnification of 56,540, close to the calibrated value.
Image Processing.
We initially selected 386 micrographs by visual inspection and digitized them using a Zeiss SCAI scanner with a 7-μm step size, giving a pixel size on the specimen of ≈1.2 Å. Processing of the data was accelerated by initial decimation of the images with 2 × 2-pixel averaging. Power spectra from each micrograph (including both carbon and ice areas) were calculated to select for micrographs with preserved high-resolution signal. Then, 8,696 and 9,429 particles were selected from images of batch nos. 1 and 2, respectively, by using the computer program SIGNATURE (31). The astigmatic defocus, specimen tilt axis, and tilt angle for each micrograph were determined by using the computer program CTFTILT (32), giving separate defocus values for each particle according to its coordinate in the micrograph. The detected specimen tilt was unintentional and remained <5° for most micrographs.
By using the search function of the computer program FREALIGN (13) with a 1° angular step, particles collected from batch no. 1 initially were aligned against a structure of reovirus (33) filtered at 30-Å resolution and scaled to match the diameter of DLP. This step was followed by 70 cycles of refinement, converging to a structure of DLP. For the refinement, the density corresponding to the RNA genome was masked in the reference structure to enhance the signal of the ordered part of the structure. Particles collected from batch no. 2 were added and aligned to the DLP structure by using FREALIGN′s search function. Fifteen additional refinement cycles at the full resolution of 1.2 Å/pixel—followed by randomized parameter search (13), another refinement cycle, and a final selection of 8,400 particles with a correlation coefficient >0.14—resulted in a structure of 5.1-Å resolution before nonicosahedral averaging. For the randomized parameter search, a coarse search grid with angular step of 50° was used. This grid search was repeated 50 times for each particle by using random starting points, leading to different searched orientations in each grid search. The resolution was determined by using the FSC criterion and calculated between two reconstructions each containing half of the data and a threshold of 0.143 (34). A negative temperature factor of 450 Å2 (x-ray notation) was applied, and the structure was filtered at 3.8-Å resolution. The low-pass filter had a cosine-shaped cut-off with a width of ≈20 Fourier pixels.
Estimation of Alignment Errors.
A reference structure was calculated with half of the aligned data used to calculate the 5.1-Å icosahedral reconstruction. The reference was not improved with 13-fold nonicosahedral averaging. The alignment parameters then were altered by adding small angular perturbations with a uniform distribution of ±3° and small positional perturbations of ±3.5 Å. One cycle of refinement was carried out with FREALIGN, which brought most of the parameters of particles with a high correlation coefficient (see above) back close to their starting values before perturbation. Some particles were not refined successfully and ended up with a significantly lower correlation coefficient, compared with those refined successfully. These particles, and a small number of other particles with large angular deviations from the starting angles, were not considered further. The standard deviation between the refined and the starting parameters was calculated and used to estimate the parameter errors.
ACKNOWLEDGMENTS.
This work was supported by National Institutes of Health Grants GM-62580 (to N.G. and S.C.H.), CA-13202 (to S.C.H.), and AI-53174 (to P.R.D. and S.C.H.), an Ellison Medical Foundation New Scholars in Global Infectious Diseases Award (to P.R.D.), and grants from the Health Research Council of New Zealand (to R.B.). N.G. and S.C.H. are Howard Hughes Medical Institute Investigators.
Footnotes
Conflict of interest statement: P.R.D. is currently employed by Novartis Vaccines and Diagnostics.
Data deposition: Density maps of DLP and the nonicosahedrally averaged VP6 structure have been deposited in the Macromolecular Structure Database at the European Bioinformatics Institute, www.ebi.ac.uk/msd-srv/emsearch/index.html (accession codes 1460 and 1461, respectively).
See Commentary on page 1779.
References
- 1.Adrian M, Dubochet J, Lepault J, McDowall AW. Cryo-electron microscopy of viruses. Nature. 1984;308:32–36. doi: 10.1038/308032a0. [DOI] [PubMed] [Google Scholar]
- 2.Taylor KA, Glaeser RM. Electron diffraction of frozen, hydrated protein crystals. Science. 1974;186:1036–1037. doi: 10.1126/science.186.4168.1036. [DOI] [PubMed] [Google Scholar]
- 3.Henderson R. Realizing the potential of electron cryo-microscopy. Q Rev Biophys. 2004;37:3–13. doi: 10.1017/s0033583504003920. [DOI] [PubMed] [Google Scholar]
- 4.Gonen T, Sliz P, Kistler J, Cheng Y, Walz T. Aquaporin-0 membrane junctions reveal the structure of a closed water pore. Nature. 2004;429:193–197. doi: 10.1038/nature02503. [DOI] [PubMed] [Google Scholar]
- 5.Nogales E, Wolf SG, Downing KH. Structure of the αβ tubulin dimer by electron crystallography. Nature. 1998;391:199–203. doi: 10.1038/34465. [DOI] [PubMed] [Google Scholar]
- 6.Yonekura K, Maki-Yonekura S, Namba K. Complete atomic model of the bacterial flagellar filament by electron cryomicroscopy. Nature. 2003;424:643–650. doi: 10.1038/nature01830. [DOI] [PubMed] [Google Scholar]
- 7.Grigorieff N, Beckmann E, Zemlin F. Lipid location in deoxycholate-treated purple membrane at 2.6 Å. J Mol Biol. 1995;254:404–415. doi: 10.1006/jmbi.1995.0627. [DOI] [PubMed] [Google Scholar]
- 8.Frank J. Toward an understanding of the structural basis of translation. Genome Biol. 2003;4:237. doi: 10.1186/gb-2003-4-12-237. [DOI] [PMC free article] [PubMed] [Google Scholar]
- 9.Brink J, Sherman MB, Berriman J, Chiu W. Evaluation of charging on macromolecules in electron cryomicroscopy. Ultramicroscopy. 1998;72:41–52. doi: 10.1016/s0304-3991(97)00126-5. [DOI] [PubMed] [Google Scholar]
- 10.Jurica MS, Sousa D, Moore MJ, Grigorieff N. Three-dimensional structure of C complex spliceosomes by electron microscopy. Nat Struct Mol Biol. 2004;11:265–269. doi: 10.1038/nsmb728. [DOI] [PubMed] [Google Scholar]
- 11.Egelman EH. A robust algorithm for the reconstruction of helical filaments using single-particle methods. Ultramicroscopy. 2000;85:225–234. doi: 10.1016/s0304-3991(00)00062-0. [DOI] [PubMed] [Google Scholar]
- 12.Zeng X, Stahlberg H, Grigorieff N. A maximum likelihood approach to two-dimensional crystals. J Struct Biol. 2007;160:361–374. doi: 10.1016/j.jsb.2007.09.013. [DOI] [PMC free article] [PubMed] [Google Scholar]
- 13.Grigorieff N. FREALIGN: High-resolution refinement of single particle structures. J Struct Biol. 2007;157:117–125. doi: 10.1016/j.jsb.2006.05.004. [DOI] [PubMed] [Google Scholar]
- 14.Estes MK, Kapikian AZ. In: Fields Virology. Knipe DM, et al., editors. Philadelphia: Lippincott Williams & Wilkins/Wolters Kluwer; 2006. pp. 1917–1973. [Google Scholar]
- 15.Mathieu M, et al. Atomic structure of the major capsid protein of rotavirus: implications for the architecture of the virion. EMBO J. 2001;20:1485–1497. doi: 10.1093/emboj/20.7.1485. [DOI] [PMC free article] [PubMed] [Google Scholar]
- 16.Thon F. Zur defokussierungsabhängigkeit des phasenkontrastes bei der elektronenmikroskopischen abbildung. Z Naturforsch. 1966;21a:476–478. [Google Scholar]
- 17.Jones TA. In: Molecular Replacement. Dodson EJ, Gover S, Wolf W, editors. Warrington, UK: Science and Engineering Research Council Daresbury Lab; 1992. pp. 91–105. [Google Scholar]
- 18.Kleywegt GJ, Zou JY, Kjeldgaard M, Jones TA. In: International Tables for Crystallography. Rossmann MG, Arnold E, editors. Dordrecht, The Netherlands: Kluwer Academic; 2001. pp. 353–356.pp. 366–367. [Google Scholar]
- 19.Frank J, et al. SPIDER and WEB: Processing and visualization of images in 3D electron microscopy and related fields. J Struct Biol. 1996;116:190–199. doi: 10.1006/jsbi.1996.0030. [DOI] [PubMed] [Google Scholar]
- 20.Ludtke SJ, Baldwin PR, Chiu W. EMAN: Semiautomated software for high-resolution single-particle reconstructions. J Struct Biol. 1999;128:82–97. doi: 10.1006/jsbi.1999.4174. [DOI] [PubMed] [Google Scholar]
- 21.van Heel M, Harauz G, Orlova EV, Schmidt R, Schatz M. A new generation of the IMAGIC image processing system. J Struct Biol. 1996;116:17–24. doi: 10.1006/jsbi.1996.0004. [DOI] [PubMed] [Google Scholar]
- 22.Henderson R. The potential and limitations of neutrons, electrons and X-rays for atomic resolution microscopy of unstained biological molecules. Q Rev Biophys. 1995;28:171–193. doi: 10.1017/s003358350000305x. [DOI] [PubMed] [Google Scholar]
- 23.Bottcher B, Wynne SA, Crowther RA. Determination of the fold of the core protein of hepatitis B virus by electron cryomicroscopy. Nature. 1997;386:88–91. doi: 10.1038/386088a0. [DOI] [PubMed] [Google Scholar]
- 24.Conway JF, et al. Visualization of a 4-helix bundle in the hepatitis B virus capsid by cryo-electron microscopy. Nature. 1997;386:91–94. doi: 10.1038/386091a0. [DOI] [PubMed] [Google Scholar]
- 25.Glaeser RM. Review: Electron crystallography: Present excitement, a nod to the past, anticipating the future. J Struct Biol. 1999;128:3–14. doi: 10.1006/jsbi.1999.4172. [DOI] [PubMed] [Google Scholar]
- 26.Jensen GJ. Alignment error envelopes for single particle analysis. J Struct Biol. 2001;133:143–155. doi: 10.1006/jsbi.2001.4334. [DOI] [PubMed] [Google Scholar]
- 27.Aldroubi A, Trus BL, Unser M, Booy FP, Steven AC. Magnification mismatches between micrographs: Corrective procedures and implications for structural analysis. Ultramicroscopy. 1992;46:175–188. doi: 10.1016/0304-3991(92)90013-a. [DOI] [PubMed] [Google Scholar]
- 28.DeRosier DJ. Correction of high-resolution data for curvature of the Ewald sphere. Ultramicroscopy. 2000;81:83–98. doi: 10.1016/s0304-3991(99)00120-5. [DOI] [PubMed] [Google Scholar]
- 29.Street JE, Croxson MC, Chadderton WF, Bellamy AR. Sequence diversity of human rotavirus strains investigated by Northern blot hybridization analysis. J Virol. 1982;43:369–378. doi: 10.1128/jvi.43.2.369-378.1982. [DOI] [PMC free article] [PubMed] [Google Scholar]
- 30.Spence JCH. High-Resolution Electron Microscopy. Oxford: Oxford Univ Press; 2003. [Google Scholar]
- 31.Chen JZ, Grigorieff N. SIGNATURE: A single-particle selection system for molecular electron microscopy. J Struct Biol. 2007;157:168–173. doi: 10.1016/j.jsb.2006.06.001. [DOI] [PubMed] [Google Scholar]
- 32.Mindell JA, Grigorieff N. Accurate determination of local defocus and specimen tilt in electron microscopy. J Struct Biol. 2003;142:334–347. doi: 10.1016/s1047-8477(03)00069-8. [DOI] [PubMed] [Google Scholar]
- 33.Zhang X, et al. Features of reovirus outer capsid protein mu1 revealed by electron cryomicroscopy and image reconstruction of the virion at 7.0 Angstrom resolution. Structure (London) 2005;13:1545–1557. doi: 10.1016/j.str.2005.07.012. [DOI] [PMC free article] [PubMed] [Google Scholar]
- 34.Rosenthal PB, Henderson R. Optimal determination of particle orientation, absolute hand, and contrast loss in single-particle electron cryomicroscopy. J Mol Biol. 2003;333:721–745. doi: 10.1016/j.jmb.2003.07.013. [DOI] [PubMed] [Google Scholar]
- 35.Pettersen EF, et al. UCSF CHIMERA: A visualization system for exploratory research and analysis. J Comput Chem. 2004;25:1605–1612. doi: 10.1002/jcc.20084. [DOI] [PubMed] [Google Scholar]


