Abstract
Smooth muscle is unique in its ability to maintain force at low MgATP consumption. This property, called the latch state, is more prominent in tonic than phasic smooth muscle. Studies performed at the muscle strip level have suggested that myosin from tonic muscle has a greater affinity for MgADP and therefore remains attached to actin longer than myosin from phasic muscle, allowing for cross-bridge dephosphorylation and latch-bridge formation. An alternative hypothesis is that after dephosphorylation, myosin reattaches to actin and maintains force. We investigated these fundamental properties of smooth muscle at the molecular level. We used an in vitro motility assay to measure actin filament velocity (νmax) when propelled by myosin purified from phasic or tonic muscle at increasing [MgADP]. Myosin was 25% thiophosphorylated and 75% unphosphorylated to approximate in vivo conditions. The slope of νmax versus [MgADP] was significantly greater for tonic (−0.51 ± 0.04) than phasic muscle myosin (−0.15 ± 0.04), demonstrating the greater MgADP affinity of myosin from tonic muscle. We then used a laser trap assay to measure the unbinding force from actin of populations of unphosphorylated tonic and phasic muscle myosin. Both myosin types attached to actin, and their unbinding force (0.092 ± 0.022 pN for phasic muscle and 0.084 ± 0.017 pN for tonic muscle) was not statistically different. We conclude that the greater affinity for MgADP of tonic muscle myosin and the reattachment of dephosphorylated myosin to actin may both contribute to the latch state.
Keywords: velocity, phosphorylation, laser trap, in vitro motility, latch state
smooth muscle is involved in a broad range of physiological processes, such as blood vessel tone maintenance and intestinal peristalsis. Two types of smooth muscle have originally been described based on their electrophysiological properties (30). Tonic smooth muscle is defined as slowly contracting, multiunit, and tone maintaining, as found in most blood vessels, whereas phasic smooth muscle is defined as rapidly contracting and single unit, as in the intestine. Tonic and phasic smooth muscles also differ in their expression of NH2-terminus myosin heavy chain (MHC) and essential light chain (LC17) isoforms. Tonic muscle expresses predominantly the (−)insert smooth muscle MHC (SMMHC) and LC17b isoforms, whereas phasic muscle expresses mostly the (+)insert SMMHC and LC17a isoforms (23, 40). It is generally agreed that the regulation of smooth muscle is predominantly achieved by phosphorylation of regulatory light chains (LC20) (29). Interestingly, Dillon and coworkers (6) have shown in carotid artery muscle strips that although the rate of shortening is correlated with LC20 phosphorylation, force can be maintained for long periods of time even after dephosphorylation of most cross-bridges. This property, called the latch state, remains poorly understood. Many theories have been suggested to explain this unique ability of smooth muscle to maintain force at low energy cost. Dillon et al. (6) suggested that if cross-bridges were dephosphorylated while attached to actin, they would remain attached and sustain force while no longer cycling or cycling slowly. From work performed at the muscle strip level, Fuglsang and coworkers (9) proposed that the affinity for ADP (MgADP) of tonic smooth muscle myosin, where latch is most evident, is higher than that of phasic smooth muscle myosin. Because MgADP release from myosin is necessary for its detachment from actin (31), an attractive mechanism to explain the latch state is that due to its greater affinity for MgADP, tonic muscle myosin remains attached longer to actin and gets dephosphorylated while attached (13), thus creating latch-bridges. Hai and Murphy (13) even suggested that dephosphorylation may induce the latch state simply by reducing the rate of MgADP release from cross-bridges. However, this has never been investigated at the molecular level.
Alternative views of the latch state also exist. For instance, instead of remaining attached after dephosphorylation, myosin might have the ability of reattaching to actin by a Ca2+-dependent regulatory mechanism other than myosin LC20 phosphorylation (28), or some cooperativity mechanism between phosphorylated and dephosphorylated myosin may allow dephosphorylated myosin to reattach to actin (15, 38). However, the attachment of dephosphorylated myosin to actin has never been demonstrated at the molecular level. Indeed, biochemical studies have reported that unphosphorylated myosin is in a bent conformation so it may not have the capacity to attach to actin (34, 35).
In the present study, we investigated fundamental mechanical properties of smooth muscle myosin to gain more information about the mechanisms responsible for the latch state. We used an in vitro motility assay to estimate the affinity for MgADP of myosin purified from tonic and phasic smooth muscle at different levels of LC20 phosphorylation. Furthermore, we used a laser trap assay to verify if unphosphorylated myosin purified from tonic and phasic smooth muscle can bind to actin. Our results demonstrate that the velocity of actin filament movement (νmax) decreases with increasing [MgADP] but that at low levels of phosphorylation, the decrease is more pronounced for myosin from tonic than phasic smooth muscle. These results demonstrate a greater affinity of tonic smooth muscle myosin for MgADP at low phosphorylation levels. Furthermore, we found that unphosphorylated myosin of both tonic and phasic smooth muscles can attach to actin and that their unbinding force (Funb) is not significantly different.
MATERIALS AND METHODS
Proteins.
Myosin was purified from the bovine aorta (24) and chicken gizzard (8, 33) as previously described. Thiophosphorylation was performed using Ca2+, calmodulin (P2277, Sigma-Aldrich Canada), myosin light chain kinase (a generous gift from Dr. J. Haeberle, University of Vermont), and ATPγS (A1388, Sigma-Aldrich Canada) (35). Actin was purified from chicken pectoralis acetone powder (26) and fluorescently labeled by an incubation with tetramethylrhodamine isothiocyanate (TRITC)-labeled phalloidin (P1951, Sigma-Aldrich Canada) (39).
Western blot analysis of total and (+)insert SMMHC tissue content.
Total SMMHC and (+)insert isoform content of the gizzard and aorta after protein purification was verified by Western blot analysis. The amount of proteins loaded on the gel was assessed by a Bradford assay. Electrophoresis was done on a 6% SDS polyacrylamide gel using a Laemmli buffer system. Proteins were electroblotted onto nitrocellulose membranes (Bio-Rad Laboratories, Mississauga, ON, Canada). Membranes were probed either with a polyclonal antibody that specifically recognizes the seven-amino acid insert QGPSFAY [a generous gift from A. Rovner, University of Vermont (40)] or with a polyclonal SMMHC antibody that recognizes all SMMHC isoforms (Biomedical Technologies, Stoughton, MA). Antibody detection was done by enhanced chemiluminescence (Amersham Biosciences, Piscataway, NJ), and quantification was performed with a Fluorchem 8500 imaging system using AlphaEase software (Alpha Innotech).
Buffers.
Myosin buffer (300 mM KCl, 25 mM imidazole, 1 mM EGTA, 4 mM MgCl2, and 30 mM DTT; pH adjusted to 7.4) and actin buffer (25 mM KCl, 25 mM imidazole, 1 mM EGTA, 4 mM MgCl2, and 30 mM DTT, with an oxygen scavenger system consisting of 0.1 mg/ml glucose oxidase, 0.018 mg/ml catalase, and 2.3 mg/ml glucose; pH adjusted to 7.4) were used for both the in vitro motility assay and Funb experiments. The motility assay buffer consisted of actin buffer to which MgATP (2 mM) and increasing concentrations of MgADP (0, 0.1, 0.2, 0.4, 0.6, 0.8, and 1 mM) were added. The ionic strength was kept constant by adjusting KCl (4). Methylcellulose (0.5%) was added to favor binding between actin and myosin. The laser trap unbinding assay buffer consisted of actin buffer to which MgATP (200 μM) and methylcelullose (0.3%) were added.
In vitro motility assay.
νmax was measured in the in vitro motility assay following a previously described protocol (21) with slight modifications. Briefly, ultracentrifugation (Optima TLX ultracentrifuge and TLA-120.2 rotor, Beckman Coulter, Fullerton, CA) of myosin (500 μg/ml) with equimolar filamentous actin and 1 mM MgATP in myosin buffer was performed to eliminate nonfunctional heads. Unphosphorylated and phosphorylated myosins were mixed to obtain 100% unphosphorylated, 25% phosphorylated (25% phosphorylated-75% unphosphorylated), or 100% phosphorylated myosin. (Note that ATPγS was used to obtain a permanent phosphorylation level throughout the period of the experiments.) The desired myosin mixture was perfused in a flow-through chamber (30 μl) constructed from a nitrocellulose-coated coverslip and a glass microscope slide (39). Incubation for 2 min allowed random attachment of myosin to the nitrocellulose and was followed by the addition of BSA (0.5 mg/ml in actin buffer), unlabeled G-actin (10 μM in actin buffer), MgATP (1 mM in actin buffer), actin buffer (two washes), TRITC-labeled actin (10 μM in actin buffer) incubated for 1 min, and motility assay buffer. For myosin MgADP affinity experiments, different MgADP concentrations were applied in random order. The flow-through chamber was transferred to the stage of an inverted microscope (IX70, Olympus, Melville, NY) equipped with a high numerical aperture objective (×100 magnification Ach 1.25 numerical aperture, Olympus, Melville, NY) and rhodamine epifluorescence. An image intensified video camera (VE1000SIT, Dage-MTI, Michigan City, IN) was used to visualize and record the actin filament movement on videotape (SVO-5800, Sony of America, New York, NY). Actin images were digitized (VG5 PCI RS170, Scion, Frederick, MD), and νmax was determined from the total path described by the filaments divided by the elapsed time using National Institutes of Health tracking software (NIH macro in Scion Image 4.02, Scion). All experiments were performed at 30°C.
Funb measurements.
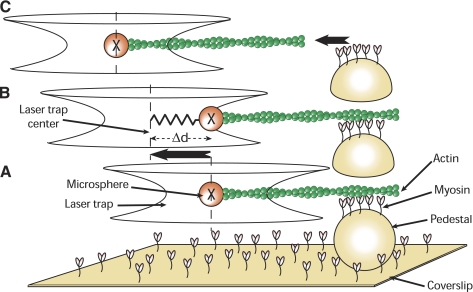
A single beam laser trap assay (Fig. 1) was built using the Laser Tweezers Workstation (Cell Robotics, Albuquerque, NM) combined to the motility assay to perform Funb measurements. Before being coated with nitrocellulose, coverslips were sprayed with 4.5-μm polystyrene microspheres (Polybead, Polysciences, Warrington, PA), which served as pedestals. The trapping microspheres were 3-μm polystyrene microspheres (Polybead, Polysciences) coated with N-ethylmaleimide-modified skeletal myosin (a generous gift from Dr. P. VanBuren, University of Vermont), as previously described (21, 39). Proteins and solutions were prepared as for the motility assay except that TRITC-labeled actin was mixed with microspheres (13 × 103 microspheres/μl) in the unbinding assay buffer. One microsphere, visualized in bright field by a charge-coupled device camera (XC-75, Sony of America), was captured in the trap, and its position was recorded as described above. An actin filament, visualized by fluorescence imaging as described above, was attached to the microsphere and brought down in contact with myosin molecules randomly adhered to a pedestal (Fig. 1A). Approximately 10 s were allowed for the interaction between myosin and actin to occur. This established the baseline position of the microsphere in the trap, and the trap was then moved away from the pedestal at a constant velocity of 4 μm/s. Despite the trap being pulled away, the microsphere did not move until the force exerted by the trap on the microsphere was greater than that exerted by the myosin molecules on the actin filament (Fig. 1B). At this point, the microsphere sprang back to its unloaded baseline position in the center of the trap (Fig. 1C). The total Funb of the myosin molecules was calculated as follows:
 |
(1) |
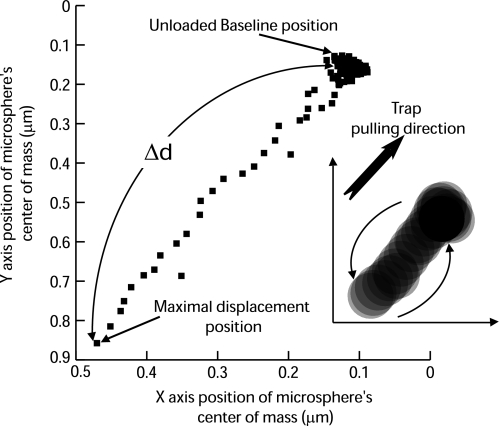
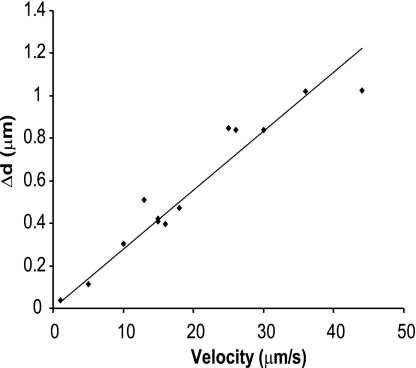
where k is the trap stiffness and Δd is the maximal displacement of the center of mass of the trapped microsphere from its baseline position (Fig. 2). k was calibrated by applying a viscous drag [or Stokes force (Ff)] to a trapped microsphere by moving it at a constant velocity (v) in 0.3% methylcellulose and measuring the displacement (Δd) of the center of mass of the microsphere from the trap center (Fig. 3). Ff on the microsphere was calculated as follows:
 |
(2) |
where η is viscosity and r is the microsphere radius. The viscosity of 0.3% methylcellulose was measured with a viscometer (DV-I at 60 rpm, Brookfield, Middleboro, MA). Thus,
 |
(3) |
The value of k used was the average of multiple measurements performed at many velocities. The reproducibility of the calibration and linearity of the trap stiffness are shown in Fig. 3.
Fig. 1.
A: a single beam laser trap is used to capture a 3-μm-diameter microsphere coated with N-ethylmaleimide-modified myosin. A tetramethylrhodamine isothiocyanate (TRITC)-labeled actin filament is attached to the microsphere and brought in contact with unphosphorylated myosin randomly adhered to a 4.5-μm pedestal on a coverslip. B: after time is allowed for the binding of unphosphorylated myosin to actin, the laser trap is moved away from the pedestal at constant velocity. Initially, the microsphere remains at the same position, now offset from the center of the trap. C: when the pulling force exerted by the trap exceeds the binding force of the unphosphorylated myosin molecules, the microsphere springs back into the trap center, its unloaded position. Unbinding force (Funb) is equal to the product of the maximal distance between the bead and trap center [maximal displacement (Δd)] by the trap stiffness [calibrated using the Stokes force method (7)].
Fig. 2.
Representative microsphere center of mass (in x and y) with respect to the trap center during the unbinding assay. The Δd from the unloaded baseline position was measured and multiplied by the trap stiffness to obtain Funb. Inset: superimposed microsphere positions while the trap was pulled toward the upper right direction. The microsphere remained at the same position while the trap was pulled away, showing a displacement with respect to the trap. When actin was released from myosin, the bead sprang back to its unloaded baseline position.
Fig. 3.
Trap calibration in 0.3% methylcellulose. The trapped microsphere was moved at increasing velocity (1.5–50 μm/s) in 0.3% methylcellulose, and its Δd with respect to the center of the trap was measured. Linear regression showed a very good fit (R2 = 0.92).
Funb is reported as the average force per myosin molecule, calculated by dividing the measured Funb by the number of myosin molecules estimated per actin filament length (37), which was, in turn, measured by imaging with the SIT camera. The concentration of myosin used was 0.1 mg/ml, and the number of myosin molecules in contact with actin was estimated to be 24 myosin molecules/μm actin filament (37).
Because Funb measurements were performed on unphosphorylated myosin, the viability of the myosin was assessed by measuring νmax of a 100% phosphorylated sample from the same purification. Furthermore, Funb control experiments were performed by bringing actin filaments in contact with pedestals coated with BSA instead of myosin molecules. No attachment was observed with BSA.
Statistical analysis.
Differences in Funb and νmax between myosin purified from tonic and phasic smooth muscles were tested using a Student's t-test and a Wilcoxon signed rank test, respectively. Differences in the slopes of νmax versus MgADP were tested using a Student's t-test applied to the linear regressions.
RESULTS
Western blot analysis of total SMMHC and the (+)insert isoform.
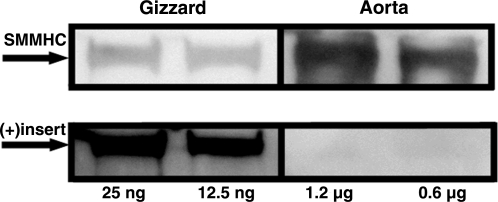
The content of total SMMHC and the (+)insert isoform of the purified chicken gizzard (phasic) and bovine aorta (tonic) was quantified by Western blot analysis (Fig. 4). A strong signal was observed for the (+)insert isoform in the chicken gizzard smooth muscle, but it was not detected in the aorta. These data suggest that, as previously reported for other tissues (40), the chicken gizzard and bovine aorta are essentially constituted of the (+) and (−)insert isoforms, respectively.
Fig. 4.
Total smooth muscle myosin heavy chain (SMMHC) and (+)insert isoform content of purified phasic [chicken gizzard (CG)] and tonic (bovine aorta) smooth muscle as assessed by Western blot analysis. Arrows indicate 200 kDa. Twenty-five and 12.5 ng of total protein were loaded for the chicken gizzard, whereas 1.2 and 0.6 μg of total protein were loaded for the aorta.
Affinity of tonic and phasic smooth muscle myosins for MgADP.
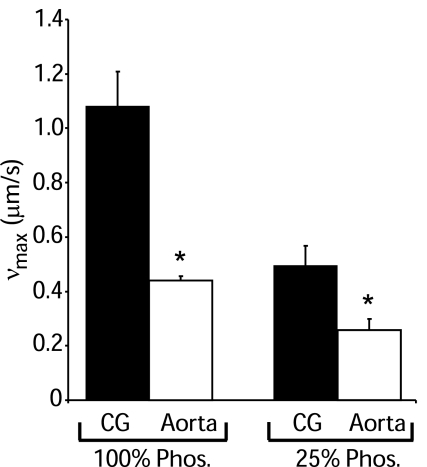
The rate of actin filament movement (νmax) when propelled by myosin from tonic and phasic smooth muscle was assessed using the in vitro motility assay. First, νmax for fully phosphorylated tonic and phasic smooth muscle myosin was measured. In accordance with the literature (17, 21, 27), νmax for 100% phosphorylated myosin from phasic muscle (1.08 ± 0.12 μm/s, mean ± SD) was significantly faster (P < 0.001) than for 100% phosphorylated myosin from tonic muscle (0.44 ± 0.02 μm/s; Fig. 5). Next, we measured νmax for 25% phosphorylated myosin to mimic in vivo steady-state conditions (6). We observed significantly slower (P < 0.001) νmax for both myosin types compared with their respective 100% phosphorylated values (Fig. 5). The 25% phosphorylated myosin from phasic muscle was also approximately twofold faster (P < 0.001) than 25% phosphorylated myosin from tonic muscle (0.50 ± 0.07 μm/s for phasic muscle vs. 0.26 ± 0.04 μm/s for tonic muscle; Fig. 5).
Fig. 5.
Baseline velocity of actin filament movement (νmax) for 100% phosphorylated and 25% phosphorylated tonic and phasic smooth muscle myosin as assessed by the in vitro motility assay in the presence of 2 mM MgATP and the absence of MgADP.
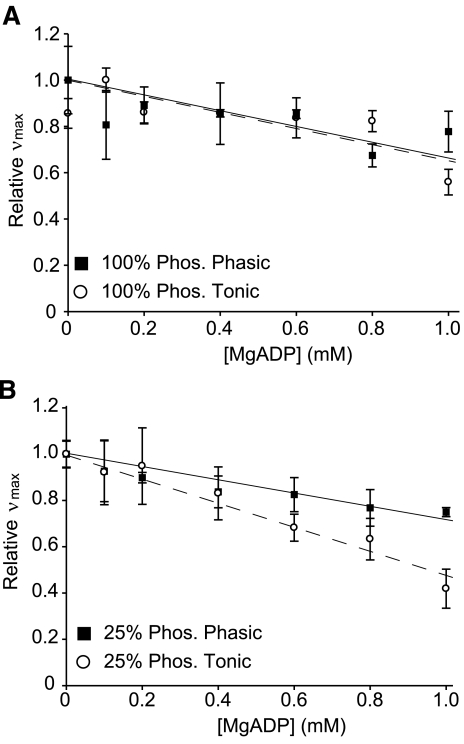
To estimate the difference in affinity for MgADP between tonic and phasic muscle myosin, we measured νmax at increasing MgADP concentrations at a phosphorylation level of 100%. νmax for both phasic and tonic smooth muscle myosin decreased with increasing MgADP (Fig. 6A). Linear regression of νmax versus [MgADP] at the 100% phosphorylation level resulted in slopes that were not statistically different between phasic (−0.30 ± 0.11, R2 = 0.96) and tonic (−0.34 ± 0.08, R2 = 0.98) muscle myosin (Fig. 6A).
Fig. 6.
Relative νmax (normalized to νmax at 0 mM MgADP) at increasing concentrations of MgADP for 100% phosphorylated tonic or phasic smooth muscle myosin (A) and 25% phosphorylated tonic or phasic smooth muscle myosin (B). There were no statistically significant differences between the slopes of the regression lines of 100% phosphorylated tonic and phasic muscle myosin, but there was a significant difference between 25% phosphorylated tonic and phasic muscle myosin (P > 0.0001).
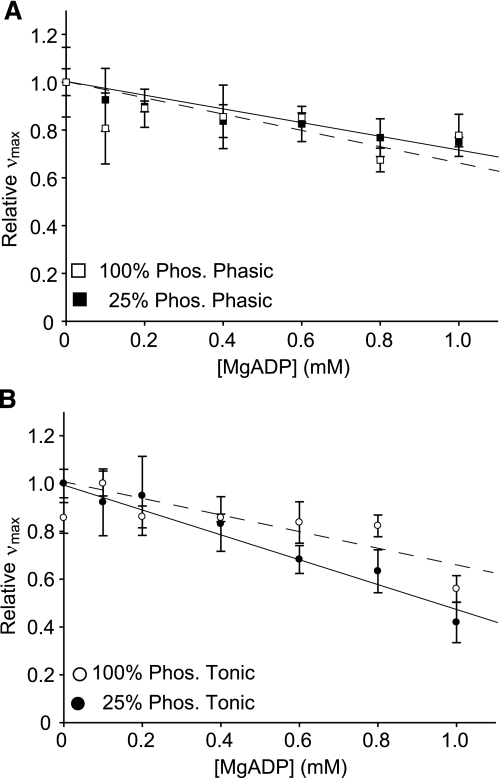
To test if the affinity of smooth muscle myosin for MgADP is affected by the level of phosphorylation, we measured νmax at increasing [MgADP] for 25% phosphorylated phasic and tonic muscle myosin (Fig. 6B). In contrast to the results at 100% phosphorylation (Fig. 6A), the slopes at 25% phosphorylation were different between phasic and tonic muscle myosin. The slope for tonic muscle myosin was significantly steeper (−0.52 ± 0.10, R2 = 0.96) than that of phasic muscle (−0.29 ± 0.07, R2 = 0.98). The steeper slope of tonic muscle myosin suggests a greater affinity for MgADP at low phosphorylation levels. Indeed, the concentrations of MgADP necessary to reach half the initial νmax value (i.e., Ki values) were 0.96 mM for tonic muscle (measured) and 1.74 mM for phasic muscle (extrapolated). Furthermore, the slopes for phasic muscle myosin at 100% phosphorylation (−0.30 ± 0.11, R2 = 0.96) and at 25% phosphorylation (−0.29 ± 0.07, R2 = 0.98) were almost identical (Fig. 7A), whereas the slopes for tonic muscle myosin at 100% phosphorylation (−0.34 ± 0.08, R2 = 0.98) and at 25% phosphorylation (−0.52 ± 0.10, R2 = 0.96) were significantly different (P < 0.001; Fig. 7B). This later result suggests that the phosphorylation level affects tonic and phasic muscle myosin affinity for MgADP differently.
Fig. 7.
Relative νmax (normalized to νmax at 0 mM MgADP) at increasing concentrations of MgADP at 100% and 25% phosphorylation for phasic (A) and tonic smooth muscle myosin (B). The slopes of the regression lines were not significantly different between 100% and 25% phosphorylation for phasic muscle myosin but were significantly different for tonic muscle myosin (P > 0.001).
Funb of unphosphorylated myosin from tonic and phasic smooth muscle.
To verify if unphosphorylated myosin can bind to actin and to quantify its attachment force, we used a single beam laser trap assay and measured the Funb of unphosphorylated tonic and phasic muscle myosin. Table 1 shows Funb per myosin molecule in contact with the actin filament. Funb was not significantly different between tonic (0.084 ± 0.017 pN) and phasic (0.092 ± 0.022 pN) muscle myosin. These values are approximately one order of magnitude smaller than the previously reported unitary force generated by phosphorylated myosin, i.e., ∼1 pN (21) and ∼0.6 pN (36, 37) (Table 1).
Table 1.
Comparison of Funb generated by unphosphorylated myosin and Funi generated by phosphorylated myosin
| Funb, pN |
Funi, pN | |||
|---|---|---|---|---|
| Unphosphorylated Tonic Myosin | Unphosphorylated Phasic Myosin | Phosphorylated Tonic HMM Construct | Phosphorylated Phasic HMM Construct | |
| Average force per smooth muscle myosin heavy chain molecule | 0.084±0.017 | 0.092±0.022 | 1.2±0.1* | 0.9±0.1* |
| Number of events | 8 | 6 | 8 | 7 |
| Average Funi (range) | 0.6 (0.4–0.8)† | |||
Values are means ± SD for unbinding force (Funb) and means ± SE for unitary force (Funi). Average Funb values of unphosphorylated tonic and phasic muscle myosin molecules were measured by the single beam laser trap assay. For comparison purposes, Funi and average Funi values for phosphorylated heavy meromyosin (HMM) are shown, as measured with the dual-beam laser trap assay and microneedle, respectively.
Data from Ref. 21;
data from Ref. 37.
DISCUSSION
The major findings of this study are as follows: 1) the affinity for MgADP of myosin from tonic muscle, at low phosphorylation conditions (25% phosphorylation), is significantly greater than that of myosin from phasic muscle; 2) the affinity for MgADP of myosin from tonic muscle is greater at low (25% phosphorylation) than high (100% phosphorylation) phosphorylation levels; 3) unphosphorylated myosin from tonic and phasic smooth muscle can attach to actin; and 4) the force of attachment of unphosphorylated myosin from tonic smooth muscle is not statistically different from that of phasic smooth muscle.
Affinity of tonic and phasic smooth muscle myosin for MgADP.
Several studies have suggested that tonic and phasic smooth muscles have a different affinity for MgADP. Somlyo and coworkers (9, 18) showed that relaxation from rigor, induced by flash photolysis of caged MgATP, is significantly impeded in tonic smooth muscle strips in the presence of MgADP. In contrast, relaxation from rigor of phasic smooth muscle is much faster and barely affected by the addition of MgADP. Similarly, Lofgren and coworkers (22) demonstrated that the rate of shortening, as measured by the quick-release technique, decreases more rapidly as a function of [MgADP] in tonic than phasic smooth muscle strips. Force and stiffness measurements performed in (+)insert isoform knockout mice bladder muscle strips also suggested a slower MgADP off rate in the homozygous negative compared with homozygous positive or heterozygous mice (16). All these studies, however, were performed at the muscle strip level and were extrapolated to molecular level mechanisms.
To verify that the greater affinity for MgADP of tonic smooth muscle over phasic smooth muscle relies on differences at the myosin molecular level, we used the in vitro motility assay and tested the effect of [MgADP] on actin propulsion. Although previous studies have shown that intracellular free [MgADP] is in the range of 44 to 123 μM (1, 20), it is also known that MgADP may be available in greater concentrations around myosin heads due to its binding to actin and other proteins (3). Because no specific data are available on local [MgADP] around myosin heads, we used a range from 0 to 1 mM in the in vitro motility assay. The fact that our results are in agreement with previous tissue experiments (9, 18) suggests that these concentrations are physiological.
Increasing [MgADP] in the motility milieu should hinder the release of MgADP from the myosin nucleotide binding pocket. Because MgADP release is the rate-limiting step for νmax (31), the greater the affinity for MgADP, the more pronounced will be the reduction in νmax. We found that when myosin was fully phosphorylated, there was no difference in the slopes of νmax versus [MgADP] between tonic and phasic smooth muscle myosin (Fig. 6A). Rovner and coworkers (27) previously reported similar results when measuring νmax for 100% phosphorylated (+)insert and (−)insert isoform constructs at increasing MgADP concentrations, although they had the confounding effect of ionic strength correction by MgATP adjustments. However, the fact that our initial results at 100% phosphorylation disagreed with the results obtained from measurements performed at the muscle strip level (9, 18) led us to repeat these experiments at lower levels of phosphorylation. Indeed, it is important to note that steady-state phosphorylation levels in whole tissue or whole organs are never as high as 100%.
To test if the affinity of tonic muscle myosin is different from that of phasic muscle myosin at physiological phosphorylation levels, we repeated the νmax measurements but with myosin that was only 25% phosphorylated. Under those conditions, MgADP slowed actin to a greater extent when propelled by myosin from tonic than phasic muscle (Fig. 6B). These results confirm that at physiological phosphorylation levels, myosin from tonic muscle has a greater affinity for MgADP than phasic muscle myosin. It is worth noting, however, that a laser trap study (21) and a study (19) of fluorescence transients of the ADP analog 3′-deac-eda-ADP reported differences in MgADP release rates between phasic and tonic muscle myosin even at high thiophosphorylation levels, whereas we observed differences only at low phosphorylation levels (Figs. 6 and 7). It is possible that differences in strain conditions affected the release of MgADP by the myosin head, as previously suggested (2). Further studies will be needed to directly compare the behavior of dephosphorylated and unphosphorylated myosin and their roles in the latch state. Moreover, the mechanism by which LC20 phosphorylation/dephosphorylation somehow interacts with the presence or absence of the seven-amino acid insert in the surface loop of the heavy chain will also need further investigation.
The light chain binding domain of smooth muscle myosin is known to rotate by ∼23° upon release of MgADP (10, 11, 32, 41). This rotation is not observed in skeletal muscle and is thought to play a role in the smooth muscle economy of force maintenance because detachment of smooth muscle myosin would require an additional strain-dependant step (10, 11, 32, 41). For tonic muscle myosin, this mechanism could work in concert with the greater affinity for MgADP, leading to a greater potential to get into the latch state.
It is important to note that our in vitro motility measurements were performed at saturating [MgATP] (2 mM) to rule out any effect of [MgATP] on our results. However, phasic smooth muscle is known to have a greater [MgATP] than tonic smooth muscle (5). This greater MgATP content of phasic muscle might compete with bound MgADP and promote its release, and this effect would be additive to our present results, i.e., greater release of MgADP in phasic muscle.
Another interesting point that emerged from our νmax versus [MgADP] data is that better fits were obtained by linear regression than with logarithmic decays, and this was for both myosin types. This suggests that the behavior of smooth muscle myosin with increasing MgADP concentrations was not following a Michaelis-Menten kinetics model. Linear regression also yielded the best fits in other studies using the in vitro motility assay with the (+)insert and (−)insert isoform constructs (27) as well as the quick-release assay with tonic and phasic smooth muscle (22).
Because our purification procedures yielded essentially pure myosin devoid of contaminating proteins, the mechanical results reported here reflect properties of the myosin molecules themselves. Phasic muscle myosin expresses mostly MHC that includes the seven-amino acid insert in the surface loop above the nucleotide binding pocket [the (+)insert isoform], whereas tonic muscle mostly expresses MHC without the insert [the (−)insert isoform] (40). Western blot analysis of our purified myosin also showed that the chicken gizzard had a much greater content of the (+)insert isoform than the bovine aorta, in which (+)insert isoform expression was below the level of detection (Fig. 4). It must be mentioned, however, that another potentially relevant variable is LC17 isoform composition. In our study, we had no control over light chain isoforms, so purified myosin proteins were extracted with the same LC17 isoforms that they associated with in vivo. Nonetheless, it has previously been demonstrated with recombinant myosin constructs that LC17 isoforms do not alter the myosin mechanical properties in the in vitro motility assay, thus attributing the twofold difference in νmax between (+) and (−)insert isoforms to the insert itself (27). Nonetheless, the role of LC17 has not been addressed at low LC20 phosphorylation levels, but a similar, although not equal, relative difference in νmax between phasic and tonic muscle myosin was observed at 25% and 100% phosphorylation levels (Fig. 5). These results suggest that LC17 isoforms do not alter, to any large extent, νmax at low LC20 phosphorylation levels as at high levels of phosphorylation.
Funb of unPHOS myosin from tonic and phasic smooth muscle.
Using a single beam laser trap assay, we directly measured the actomyosin Funb of a population of unphosphorylated myosin from both tonic and phasic smooth muscle. We found that both tonic and phasic unphosphorylated smooth muscle myosin can bind to actin and that the attachment force is not different. The advantage of our assay over a single-myosin molecule technique is that it measures the binding force from many myosin molecules at a time, thus increasing the signal-to-noise ratio and neglecting compliance in the system, such as microsphere-actin linkages (12, 25). Therefore, by correcting for the number of myosin molecules, our system allows the detection of forces lower than those generated by cycling phosphorylated myosin molecules. The limitation of our assay was the precision of the actin length measurements by fluorescence imaging. This effect was reduced by using long filaments attached to many myosin molecules on a large pedestal, thereby increasing contact length and improving resolution.
Using the in vitro motility mixture assay and mathematical modeling relating νmax to the unitary force generated by myosin, Harris and coworkers (14) previously predicted an unphosphorylated-to-phosphorylated force ratio of 0.11 for gizzard smooth muscle myosin. Given that the unitary force generated by phasic muscle phosphorylated myosin has been reported to be between 0.6 (36, 37) and 1 pN (21), a value between 0.11 and 0.06 pN was expected for unphosphorylated myosin binding force. Indeed, these predictions are in agreement with our measured values of 0.084 and 0.092 pN for tonic and phasic muscle myosin, respectively (Table 1).
Finally, the fact that there is no difference in Funb between tonic and phasic 25% phosphorylated myosin is in agreement with their proportional decreases in νmax from high to low phosphorylation levels. That is, if at low phosphorylation levels the binding of unphosphorylated myosin to actin is what reduces νmax, then similar binding forces for tonic and phasic smooth muscle myosin should reduce their νmax proportionally. Indeed, we measured a proportional decrease in νmax (Fig. 5).
In conclusion, we demonstrated, at the molecular level, that at low phosphorylation levels, myosin from tonic muscle has a greater affinity for MgADP than myosin from phasic muscle. Furthermore, we showed that unphosphorylated tonic and phasic muscle myosin can bind to actin and generate a load. Further studies will be required to elucidate if, in a fully regulated system, both the dephosphorylation of attached cross-bridges and the reattachment of myosin molecules that have undergone dephosphorylation contribute to the latch state. Finally, more studies will be required to determine the contribution of these two mechanisms to the latch state in the context of all the other mechanisms proposed to date.
GRANTS
This work was supported by a Natural Sciences and Engineering Research Council of Canada (NSERC) grant, National Heart, Lung, and Blood Institute Grant R33-HL-087791, and the Costello Fund. The Meakins-Christie Laboratories (McGill University Health Centre Research Institute) are supported in part by a center grant from Le Fonds de la Recherche en Santé du Québec (FRSQ). A.-M. Lauzon is recipient of a FRSQ salary award, R. Léguillette was a fellow of the Canadian Institutes of Health Research, and L. M. Fong was a fellow of NSERC.
Acknowledgments
The authors thank Dr. Chi-Ming Hai for numerous enlightening discussions.
The costs of publication of this article were defrayed in part by the payment of page charges. The article must therefore be hereby marked “advertisement” in accordance with 18 U.S.C. Section 1734 solely to indicate this fact.
REFERENCES
- 1.Askenasy N, Koretsky AP. Transgenic livers expressing mitochondrial and cytosolic CK: mitochondrial CK modulates free ADP levels. Am J Physiol Cell Physiol 282: C338–C346, 2002. [DOI] [PubMed] [Google Scholar]
- 2.Baker JE, Brosseau C, Fagnant P, Warshaw DM. The unique properties of tonic smooth muscle emerge from intrinsic as well as intermolecular behaviors of Myosin molecules. J Biol Chem 278: 28533–28539, 2003. [DOI] [PubMed] [Google Scholar]
- 3.Butler T, Davies R. High-energy phosphates in smooth muscle. In: Handbook of Physiology. The Cardiovascular System. Vascular Smooth Muscle. Bethesda, MD: Am. Physiol. Soc., 1980, sect. 2, vol. II, chapt. 10, p. 237–252.
- 4.Chang R Physical Chemistry With Applications to Biological Systems. New York: MacMillan, 1981.
- 5.Dillon PF 31P nuclear magnetic resonance spectroscopy. In: Biochemistry of Smooth Muscle Contraction, edited by Barany M. San Diego, CA: Academic, 1996, p. 393–404.
- 6.Dillon PF, Aksoy MO, Driska SP, Murphy RA. Myosin phosphorylation and the cross-bridge cycle in arterial smooth muscle. Science 211: 495–497, 1981. [DOI] [PubMed] [Google Scholar]
- 7.Dupuis DE, Guilford WH, Wu J, Warshaw DM. Actin filament mechanics in the laser trap. J Muscle Res Cell Motil 18: 17–30, 1997. [DOI] [PubMed] [Google Scholar]
- 8.Ebashi S A simple method of preparing actin-free myosin from smooth muscle. J Biochem 79: 229–231, 1976. [DOI] [PubMed] [Google Scholar]
- 9.Fuglsang A, Khromov A, Torok K, Somlyo AV, Somlyo AP. Flash photolysis studies of relaxation and cross-bridge detachment: higher sensitivity of tonic than phasic smooth muscle to MgADP. J Muscle Res Cell Motil 14: 666–677, 1993. [DOI] [PubMed] [Google Scholar]
- 10.Gollub J, Cremo CR, Cooke R. ADP release produces a rotation of the neck region of smooth myosin but not skeletal myosin. Nat Struct Biol 3: 796–802, 1996. [DOI] [PubMed] [Google Scholar]
- 11.Gollub J, Cremo CR, Cooke R. Phosphorylation regulates the ADP-induced rotation of the light chain domain of smooth muscle myosin. Biochemistry 38: 10107–10118, 1999. [DOI] [PubMed] [Google Scholar]
- 12.Guilford WH, Dupuis DE, Kennedy G, Wu J, Patlak JB, Warshaw DM. Smooth muscle and skeletal muscle myosins produce similar unitary forces and displacements in the laser trap. Biophys J 72: 1006–1021, 1997. [DOI] [PMC free article] [PubMed] [Google Scholar]
- 13.Hai CM, Murphy RA. Regulation of shortening velocity by cross-bridge phosphorylation in smooth muscle. Am J Physiol Cell Physiol 255: C86–C94, 1988. [DOI] [PubMed] [Google Scholar]
- 14.Harris DE, Work SS, Wright RK, Alpert NR, Warshaw DM. Smooth, cardiac and skeletal muscle myosin force and motion generation assessed by cross-bridge mechanical interactions in vitro. J Muscle Res Cell Motil 15: 11–19, 1994. [DOI] [PubMed] [Google Scholar]
- 15.Himpens B, Matthijs G, Somlyo AV, Butler TM, Somlyo AP. Cytoplasmic free calcium, myosin light chain phosphorylation, and force in phasic and tonic smooth muscle. J Gen Physiol 92: 713–729, 1988. [DOI] [PMC free article] [PubMed] [Google Scholar]
- 16.Karagiannis P, Babu GJ, Periasamy M, Brozovich FV. The smooth muscle myosin seven amino acid heavy chain insert's kinetic role in the crossbridge cycle for mouse bladder. J Physiol 547: 463–473, 2003. [DOI] [PMC free article] [PubMed] [Google Scholar]
- 17.Kelley CA, Takahashi M, Yu JH, Adelstein RS. An insert of seven amino acids confers functional differences between smooth muscle myosins from the intestines and vasculature. J Biol Chem 268: 12848–12854, 1993. [PubMed] [Google Scholar]
- 18.Khromov A, Somlyo AV, Trentham DR, Zimmermann B, Somlyo AP. The role of MgADP in force maintenance by dephosphorylated cross-bridges in smooth muscle: a flash photolysis study. Biophys J 69: 2611–2622, 1995. [DOI] [PMC free article] [PubMed] [Google Scholar]
- 19.Khromov AS, Webb MR, Ferenczi MA, Trentham DR, Somlyo AP, Somlyo AV. Myosin regulatory light chain phosphorylation and strain modulate adenosine diphosphate release from smooth muscle Myosin. Biophys J 86: 2318–2328, 2004. [DOI] [PMC free article] [PubMed] [Google Scholar]
- 20.Krisanda JM, Paul RJ. Phosphagen and metabolite content during contraction in porcine carotid artery. Am J Physiol Cell Physiol 244: C385–C390, 1983. [DOI] [PubMed] [Google Scholar]
- 21.Lauzon AM, Tyska MJ, Rovner AS, Freyzon Y, Warshaw DM, Trybus KM. A 7-amino-acid insert in the heavy chain nucleotide binding loop alters the kinetics of smooth muscle myosin in the laser trap. J Muscle Res Cell Motil 19: 825–837, 1998. [DOI] [PubMed] [Google Scholar]
- 22.Lofgren M, Malmqvist U, Arner A. Substrate and product dependence of force and shortening in fast and slow smooth muscle. J Gen Physiol 117: 407–418, 2001. [DOI] [PMC free article] [PubMed] [Google Scholar]
- 23.Malmqvist U, Arner A. Correlation between isoform composition of the 17 kDa myosin light chain and maximal shortening velocity in smooth muscle. Pflugers Arch 418: 523–530, 1991. [DOI] [PubMed] [Google Scholar]
- 24.Megerman J, Lowey S. Polymerization of myosin from smooth muscle of the calf aorta. Biochemistry 20: 2099–2110, 1981. [DOI] [PubMed] [Google Scholar]
- 25.Mehta AD, Finer JT, Spudich JA. Detection of single-molecule interactions using correlated thermal diffusion. Proc Natl Acad Sci USA 94: 7927–7931, 1997. [DOI] [PMC free article] [PubMed] [Google Scholar]
- 26.Pardee JD, Spudich JA. Purification of muscle actin. Methods Enzymol 85: 164–181, 1982. [DOI] [PubMed] [Google Scholar]
- 27.Rovner AS, Freyzon Y, Trybus KM. An insert in the motor domain determines the functional properties of expressed smooth muscle myosin isoforms. J Muscle Res Cell Motil 18: 103–110, 1997. [DOI] [PubMed] [Google Scholar]
- 28.Siegman MJ, Butler TM, Mooers SU. Energetics and regulation of crossbridge states in mammalian smooth muscle. Experientia 41: 1020–1025, 1985. [DOI] [PubMed] [Google Scholar]
- 29.Sobieszek A Ca-linked phosphorylation of a light chain of vertebrate smooth-muscle myosin. Eur J Biochem 73: 477–483, 1977. [DOI] [PubMed] [Google Scholar]
- 30.Somlyo AV, Somlyo AP. Electromechanical and pharmacomechanical coupling in vascular smooth muscle. J Pharmacol Exp Ther 159: 129–145, 1968. [PubMed] [Google Scholar]
- 31.Spudich JA How molecular motors work. Nature 372: 515–518, 1994. [DOI] [PubMed] [Google Scholar]
- 32.Sweeney HL Regulation and tuning of smooth muscle myosin. Am J Respir Crit Care Med 158: S95–99, 1998. [DOI] [PubMed] [Google Scholar]
- 33.Trybus KM Biochemical studies of myosin. Methods 22: 327–335, 2000. [DOI] [PubMed] [Google Scholar]
- 34.Trybus KM Filamentous smooth muscle myosin is regulated by phosphorylation. J Cell Biol 109: 2887–2894, 1989. [DOI] [PMC free article] [PubMed] [Google Scholar]
- 35.Trybus KM, Lowey S. Conformational states of smooth muscle myosin. Effects of light chain phosphorylation and ionic strength. J Biol Chem 259: 8564–8571, 1984. [PubMed] [Google Scholar]
- 36.VanBuren P, Guilford WH, Kennedy G, Wu J, Warshaw DM. Smooth muscle myosin: a high force-generating molecular motor. Biophys J 68: 256S–258S; 258S–259S, 1995. [PMC free article] [PubMed] [Google Scholar]
- 37.VanBuren P, Work SS, Warshaw DM. Enhanced force generation by smooth muscle myosin in vitro. Proc Natl Acad Sci USA 91: 202–205, 1994. [DOI] [PMC free article] [PubMed] [Google Scholar]
- 38.Vyas TB, Mooers SU, Narayan SR, Witherell JC, Siegman MJ, Butler TM. Cooperative activation of myosin by light chain phosphorylation in permeabilized smooth muscle. Am J Physiol Cell Physiol 263: C210–C219, 1992. [DOI] [PubMed] [Google Scholar]
- 39.Warshaw DM, Desrosiers JM, Work SS, Trybus KM. Smooth muscle myosin cross-bridge interactions modulate actin filament sliding velocity in vitro. J Cell Biol 111: 453–463, 1990. [DOI] [PMC free article] [PubMed] [Google Scholar]
- 40.White SL, Zhou MY, Low RB, Periasamy M. Myosin heavy chain isoform expression in rat smooth muscle development. Am J Physiol Cell Physiol 275: C581–C589, 1998. [DOI] [PubMed] [Google Scholar]
- 41.Whittaker M, Wilson-Kubalek EM, Smith JE, Faust L, Milligan RA, Sweeney HL. A 35-A movement of smooth muscle myosin on ADP release. Nature 378: 748–751, 1995. [DOI] [PubMed] [Google Scholar]


