

Abstract
Due to delays in visuomotor processing, eye movements directed toward moving targets must integrate both target position and velocity to be accurate. It is unknown where and how target velocity information is incorporated into the planning of rapid (saccadic) eye movements. We recorded the activity of neurons in frontal eye fields (FEFs) while monkeys made saccades to stationary and moving targets. A substantial fraction of FEF neurons was found to encode not only the initial position of a moving target, but the metrics (amplitude and direction) of the saccade needed to intercept the target. Many neurons also encoded target velocity in a nearly linear manner. The quasi-linear dependence of firing rate on target velocity means that the neuronal response can be directly read out to compute the future position of a target moving with constant velocity. This is demonstrated using a quantitative model in which saccade amplitude is encoded in the population response of neurons tuned to retinal target position and modulated by target velocity.
INTRODUCTION
In a world filled with moving objects, the ability to anticipate where things are headed is crucial for survival. Due to delays in sensory-motor pathways, the position of a moving object as represented in the brain could lag behind the object's true position (Schlag and Schlag-Rey 2002). The discrepancy between an object's true location and its neural representation might cause visually guided reaching and eye movements to be inaccurate. However, since real objects tend to move in a predictable manner, the brain can compensate for object motion by incorporating an estimate of target velocity (speed and direction) when planning movements or constructing an internal representation of the target. Rapid eye movements (saccades) are programmed based on a “position error” that represents the difference between the current and desired eye position. There is evidence that this error signal is sampled about 70 to 80 ms before onset of the saccade (Becker and Jurgens 1979). Because of this delay, saccades based on position error alone should always undershoot a moving target. The size of the undershoot would exceed the radius of the fovea for targets moving at very modest speeds (<10°/s). However, monkeys and humans can make accurate saccades to moving targets, suggesting that they compensate for target velocity during saccade planning (de Brouwer et al. 2001, 2002a,b; Eggert et al. 2005; Guan et al. 2005; Heywood and Churcher 1979; Keller and Steen Johnsen 1990; Ron et al. 1989a,b). One possible explanation for this accuracy is that saccades to moving targets are produced by a system that combines a past measure of the position error with an additional correction based on target velocity (Robinson 1973).
Little is currently known about the neural substrate for saccade target velocity compensation in primates. Patients with neurological disorders such as schizophrenia have an impaired ability to estimate motion (Hooker and Park 2000), suggesting a possible link to frontal lobe function. There is evidence that the accuracy of saccades to moving targets is compromised by lesions to primary visual cortex (V1) and to the middle temporal (MT) motion area, whereas saccades to stationary targets are not affected (Newsome et al. 1985; Segraves et al. 1987). It has been shown that neurons in the deep layers of the superior colliculus (SC) encode the instantaneous position of a moving target but not the saccade needed to intercept the target (Keller et al. 1996). These findings provide support for the hypothesis that saccades made to moving targets are controlled by at least two partially separate pathways, one of which is concerned strictly with correction of a presaccadic retinal position error and another that extrapolates future position based on the velocity of the moving target. The former pathway includes the SC whereas the latter does not. In this report we attempt to answer the question of whether the frontal eye field (FEF) belongs to either or both pathways.
The FEF receives robust input from the MT and middle superior temporal motion processing areas (Schall et al. 1995), contains neurons that are selective for motion speed and direction (Xiao et al. 2006), and sends output to the caudate nucleus, SC, and pons (Stanton et al. 1988), making it a good candidate for providing target velocity signals to the saccade system. We obtained data from 96 neurons in the FEF while monkeys made saccades to stationary or moving targets. We found evidence that FEF neurons code not only the instantaneous position of a moving target, but also the metrics of the saccade required to intercept the target. FEF neurons are also modulated by target speed even when target position and saccade metrics are held constant. Thus the three variables involved in target velocity compensation (target position, target velocity, and saccade metric) are available in FEF, providing evidence that this structure may be involved in extrapolating target motion when planning saccades.
METHODS
Experiments were performed on four subadult male rhesus monkeys (Macaca mulatta) weighing between 5 and 8 kg. All methods were approved by the Institutional Animal Care and Use Committee at Columbia University and the New York State Psychiatric Institute. Monkeys were prepared for experiments by surgical implantation of a post used for head restraint and a recording chamber to give access to the cortex. Eye position was recorded using a monocular scleral search coil. All surgical procedures were performed using aseptic technique and general (isoflurane 1–3%) anesthesia. Monkeys were trained to sit in a primate chair for the duration of the experiment with their heads restrained and to perform the saccade tasks. Correct performance of the task was reinforced by liquid reward.
Visual stimulation
Visual stimuli were generated and controlled by a Cambridge Research Systems VSG2/3F video frame buffer. The output from the video board was displayed on a calibrated 37-in. color monitor (Mitsubishi) with a 60-Hz noninterlaced refresh rate. The monitor stood at a viewing distance of 24 in. so that the display area subtended roughly 40° horizontally × 30° vertically. The spatial resolution of the display was 1,280 pixels × 1,024 lines. Fixation targets were small (0.5°) yellow squares presented on a uniform black background. The luminance of the fixation target was 65.0 cd/m2, whereas the background was close to 0 cd/m2 (below the photometer threshold). The frame buffer was programmed to send out digital pulses (frame sync) for timing purposes at the beginning of each video frame in which a target was turned on or off. These pulses were recorded by the computer, using a hardware timer, and stored together with the neuronal and eye movement data.
Neuronal recording and electrical stimulation
Recording chambers (20-mm diameter) were implanted on the skull overlying the arcuate sulcus, positioned at stereotaxic coordinates 25A, 15L. At the start of each recording session, a hydraulic microdrive was mounted on the recording chamber. Recordings were made using platinum–iridium electrodes with impedances of 0.1–1 MΩ. Signals from the microelectrode were amplified, filtered, and monitored on an oscilloscope and audio monitor. A time–amplitude window discriminator converted extracellular action potentials into digital pulses (TTL), which were sampled by the computer with 0.01-ms time resolution. Units were isolated on the basis of waveform. When a unit was isolated, stimulus parameters such as position and size were adjusted to optimize its response. Neuronal spike trains were collected and stored along with eye position and velocity records.
Electrical microstimulation was used to map the region of cortex from which neuronal recordings were obtained in each monkey. Sites in periarcuate cortex were stimulated through the same electrode used to record neuronal activity. The stimulation consisted of a train of 0.2-ms biphasic pulses at a rate of 350 pulses/s delivered by an optically isolated pulse stimulator (AM Systems). The output of the stimulator was gated by a computer-generated TTL level so as to be synchronized with other trial events. The current threshold for evoking saccades was determined by stimulating during a fixation task (Opris et al. 2001). The threshold was defined as the current level at which involuntary saccades were evoked on about half the stimulation trials (Bruce et al. 1985). Recording and stimulation sites were classified on stimulation threshold as being within the low-threshold FEF if the threshold was <85 μA (range: 10–85 μA; mean: 43 μA). This classification uses a higher-threshold criterion than others have used (Bruce et al. 1985). However, we feel this is warranted because thresholds were measured during a fixation task that results in higher thresholds as compared with stimulation free gaze (Goldberg et al. 1986).
For all sites, electrically evoked saccades were almost always contraversive and showed a mediolateral gradation of amplitudes (Bruce and Goldberg 1985). In addition, the evoked saccade direction rotated systematically as the depth of the electrode changed. These features of the saccade amplitude and direction map are characteristic of the FEF.
Eye-movement recording
Eye position was monitored using a monocular scleral search coil system (CNC Engineering). The eye-position signals were then digitally sampled by computer at 1 kHz per channel, digitized with 12-bit resolution, and stored on a disk for off-line analysis. Velocity was computed from eye-position information using a differentiator filter algorithm. Eye position and velocity were used to estimate saccade parameters. Polar eye velocity (rvel) was constructed combining the magnitudes of the horizontal (hvel) and vertical (vvel) eye velocities. Polar eye velocity was digitally differentiated to yield polar acceleration (racc). Saccade onset was computed using an acceleration criterion (racc ≥500°/s2). Saccade offset was found using the complementary criterion (racc ≤500°/s2). This criterion was not always appropriate for small saccades; thus each trial was also checked by visual inspection.
Behavioral paradigms
Monkeys were trained to perform various oculomotor tasks during neuronal recording. Once a neuron was isolated, a memory-guided saccade task (MEM) was used first to find the preferred direction of the cell. In the MEM task, monkeys made saccades to the remembered location of a visual cue. The cue location varied among eight positions, equally spaced (45°) around the clock. At the beginning of each trial the monkey fixated a small red square. A peripheral cue was flashed for 250 ms followed by a variable delay (750–1,250 ms) during which the fixation target remained on and the monkey maintained fixation within a 2 × 2° window. At the end of the delay, the fixation target disappeared and the monkey was allowed ≤600 ms to make a saccade to the remembered location of the cue. After the 600-ms saccade interval, and if the monkey's memory-guided saccade was within a 3 × 3° window centered on the cue location, the cue reappeared to provide feedback to the monkey and corrective saccades were generally made at this time. Before commencing data collection, the eccentricity of the peripheral cue was varied to find the optimum eccentricity for each neuron. Data were then recorded with a fixed eccentricity. For analysis each MEM trial was divided into seven time intervals including visual, presaccadic, and perisaccadic intervals. More details on this task have been given elsewhere (Cassanello and Ferrera 2007b).
After collecting data for the memory-guided saccade task, we switched to the tracking task. In this task, the subject was required to make saccades to stationary or moving targets. The following describes the standard task geometry, which could be scaled and rotated to match the receptive field (RF) size and eccentricity of individual neurons. The initial target positions were arranged collinearly (“on-axis”; Fig. 1, A and C) or perpendicular (“off-axis”; Fig. 1, B and D) to the neuron's preferred direction (Fig. 1 shows only a subset of target positions, to avoid clutter). The on-axis targets were located in the receptive/movement field of the cell at eight different distances (3, 6, 9, 10, 12, 15, 18, or 21°) from the fixation point, which was presented at the center of the display (Fig. 1A). The target either remained stationary or moved toward or away from the center of the display at 10 or 30°/s. The off-axis trials (Fig. 1B) consisted of saccades to targets with initial positions along a line perpendicular to the preferred direction of the neuron. There were ≤11 off-axis target positions and the spacing between the targets was 3°. The eccentricity of the off-axis target nearest to the fixation point was 10°. Off-axis targets were stationary or moved with two speeds (10 and 30°/s) in two directions (along an orientation perpendicular to the cell's preferred direction).
FIG. 1.

Tracking task used to measure responses to stationary and moving targets. A: initial target positions for on-axis trials (black diamonds) relative to the receptive/movement field (gray patch). On any given trial, there was only one target. The line along which the targets were positioned varied depending on the receptive field (RF) of the neuron being recorded. B: initial target positions for off-axis trials. Same format as A. C: sequence of events for on-axis trials. Black squares represent fixation or saccade targets. Dashed circles represents desired eye position. Gray arrow represents target motion. Black arrow represents eye movements. D: sequence of events for off-axis trials. Same conventions as C.
Data analysis
The tracking task had 62 different stimulus conditions consisting of different combinations of initial target position, speed, and direction. All stimulus conditions were presented interleaved randomly within each block.
We used regression analysis to assess the validity of the previously reported relation between saccade amplitude, position error, and target velocity (Keller and Steen Johnsen 1990), expressed as
 |
(1) |
where SA is saccade amplitude, PE is position error, and TV is target velocity.1 One way to think about this regression analysis is that it provides estimates of the weights given to PE and TV in saccade planning. Ideally, the initial position error would be fully incorporated into the saccade plan (β1 = 1.0), and the target velocity would be weighted according to the time elapsed between the sampling of PE and the onset of the saccade because elapsed time multiplied by target velocity yields the required compensation in degrees. Thus β2 should be about 0.1 if position error is sampled 100 ms prior to saccade onset (β2, has dimensions of seconds, whereas β1 is dimensionless). All of the variables in Eq. 1 are time dependent, where time is measured relative to saccade onset. In the results, we explore the effects of using different time points on the parameter estimates.
To accommodate off-axis target motion, Eq. 1 can be expanded to two dimensions by treating the horizontal (x) and vertical (y) components of each variable independently
 |
(2a) |
 |
(2b) |
This allows one to perform the analysis described in the preceding paragraph for any target motion, not just radial motion (i.e., target motions lying along a line extending outward from the center of gaze).
For analysis of neural activity, each trial of the static target saccade task and step-ramp saccade task was divided into seven time epochs: 1) fixation interval: 100 ms before the saccade target onset; 2) visual interval: first 100 ms after the onset of the saccade target and prior to any saccade; 3) presaccadic interval: 100 ms prior to the onset of the first saccade; 4) perisaccadic interval: 100-ms window centered on saccade onset; 5) postsaccadic interval: 100 ms after the onset of the saccade; 6) from target onset to saccade onset: variable length; 7) from target onset to 100 ms after saccade onset: variable length. The average firing rate was computed within each time window. The number of repetitions of each trial condition was typically 5 to 10, with some units recorded over 15 complete blocks.
The pre- and perisaccadic trial epoch measure neural activity starting 100 or 50 ms, respectively, before saccade onset. If visual input for saccade planning is sampled 100 ms before the saccade, then one might have expected the time windows for neural data analysis to bracket that time point (e.g., 150 to 50 ms prior to saccade onset). However, behavioral estimates of when input is sampled for saccade planning refer to when the input is available at the retina. FEF neurons have visual latencies of about 50 ms, and thus it is appropriate to shift the time window for analyzing FEF responses by about that amount. On the other hand, movement-related activity in FEF can appear as high-frequency bursts that start about 50 ms prior to saccade onset and continue through saccade initiation. Furthermore, latencies for electrically evoked saccades in the FEF are in the range of 30–40 ms. These considerations justify looking at FEF activity 50 ms prior to saccade onset.
We selected neurons based on two criteria. First, for each cell we first performed a test to determine whether the response after target onset was significantly modulated relative to activity in the fixation interval. This was accomplished by performing a two-sided t-test on the difference between the mean firing rate of the visual, presaccadic, and perisaccadic intervals and the background/fixation interval. This allowed us to reject the null hypothesis that the neuronal response was unmodulated either by the presence of visual stimulation or by the movement of the eyes. Another exclusion criterion was based on too few trial repetitions. Only data sets with more than three repetitions per stimulus condition were used. These criteria left 96 neurons for further analysis out of 124 total cells that were recorded.
To examine the neuronal responses during saccades to stationary and moving targets we plotted the firing rate (FR) as a function of target velocity (TV); saccade amplitude (SA), defined as the distance between the position of the eye at the end of the saccade minus the position of the eye at saccade onset; and the position error (PE), defined as the difference between the position of the target and the position of the eye 100 ms before the saccade onset. For each trial condition we computed mean firing rate and SE within the previously defined trial epochs.
If a neuron encodes position error, then when its firing rate is plotted as a function of PE, the responses to moving targets should overlay the responses to stationary targets. Likewise, if a cell encodes saccade amplitude, then the firing rate versus SA plots should overlap for stationary and moving targets. To test this, we plotted FR as a function of PE or SA for stationary targets and then interpolated the data to get a smooth curve. We used these FR versus PE and FR versus SA functions to predict the response to moving targets. For each moving target trial, we computed the position error and firing rate [FRM(pe)], and then looked up the firing rate for the same position error when the target was stationary [FRS(pe)]. We then computed the correlation between FRM(pe) and FRS(pe). We used the same procedure to determine how much of the variance in firing rate was accounted for by SA. Based on significance of the correlation coefficient, we classified cells as being tuned for PE or SA. A similar method was used to analyze spatial frames of reference for parietal neurons (Mullette-Gillman et al. 2005).
To assess the effect of TV, we plotted recorded FRs (mean values and SE) versus the difference between SA and PE. In addition we plotted and evaluated the behavioral correlation between the difference between SA and PE and the TV. This last procedure follows closely the analysis performed by Keller and Steen Johnsen (1990). We then related physiological data to saccade metrics by fitting piecewise linear functions to the plots of FR versus SA − PE as well as to the plots of FR versus TV.
To test for significant modulation of TV on the firing rates during the on-axis trials, we ran five one-way ANOVAs with firing rate as the dependent variable and TV, SA, SD, PE, or DE as the explanatory variable. One set consisted of all on-axis trials, including both saccades to static and moving targets. The ANOVA was done on the firing rates of each trial epoch.
Running ANOVA over the firing rates using SA/SD or PE/DE as independent variables across all trial conditions (with saccades to static and moving targets) was not possible due to the random variability in SA and PE. To overcome this we binned the values of SA/SD and PE/DE across all trials. Then we performed two-way ANOVAs, grouping the trials according to target speed and PE/DE or target speed and SA/SD.
The activity of FEF neurons can be classified as visual, visual-movement, or movement-related based on whether it is more strongly associated with a visual stimulus or with a saccadic eye movement (Bruce and Goldberg 1985). We used a visuomotor index to classify neurons as follows
 |
(3) |
where V is the average firing rate 100 ms after the appearance of the visual stimulus and M is the average firing rate 100 ms before the saccade onset. This index ranges from −1.0 (pure movement cell) to 1.0 (pure visual cell). This analysis was performed using data from the tracking and memory saccade tasks. In each case, the firing rates were calculated using the trial condition that produced the maximum overall response, i.e., the preferred target location or saccade metric (direction and amplitude).
RESULTS
Saccades to moving targets
We trained four macaque monkeys to perform saccades to stationary and moving targets as explained in Behavioral paradigms (Fig. 1, A–D). If the saccade accurately compensates for target motion, then saccade amplitude should include a predictive component that is proportional to target velocity (TV). By examining saccades to stationary and moving targets, we were able to dissociate saccade amplitude (SA) from position error (PE) sampled 100 ms prior to saccade onset (Fig. 2A). We used regression analysis to assess the validity of the previously reported relation between saccade amplitude, position error, and target velocity (Keller and Steen Johnsen 1990; Eq. 1) for the four monkeys used in our study. This analysis used data from 69 neuronal recording sessions (60 of which resulted in the population of 96 neurons analyzed in the following text). Position error measured 100 ms prior to saccade onset is plotted versus saccade amplitude for five different target velocities (−30, −10, 0, 10, 30°/s) in Fig. 2B for monkey F. The results confirm a nearly perfect linear relationship. The coefficients of Eq. 1 derived from this analysis are given in Table 1 (rows with “PE Time” of 100 ms). The fitted lines have β1 near to but generally <1.0, and β2 > 0.1; this indicates that the saccade plan tends to undercompensate position error and overcompensate target velocity.
FIG. 2.
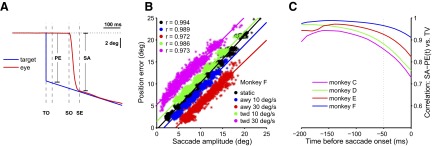
Metrics of saccades to moving and stationary targets for one monkey. A: example of a step-ramp on-axis trial with purely horizontal target motion. Target horizontal position is shown in blue. Horizontal eye position is in red. Position error (PE) and saccade amplitude (SA) are indicated as well as the times of target onset (TO), saccade onset (SO), and saccade end (SE). PE in this case is taken as the difference between target and eye position 100 ms before SO. B: scatterplot of PE vs. SA for all on-axis trials (n = 7,909) recorded from monkey F. Target velocity (TV) is color coded as indicated in the figure. The correlation coefficients (r) for each TV are shown in the top left inset. C: correlation between SA − PE(t) and TV with PE sampled at different times before SO (t = 0).
TABLE 1.
Results from multiregression analysis on the on-axis saccades of the four monkeys tested
| Animal | PE Time, ms | n | α | β1 | β2 | r2 |
|---|---|---|---|---|---|---|
| C | 0 | 2,260 | 0.4156 | 0.9051 | 0.0722 | 0.8810 |
| 20 | 2,260 | 0.3567 | 0.9042 | 0.0879 | 0.8803 | |
| 40 | 2,260 | 0.3403 | 0.9043 | 0.1038 | 0.8797 | |
| 100 | 2,260 | 0.2940 | 0.9034 | 0.1536 | 0.8729 | |
| D | 0 | 1,750 | −0.1822 | 1.0326 | 0.0552 | 0.9592 |
| 20 | 1,750 | −0.3675 | 1.0364 | 0.0672 | 0.9584 | |
| 40 | 1,750 | −0.4298 | 1.0372 | 0.0824 | 0.9578 | |
| 100 | 1,750 | −0.4953 | 1.0377 | 0.1402 | 0.9546 | |
| E | 0 | 2,763 | 0.5110 | 0.9091 | 0.0604 | 0.9383 |
| 20 | 2,763 | 0.4113 | 0.9102 | 0.0763 | 0.9383 | |
| 40 | 2,763 | 0.4053 | 0.9098 | 0.0931 | 0.9383 | |
| 100 | 2,763 | 0.4250 | 0.9074 | 1.0462 | 0.9380 | |
| F | 0 | 7,909 | 0.2872 | 0.9484 | 0.0661 | 0.9753 |
| 20 | 7,909 | 0.2572 | 0.9464 | 0.0821 | 0.9754 | |
| 40 | 7,909 | 0.2722 | 0.9445 | 0.0993 | 0.9757 | |
| 100 | 7,909 | 0.2996 | 0.9418 | 0.1550 | 0.9752 |
The regression includes static and step-ramp saccades. Behavioral data from 69 recording sessions were included in this analysis, including 9 sessions from which no neuronal data were kept for analysis. All directions were included, not just horizontal saccades. For each monkey the four rows show the regression coefficients obtained with four different values of PE taken at 0, 20, 40, and 100 ms, respectively, before the saccade onset.
The question naturally arises as to why the regression analysis was done with position error sampled at a particular time (100 ms) prior to saccade onset. To determine the sensitivity of the analysis to this time point, we repeated the analysis using position errors sampled at 100, 80, 60, 40, 20, and 0 ms before the onset of the saccade. For all six time points, the regression showed a clear linear dependence between saccade amplitude and both position error and target velocity with high correlation coefficients (Table 1 shows regression parameters for 100, 40, 20, and 0 ms). We did not observe a large variation in the correlation coefficient when using a position error taken closer to the saccade onset. In all animals r2 was >0.93 with the exception of monkey C. The coefficient of the target velocity term (β2) changes in a manner consistent with a linear dependence on the time to the saccade onset (i.e., it gets smaller as the time at which position error is sampled gets closer to saccade onset). This is expected because the difference between position error and saccade amplitude becomes smaller and thus less velocity compensation is required. These results are consistent with previous studies (Keller and Steen Johnsen 1990). The only difference is that our β2 coefficients are somewhat larger, although this could be a consequence of our including saccades in all directions. However, our analysis further shows that there is nothing special about 100 ms as the time at which position error is sampled. It suggests that rather than sampling position error at a particular time and compensating for target motion at that instant, the brain may actually sample position error continuously to compute the necessary velocity compensation at any given moment. This would allow the oculomotor system some flexibility in deciding when to initiate the movement without sacrificing accuracy.
To examine more closely how target velocity is used in saccade programming, we looked at the relationship between the difference (or residual), SA − PE, and TV. This residual can be thought of as the extra amount of saccade amplitude or direction that is due to target velocity. The regression analysis shown in Fig. 2B is largely determined by the dependence of saccade amplitude on position error. The residual, SA − PE, largely removes the effect of position error and therefore provides a more robust estimate of the effect of target velocity on saccade metrics. Equation 1 suggests that the relationship between the residual and target velocity should also be linear and, in fact, a linear function accounted for ≥80% of the variance for all four monkeys when PE was sampled 100 ms before saccade onset. Again, to determine whether this result was sensitive to the particular time at which position error was sampled, we iterated the analysis for time points ranging from 0 to 200 ms before saccade onset, sampling position error every 10 ms. The correlation of SA − PE(t) versus TV is shown in Fig. 2C as a function of t (time before saccade). The influence of target velocity on SA − PE decreased substantially with time before saccade onset, but there was still a significant correlation within a few milliseconds before saccade onset. This again suggests that PE and TV are not sampled at a discrete point in time, but are continuously integrated into an updated estimate of saccade amplitude. This result helps to justify, the use of measures of neural activity in different time intervals between target onset and saccade onset, some of which may include activity only 50 ms prior to the saccade.
Equation 1 can be generalized to two dimensions by replacing SA, PE, and TV with two-dimensional vectors representing the x and y components of saccade displacement, position error, and target velocity, respectively (see methods; Eqs. 2a and 2b). Then the preceding analysis can be done for off-axis target motions as well as on-axis. Specifically, linear functions can be fit independently to the x and y components of each variable. This analysis was done for trials with off-axis target motion and the results turned out to be nearly indistinguishable from those for on-axis target motion shown in Fig. 2C.
Neuronal responses in FEF
We recorded 124 cells in the frontal eye fields of four monkeys. Of these cells, 96 (19 from monkey C, 16 from monkey D, 27 from monkey E, and 34 from monkey F) were retained for further analysis based on criteria described in methods. The above-cited behavioral results confirm that target motion dissociates saccade amplitude from position error by an amount proportional to target velocity. The following analyses explore 1) the statistical significance of the effect of target velocity, retinal error (target position and direction), and saccade metrics (amplitude and direction) on firing rate; 2) neuronal sensitivity to retinal error and saccade metrics; 3) neuronal sensitivity to target velocity; and 4) the relationship between target velocity sensitivity and visual-movement index.
Statistical significance of target velocity, retinal error, and saccade metrics on firing rate
ANOVAs were run to determine the explanatory power of target velocity (TV), saccade amplitude/direction (SA/SD), and position/direction error (PE/DE) on firing rates in different trial epochs (fixation, visual, presaccadic, and perisaccadic) across all neurons sampled. Each explanatory variable was first considered individually (Table 2). As expected, ANOVA found few neurons with significant modulation of firing rate by any explanatory variable in the fixation interval. There is a progressive increase in the number of cells showing significant effects in the visual, presaccadic, and perisaccadic trial epochs, suggesting that neural signals related to TV, PE, DE, SA, and SD evolved over time from the onset of the target through the execution of the movement. However, the number of significant cells was comparable across all five explanatory variables. These trends were similar for both the P < 0.05 and P < 0.01 significance levels. In general, the numbers of cells with significant effects range from 2- to 60-fold the numbers that would be expected by chance.
TABLE 2.
Results of one-way ANOVA with explanatory variables TV, SA, PE, SD, and DE on all trials (on-axis and off-axis targets)
| Explanatory Variable | Fixation | Visual | Presaccade | Perisaccade |
|---|---|---|---|---|
| Target velocity | 3 (0) | 16 (11) | 52 (38) | 67 (61) |
| Position error | 8 (1) | 22 (15) | 34 (27) | 44 (36) |
| Direction error | 5 (1) | 30 (23) | 54 (44) | 56 (45) |
| Saccade amplitude | 5 (2) | 11 (5) | 40 (35) | 40 (26) |
| Saccade direction | 4 (0) | 25 (13) | 53 (43) | 58 (46) |
Number of cells with significant effect at P < 0.05 or P < 0.01 (in parentheses). Total neurons, n = 96.
Two- and three-way ANOVAs were also run using combinations of the explanatory variables. All of these analyses produced results in qualitative agreement with the one-way ANOVAs. The explanatory power of TV, SA/SD, and PE/DE increased across the visual, presaccadic, and perisaccadic trial epochs, but there were no clear differences between these variables. This is what one would expect if neuronal activity in FEF were coupled to target velocity compensation because, behaviorally, TV, PE/DE, and SA/SD are linearly related, as shown in Fig. 2. Therefore neural circuitry that is involved in computing SA/SD based on PE/DE and TV should be correlated with all of these variables. This appears to be the case for FEF.
Effects of retinal error and saccade metrics on firing rate
Figure 3 shows examples of two individual cells with average firing rate plotted against position error (PE, Fig. 3, A and C) or saccade amplitude (SA, Fig. 3, B and D). Firing rate was computed during the perisaccadic time interval, which includes the 50 ms just before saccade onset. In Fig. 3A, activity prior to saccades to moving targets (colored symbols) is similar to activity when saccades are made to stationary targets (black symbols) when activity is plotted as a function of position error. However, the peak response of the neuron shifted systematically when plotted as a function of saccade amplitude (Fig. 3B). Figure 3, C and D shows the activity of a different cell whose activity was more consistent when described in terms of saccade amplitude (Fig. 3D) than position error (Fig. 3C). The cell in Fig. 3, A and B could be described as encoding position error better than saccade amplitude in the sense that there was generally less variability in firing rate for a given value of position error than for a given value of saccade amplitude. The activity of the cell in Fig. 3, C and D was better described by saccade amplitude as the explanatory variable.
FIG. 3.

Example neuronal responses as a function of PE and SA. A: average firing rate (FR) around the time of the saccade as a function of PE measured 100 ms before SO. Only data for on-axis trials are shown. Black symbols represent responses to stationary targets. Colored symbols represent targets moving with different speeds either toward or away from the initial fixation position according to the legend. Solid lines represent smooth functions fit to the data (curves may have a range different from that of symbols because the symbols represent averages grouped according to trial type, whereas the curves are constructed without grouping). Correlation coefficients (r) and attendant p values are shown for the correlation between responses to stationary and moving targets. B: same neuron and time interval as A, but plotted as a function of PE. C: data for a second neuron recorded during on-axis trials plotted as a function of PE. D: same data as C plotted as a function of SA.
Although position/direction error and saccade amplitude/direction are correlated, it is clear that for some cells, one accounts for more variability in firing rate than the other. There are many ways one might quantify this. We chose to use a metric for which the response to stationary targets was used to predict the response to moving targets. To do this, we first had to fit smooth functions to the data for stationary targets. These functions are shown as the solid black lines in Fig. 3. These smooth curves constitute the predicted firing rate, whereas the responses to moving targets on a trial-by-trial basis (not the averages plotted in Fig. 3) constitute the observed firing rates. We then computed a simple correlation between the observed and predicted rates. The results are shown as correlation coefficients (r) and their attendant significance levels (p) in each panel of Fig. 3. For the cell in Fig. 3, A and B, the correlation was more robust (larger r, smaller p) for position error than for saccade amplitude. The cell in Fig. 3, C and D shows the complementary result.
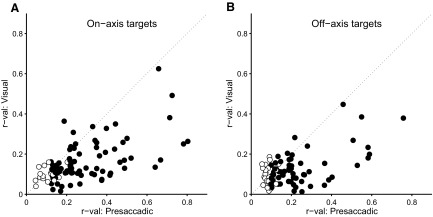
This analysis was carried out across the population of neurons and for three distinct (but overlapping) 100-ms time windows starting at 1) target onset (visual), 2) 100 ms before saccade onset (presaccadic), or 3) 50 ms before saccade onset (perisaccadic). Across the time intervals (Fig. 4), the number of cells that were significantly correlated with either SA/SD or PE/DE nearly doubled, indicating that tuning for both parameters improved during the span between target onset and saccade. During the visual interval, hardly any cells with significant tuning (filled circles in Fig. 4, A and D) showed a stronger correlation with SA/SD than with PE/DE, suggesting that the cells were mainly driven by target position. However, in the pre- and perisaccadic intervals, there emerged cells whose tuning was better correlated with SA/SD. This is consistent with the idea that SA/SD-tuned cells encode a predictive component derived by extrapolating target velocity, which presumably requires some time to compute.
FIG. 4.

Correlation coefficients as computed in Fig. 3 across the population of neurons. A: correlation for PE vs. correlation for SA for on-axis trials and activity recorded during the first 100 ms after TO. Text in the top left corner indicates total number of cells (n), number with significant correlation (P < 0.05) for either PE or SA (filled symbols), and number for which the correlation with PE was greater than that with SA. Open symbols are cells for which neither correlation was significant. B: same as A, but for activity 100 ms prior to SO. C: same as A, but for activity 50 ms before to 50 ms after SO. D, E, and F: same as A, B, and C, but for off-axis trials.
Across all trial epochs, the proportion of cells that were significantly correlated with either SA/SD or PE/DE varied from about one quarter to one half of the population. The total population of cells is the same for all epochs. Thus some cells that had no significant correlations during the visual epoch became significantly correlated during the pre- and perisaccadic epochs. However, the significant correlations are modest, mostly in the range r = [0.2–0.4]. Part of this is due to presumably random trial-to-trial variability in firing and the fact that the time window for averaging was only 100 ms. However, part of the variability could be due to the fact that FEF neurons are sensitive not only to target position and saccade metrics, but also to target velocity (direction and speed). This will be explored next.
Modulation of responses by target velocity
Do FEF neurons represent only target position and saccade metrics? If so, they might be considered as simply visual or movement neurons, leaving unclear the issue of whether FEF encodes a predictive saccade component derived by extrapolating target velocity. Evidence that FEF neurons are modulated by target velocity would help support the notion that FEF is involved in the computations underlying target velocity compensation as opposed to representing the inputs and outputs of that computation. The ANOVA results reported earlier provide some evidence that FEF activity is modulated by target velocity when target position and saccade metrics are included as explanatory variables. However, added support could be provided by showing that FEF activity is modulated by target velocity when retinal error and saccade metrics are constant. Figure 5, A and B shows the presaccadic activity of an example FEF neuron as a function of position error (Fig. 5A) or saccade amplitude (Fig. 5B) for off-axis trials. Notice that the curves for different target speeds do not superimpose when plotted either as a function of PE or SA. There is clear modulation of firing rate even when PE and SA are constant across different target velocities. For example, when saccade amplitude is 10°, the response to a target moving at 30°/s is about fourfold stronger than the response to −30°/s.
FIG. 5.

Modulation of presaccadic activity by TV. A: activity as a function of PE for 5 TVs (see legend). B: activity as a function of SA for 5 TVs. C: response to best speed vs. worst speed for on-axis trials for all cells. For each cell, responses were limited to trials with the same range of SAs (circles) or PEs (squares) for both speeds. Filled symbols (black or gray) represent cells with a statistically significant difference between responses to preferred and null speeds (unpaired t-test, P < 0.05). Dashed line is x = y. D: same format as C for off-axis trials. Each data point represents the response to preferred and nonpreferred TVs using only trials with overlapping SD (circles) or DE (squares). Filled symbols represents cells with significantly different responses to the preferred and nonpreferred TVs.
To quantify the effect of target velocity across the population, we found the preferred and nonpreferred speeds for each cell—i.e., the speeds that produced the highest and lowest mean response during the presaccadic interval, averaged across all other conditions. Then, for those two velocities, we selected only trials with overlapping saccade amplitudes (i.e., the range of saccade amplitudes common to both velocities). We then recomputed the mean response to the preferred and nonpreferred target velocities using only the trials with overlapping saccade amplitudes. The results are shown in Fig. 5C (circles). The filled circles represent cells for which the preferred − nonpreferred difference was statistically significant (unpaired t-test, P < 0.05; n = 35 cells, 36% of the population). The analysis was repeated, substituting position error for saccade amplitude (Fig. 5C, squares), and also for off-axis trials (Fig. 5D) with saccade direction (circles) and direction error (squares). In each case, ≥36% of the cells show a significant effect of target velocity for trials with overlapping target position or saccade metrics.
Target velocity is linearly related to the compensatory or “predictive” component of the saccade. The relationship described by Eq. 1 can be rearranged to express the difference between saccade amplitude and position error as a function of target velocity [SA − PE = a + b × TV, or the equivalent for SD and DE]. The difference, SA − PE or SD − DE, can be referred to as “the residual.” The residual is plotted for two recording sessions in Fig. 6, A and D. The relationship is highly linear. It is likewise possible to plot the firing rate of the neuron during the presaccadic time interval as a function of the residual. When this is done, a clear relationship is seen (Fig. 6, B and E). Each group of colored symbols in Fig. 6 represents a different target velocity. Thus the relationship seen in Fig. 6, B and E is due to the neurons' sensitivity to target velocity. This is confirmed by plotting firing rate versus target velocity in Fig. 6, C and F.
FIG. 6.
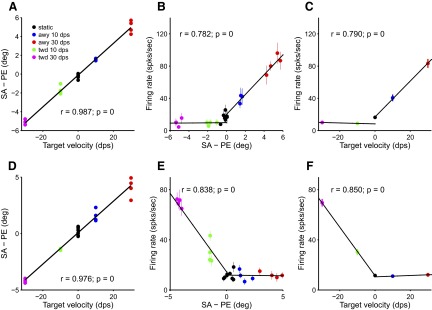
Two example recordings showing dependence of saccade metrics and FR on TV. A: residual (SA − PE) vs. TV. Text gives correlation coefficient (r) and p value (p). B: dependence of FR on residual (SA − PE). Data were fit with a piecewise linear function. Text shows correlation (r, p) between the piecewise linear fit and the data. C: FR vs. TV. Same conventions as B. D, E, and F: same as A, B, and C but for a second neuron/recording session.
The scatter in the data within each speed group in Fig. 6, B and E is due to variability in target position (i.e., each speed group includes a range of initial target positions). Target velocity is reliably encoded despite this variation. The encoding is not linear over the entire range of residuals, but it is nearly linear for each half of the residual axis. The finding that individual cells changed their firing more for positive than for negative target velocity (or vice versa) suggests that the cells were direction selective. Previous work from our lab using patches of moving random dots found that about half the neurons in FEF were significantly modulated by direction of motion (Xiao et al. 2006). However, in the current study, direction selectivity is somewhat conflated with target position because the targets changed position as they moved, and therefore the current data are not proof of direction selectivity. However, some degree of directionality likely contributes to the asymmetry in response to the different target directions.
As an estimate of velocity sensitivity, we fit the data (firing rate vs. target velocity) for each cell with a piecewise linear function and calculated the correlation between the fits and the data (as shown in Fig. 6, C and F). This was done separately for both the visual and presaccadic time intervals. The results are shown in Fig. 7. Sensitivity to target velocity was much stronger in the presaccadic interval than that in the visual interval for both on- and off-axis trials.
FIG. 7.
Correlation between FR and residual (SA − PE or SD–DE). PE and DE were sampled at 100 ms before onset of the saccade. A: correlation coefficients as computed in Fig. 6 for visual vs. presaccadic FR. Filled symbols indicate that either correlation coefficient was significant (P < 0.05). B: same as A but for off-axis trials.
Relationship between target-velocity sensitivity and visual-movement index
FEF neurons can be indexed according to whether their response is more closely tied to the visual stimulus or to the oculomotor response. This classification is believed to reflect the flow of information through FEF. It is therefore of interest to investigate whether a measure of target velocity compensation correlates with the classification of cells as “visual,” “visual-movement,” or “movement-related.” We used Eq. 3 (methods) to calculate a visuomovement index (VMI) for each neuron. This index has a value of −1.0 for pure movements cells and 1.0 for purely visual cells. For the population of neurons in this study, the mean VMI was −0.26, indicating that, for most cells, presaccadic firing rates were higher than firing rates during the visual trial epoch. The raw firing rates for the visual and presaccadic intervals are shown in Fig. 8A and it is apparent that nearly every cell was more active during the later trial epoch.
FIG. 8.
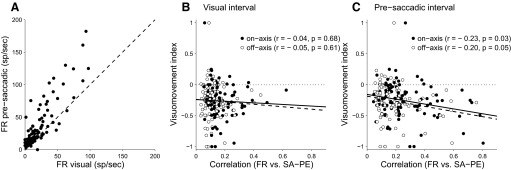
Visuomovement index and TV compensation. A: FR during visual vs. presaccadic trial epoch. These are the rates that were used to compute the visuomotor index for each cell. B: visuomovement index vs. velocity compensation metric (FR vs. SA − PE). FR for velocity compensation was measured during the visual trial epoch. Filled circles and solid regression line are for on-axis motion trials, open circles and dashed line are off-axis trials (thus each cell is represented by 2 data points). Correlation coefficient (r) and significance level (P) are given in the legend. Note that “SA − PE” is valid for on-axis trials and should be replaced by “SD–DE” for off-axis. C: same format as B except that the FR for the velocity compensation metric was taken from the presaccadic trial epoch.
As a measure of target-velocity compensation, we used the correlation between firing rate and the residual (SA − PE or SD − DE), which we will refer to as the “FR–residual correlation.” This correlation is a reflection of the fidelity with which each neuron encodes the portion of the saccade that depends on target velocity. Figure 6 shows how the FR–residual correlation is computed and Fig. 7 compares the correlation when it is based on visual activity versus presaccadic activity. Figure 8, B and C shows how the FR–residual correlation varies with VMI. In Fig. 8B, VMI is plotted against the FR–residual correlation, where “FR” refers to activity during the visual epoch. The results are plotted for both on- and off-axis target motions and there is no significant relationship between VMI and the FR–residual correlation in either case. Figure 8C plots the same quantities except that “FR” now refers to presaccadic activity. The more negative VMIs (which correspond to stronger movement-related activity) tend weakly to correlate with the FR–residual correlation. Thus cells whose activity is more movement related tend also to compensate more for target velocity.
Model for computing saccade amplitude based on the responses of velocity-modulated neurons
The data presented earlier provide evidence that FEF neurons represent initial retinal target position, target velocity, and saccade amplitude. Here we present a quantitative model, consistent with the data, that computes saccade amplitude from the responses of neurons that are tuned to retinal target position, but are modulated by target velocity. The principles of this model are very similar to eye position gain field models that have been used to represent head-centered target position using neurons sensitive to retinal target position and eye position (Cassanello and Ferrera 2007a,b; Keith and Crawford 2008; Pouget and Sejnowski 1997; Salinas and Abbott 1995; Siegel 1998; White and Snyder 2004; Xing and Andersen 2000; Zipser and Andersen 1988).
The model consisted of 101 neurons. The firing rate of each neuron was determined by the product of a retinal position sensitivity function [R(x)] and a target velocity sensitivity function [G(y)]
 |
(4) |
Retinal sensitivity was modeled as a Gaussian
 |
(5) |
where x represents retinal target position, ρ determines the retinal location of peak sensitivity (RF center), and σ determines the tuning width (RF size). These parameters varied across the population of neurons to provide coverage of the entire visual field. Examples of retinal sensitivity functions for six model neurons are shown in Fig. 9A. Target velocity sensitivity was modeled as a rectified linear function
 |
(6) |
where y is target velocity and the superscript (+) indicates that values below zero are made equal to zero. The parameter α represents the slope of the function and varied across the population of model neurons to provide a range of velocity sensitivities. The parameter β represents the y-axis intercept and was fixed for all neurons. Examples of target velocity functions for six model neurons are shown in Fig. 9B.
FIG. 9.

Quantitative model for predicting SA based on velocity-modulated neurons. A: spatial selectivity of a subset of model neurons. B: velocity selectivity for the same model neurons shown in A. C: responses of a single model neuron as a function of initial retinal target position computed by multiplying its spatial and velocity sensitivities. Different colors represent different TVs (see legend). D: SA predicted by the model for a range of initial target positions and TVs. The colors represent different TVs as in C. The filled circles represent SAs generated by the model. The dashed lines represent ideal velocity compensation.
Figure 9C illustrates how retinal position and target velocity sensitivities interact for a single model neuron. This neuron had a large value of ρ, resulting in an “open” RF. The amplitude of response increases with increasing target velocity. This is similar to the response of the FEF neuron shown in Fig. 5A.
Saccade amplitude is read out as the peak of the population response. For a stationary target, the peak of the population response is identical to retinal target position. However, for a moving target, responses are modulated by target velocity and this causes the population peak to shift in the direction of the target. The magnitude of the shift can be calibrated by adjusting the slopes of the target velocity functions.
The performance of the model over a range of target positions and velocities is shown in Fig. 9D. Each point shows saccade amplitude, as determined by the peak of the population response, for a particular target position and velocity. The different colors represent different target velocities as in Fig. 9C. The model was simulated with a delay of 500 ms. In other words, we assumed that the saccade was initiated 500 ms after target position was sampled. This is obviously unrealistic, but was done so that the magnitude of velocity compensation would be sizable relative to the range of target positions. In this case, perfect compensation would be 0.5TV, or 15.0° for a 30°/s target. Ideal compensation is shown as dashed lines in Fig. 9D. The average error of the model relative to ideal performance across all velocities and positions was 0.54°. Without compensation, the average error would have been 4.5°. For a more realistic delay of 100 ms, perfect compensation would be 0.1TV, with a maximum of 1.5°. This condition was modeled simply by reducing the slopes of the target velocity sensitivity functions for all neurons. When simulations were run for a 100-ms delay, the average error was 0.19°.
DISCUSSION
To make accurate saccades to moving targets, the oculomotor system may take advantage of information about both target position and velocity. The primate frontal eye field is a region in prefrontal cortex that receives visual input and is involved in programming eye movements. We have verified behaviorally that saccades to moving targets include a compensatory component that is proportional to target velocity. FEF neurons are sensitive to target velocity and this sensitivity increases during the time between the appearance of a moving visual target and the initiation of an eye movement to foveate that target. FEF neurons are also sensitive not only to the position of a moving target, but also to the metrics of the saccade required to intercept that target, and this sensitivity also evolves over time. The sensitivity to saccade metrics may therefore arise from computations that predict future target location based on target velocity. This study shows that FEF neurons encode position/direction error, saccade amplitude/direction, and target velocity, thereby establishing FEF as a likely site for the computation of future target position.
The neurons in our sample tended to have firing rates that were higher just prior to saccade onset than during the initial visual response. Thus most neurons would be classified as visual movement or movement related and few were purely visual. Neurons that were toward the movement end of the visual-movement spectrum tended to show a greater degree of target-velocity compensation than neurons with stronger visual activity. This trend suggests that target-velocity compensation emerges during the visuomotor transformation in FEF.
We developed a quantitative model to show how a population of velocity-modulated neurons can accurately encode saccade amplitude for moving targets. In the model, neurons are tuned for retinal position and their responses are multiplicatively scaled by target velocity. Scaling the responses of neurons with fixed RFs causes the peak of the population response to shift in the direction of target motion. The model matches several features of the FEF data. First, model neurons are tuned to retinal target position, consistent with the activity of position or direction error neurons found in the FEF (e.g., Fig. 3A). Second, model neurons are linearly modulated by target velocity, as are many FEF neurons (e.g., Fig. 6). The output of the model is saccade amplitude, consistent with the observation that some FEF neurons encode saccade amplitude or saccade direction (Fig. 3B). The performance of the model for realistic saccade latencies was, on average, within 0.2° of ideal target velocity compensation. The model is formally similar to eye position gain field models, except that target velocity modulates the neuronal response rather than eye position (Cassanello & Ferrera 2007a,b). This suggests that similar computations may underlie compensation for both target velocity and eye movements.
Relation to previous work
We previously reported evidence of direction and speed selectivity in FEF for moving random-dot stimuli presented while monkeys maintained stable fixation (Xiao et al. 2006). In that study, 52% of the neurons were significantly tuned for direction and 40% for speed (two-way ANOVA, P < 0.05). However, the stimulus was presented for 500 ms and, for different cells, the tuning emerged at different times within that epoch. The current report extends these observations by showing that there is selectivity for target velocity when monkeys performed visually guided saccades and that this selectivity was present in neural activity occurring between target onset and saccade initiation. Furthermore, velocity tuning evolved over time. Only 17% of cells were selective for target velocity in the first 100 ms after saccade target onset, whereas 54% were selective in the 100 ms prior to saccade initiation (one-way ANOVA, P < 0.05). These results suggest that the timing of target velocity signals in FEF is appropriate for controlling saccades to moving targets. Although it is true that target velocity, saccade amplitude, and position error are all linearly related, and therefore difficult to disentangle, we believe that it is the cells' sensitivity to target velocity that allows them to encode the compensatory movement. Shi et al. (1995) also examined FEF responses to moving targets and appear to have obtained results compatible with the current study, although this work has appeared only in abstract form.
Previous work in our lab has documented signals of predictive value that are present in FEF when monkeys make saccades to invisible moving targets (Barborica and Ferrera 2003; Xiao et al. 2007). The current report complements these observations by extending the notion that FEF is involved in motion extrapolation to the case of visible moving targets. It may be the case that an internal representation of invisible target motion is learned by generalizing the predictive response to visible moving targets. In this case, we would expect that the same neurons are involved in representing both visible and invisible moving targets.
The current results from FEF are quite different from those of a similar study in the superior colliculus. Keller et al. (1996) reported that during saccades to moving targets, neurons from the deeper layers of the SC encode retinal position error sampled at about 90 ms before the onset of the saccade, but do not encode saccade amplitude. This is consistent with reports that SC neurons are not selective for stimulus velocity unless monkeys are specifically trained to link motion with saccade direction (Horwitz and Newsome 2001; Horwitz et al. 2004). It appears that, although SC has reciprocal connections with FEF, it must not receive strong input from those FEF neurons that are sensitive to target velocity or that encode saccade amplitude for moving targets. The suggestion then is that FEF neurons that compensate for target motion provide input to saccade-generating circuitry via an extracollicular pathway.
Further evidence that target-velocity compensation for saccades depends on cortical pathways comes from lesion and stimulation studies. Segraves et al. (1987) found that lesions of primary visual cortex impaired the ability of monkeys to make accurate saccades to moving targets. It is likely that V1 is the source of motion signals in extrastriate cortex (Movshon and Newsome 1996) that are then relayed to FEF (Schall et al. 1995). Visual area MT is likely to be part of this pathway because lesions of MT also cause deficits in saccades to moving targets (Newsome et al. 1985), whereas microstimulation of direction columns in MT has systematic effects on saccade target-velocity compensation (Groh et al. 1997). Overall, the evidence points to a V1–MT–FEF–brain stem pathway as playing a role in target-velocity compensation for saccades.
GRANTS
This work was supported by National Institute of Mental Health Grant MH-59244.
The costs of publication of this article were defrayed in part by the payment of page charges. The article must therefore be hereby marked “advertisement” in accordance with 18 U.S.C. Section 1734 solely to indicate this fact.
Footnotes
Often-used abbreviations: firing rate (FR), target velocity (TV), saccade amplitude (SA), saccade direction (SD), position error (PE), and direction error (DE).
REFERENCES
- Balan 2003.Balan P, Ferrera VP. Effects of gaze shift on maintenance of spatial memory in macaque frontal eye field. J Neurosci 23: 5446–5454, 2003. [DOI] [PMC free article] [PubMed] [Google Scholar]
- Barborica 2003.Barborica A, Ferrera VP. Estimating invisible target speed from neuronal activity in monkey frontal eye field. Nat Neurosci 6: 66–74, 2003. [DOI] [PubMed] [Google Scholar]
- Barborica 2004.Barborica A, Ferrera VP. Modification of saccades evoked by stimulation of frontal eye field during invisible target tracking. J Neurosci 24: 3260–3267, 2004. [DOI] [PMC free article] [PubMed] [Google Scholar]
- Becker 1979.Becker W, Jurgens R. An analysis of the saccadic system by means of double step stimuli. Vis Res 19: 967–983, 1979. [DOI] [PubMed] [Google Scholar]
- Bruce 1985.Bruce CJ, Goldberg ME. Primate frontal eye fields. I. Single neurons discharging before saccades. J Neurophysiol 53: 603–635, 1985. [DOI] [PubMed] [Google Scholar]
- Bruce 1985.Bruce CJ, Goldberg ME, Bushnell MC, Stanton GB. Primate frontal eye field. II. Physiological and anatomical correlates of electrically evoked eye movements. J Neurophysiol 54: 714–734, 1985. [DOI] [PubMed] [Google Scholar]
- Cassanello 2007a.Cassanello CR, Ferrera VP. Saccade updating by vector subtraction: analysis of multiplicative gainfield models. Neural Comput 19: 2353–2386, 2007a. [DOI] [PubMed] [Google Scholar]
- Cassanello 2007b.Cassanello CR, Ferrera VP. Computing vector differences using a gain field-like mechanism in monkey frontal eye field. J Physiol 582: 647–664, 2007b. [DOI] [PMC free article] [PubMed] [Google Scholar]
- de Brouwer 2002.de Brouwer S, Missal M, Barnes G, Lefèvre P. Quantitative analysis of catch-up saccades during sustained pursuit. J Neurophysiol 87: 1772–1780, 2002. [DOI] [PubMed] [Google Scholar]
- de Brouwer 2001.de Brouwer S, Missal M, Lefèvre P. Role of retinal slip in the prediction of target motion during smooth and saccadic pursuit. J Neurophysiol 86: 550–558, 2001. [DOI] [PubMed] [Google Scholar]
- de Brouwer 2002.de Brouwer S, Yuksel D, Blohm G, Missal M, Lefèvre P. What triggers catch-up saccades during visual tracking? J Neurophysiol 87: 1646–1650, 2002. [DOI] [PubMed] [Google Scholar]
- Eggert 2005.Eggert T, Guan Y, Bayer O, Büttner U. Saccades to moving targets. Ann NY Acad Sci 1039: 149–159, 2005. [DOI] [PubMed] [Google Scholar]
- Goldberg 1986.Goldberg ME, Bushnell MC, Bruce CJ. The effects of attentive fixation on eye movements evoked by electrical stimulation of the frontal eye fields. Exp Brain Res 61: 579–584, 1986. [DOI] [PubMed] [Google Scholar]
- Groh 1997.Groh JM, Born RT, Newsome WT. How is a sensory map read out? Effects of microstimulation in visual area MT on saccades and smooth pursuit eye movements. J Neurosci 17: 4312–4330, 1997. [DOI] [PMC free article] [PubMed] [Google Scholar]
- Guan 2005.Guan Y, Eggert T, Bayer O, Büttner U. Saccades to stationary and moving targets differ in the monkey. Exp Brain Res 161: 220–232, 2005. [DOI] [PubMed] [Google Scholar]
- Heywood 1979.Heywood S, Churcher J. Saccades to step-ramp stimuli. Vis Res 21: 479–490, 1979. [DOI] [PubMed] [Google Scholar]
- Hooker 2000.Hooker C, Park S. Trajectory estimation in schizophrenia. Schizophr Res 45: 83–92, 2000. [DOI] [PubMed] [Google Scholar]
- Horwitz 2004.Horwitz GD, Batista AP, Newsome WT. Direction-selective visual responses in macaque superior colliculus induced by behavioral training. Neurosci Lett 366: 315–319, 2004. [DOI] [PubMed] [Google Scholar]
- Horwitz 2001.Horwitz GD, Newsome WT. Target selection for saccadic eye movements: direction-selective visual responses in the superior colliculus. J Neurophysiol 86: 2527–2542, 2001. [DOI] [PubMed] [Google Scholar]
- Keith 2008.Keith GP, Crawford JD. Saccade-related remapping of target representations between topographic maps: a neural network study. J Comput Neurosci 24: 157–178, 2008. [DOI] [PubMed] [Google Scholar]
- Keller 1996.Keller EL, Gandhi NJ, Weir PT. Discharge of superior collicular neurons during saccades made to moving targets. J Neurophysiol 76: 3573–3577, 1996. [DOI] [PubMed] [Google Scholar]
- Keller 1990.Keller EL, Steen Johnsen SD. Velocity prediction in corrective saccades during smooth-pursuit eye movements in monkey. Exp Brain Res 80: 525–531, 1990. [DOI] [PubMed] [Google Scholar]
- Movshon 1996.Movshon JA, Newsome WT. Visual response properties of striate cortical neurons projecting to area MT in macaque monkeys. J Neurosci 16: 7733–7741, 1996. [DOI] [PMC free article] [PubMed] [Google Scholar]
- Mullette-Gillman 2005.Mullette-Gillman OA, Cohen YE, Groh JM. Eye-centered, head-centered, and complex coding of visual and auditory targets in the intraparietal sulcus. J Neurophysiol 94: 2331–2352, 2005. [DOI] [PubMed] [Google Scholar]
- Newsome 1985.Newsome W, Wurtz R, Dursteler M, Mikami A. Deficits in visual motion processing following ibotonic acid lesions of the middle temporal visual area of the macaque monkey. J Neurosci 5: 825–840, 1985. [DOI] [PMC free article] [PubMed] [Google Scholar]
- Opris 2001.Opris I, Barborica A, Ferrera VP. On the gap effect for saccades evoked by electrical microstimulation of frontal eye fields in monkeys. Exp Brain Res 138: 1–7, 2001. [DOI] [PubMed] [Google Scholar]
- Pouget 1997.Pouget A, Sejnowski T. Spatial transformations in the parietal cortex using basis functions. J Cogn Neurosci 9: 222–237, 1997. [DOI] [PubMed] [Google Scholar]
- Robinson 1973.Robinson DA Models of the saccadic eye movement control system. Kybernetik 14: 71–83, 1973. [DOI] [PubMed] [Google Scholar]
- Ron 1989a.Ron S, Vieville T, Droulez J. Use of target velocity in saccadic programming. Brain Behav Evol 33: 85–89, 1989a. [DOI] [PubMed] [Google Scholar]
- Ron 1989b.Ron S, Vieville T, Droulez J. Target velocity based prediction in saccadic vector programming. Vision Res 29: 1103–1114, 1989b. [DOI] [PubMed] [Google Scholar]
- Salinas 1995.Salinas E, Abbott LF. Transfer of coded information from sensory to motor networks. J Neurosci 15: 6461–6474, 1995. [DOI] [PMC free article] [PubMed] [Google Scholar]
- Schall 1995.Schall JD, Morel A, King DJ, Bullier J. Topography of visual cortex connections with frontal eye field in macaque: convergence and segregation of processing streams. J Neurosci 15: 4464–4487, 1995. [DOI] [PMC free article] [PubMed] [Google Scholar]
- Schlag 2002.Schlag J, Schlag-Rey M. Through the eye, slowly: delays and localization errors in the visual system. Nat Rev Neurosci 3: 191–200, 2002. [DOI] [PubMed] [Google Scholar]
- Segraves 1987.Segraves MA, Goldberg ME, Deng SY, Bruce CJ, Ungerleider LG, Mishkin M. The role of striate cortex in the guidance of eye movements in the monkey. J Neurosci 7: 3040–3058, 1987. [DOI] [PMC free article] [PubMed] [Google Scholar]
- Shi 1995.Shi D, Friedman HR, Bruce CJ. Frontal eye field activity in conjunction with saccades made in response to step-ramp motion. Soc Neurosci Abstr 21: 1195, 1995. [Google Scholar]
- Siegel 1998.Siegel RM Representation of visual space in area 7a neurons using the center of mass equation. J Comp Neurosci 5: 365–381, 1998. [DOI] [PubMed] [Google Scholar]
- Stanton 1988.Stanton GB, Goldberg ME, Bruce CJ. Frontal eye field efferents in the macaque monkey: II. Topography of terminal fields in midbrain and pons. J Comp Neurol 271: 493–506, 1988. [DOI] [PubMed] [Google Scholar]
- White 2004.White RL, Snyder LH. A neural network model of flexible spatial updating. J Neurophysiol 91: 1608–1619, 2004. [DOI] [PubMed] [Google Scholar]
- Xiao 2006.Xiao Q, Barborica A, Ferrera VP. Radial motion bias in macaque frontal eye field. Vis Neurosci 23: 49–60, 2006. [DOI] [PubMed] [Google Scholar]
- Xiao 2007.Xiao Q, Barborica A, Ferrera VP. Modulation of visual responses in macaque frontal eye field during covert tracking of invisible targets. Cereb Cortex 17: 918–928, 2007. [DOI] [PubMed] [Google Scholar]
- Xing 2000.Xing J, Andersen RA. Memory activity of LIP neurons for sequential eye movements simulated with neural networks. J Neurophysiol 84: 651–665, 2000. [DOI] [PubMed] [Google Scholar]
- Zipser 1988.Zipser D, Andersen RA. A back-propagation programmed network that simulates response properties of a subset of posterior parietal neurons. Nature 331: 679–684, 1988. [DOI] [PubMed] [Google Scholar]