Abstract
Elucidating the relationship between the folding landscape of enzymes and their catalytic power has been one of the challenges of modern enzymology. The present work explores this issue by using a simplified folding model to generate the free-energy landscape of an enzyme and then to evaluate the activation barriers for the chemical step in different regions of the landscape. This approach is used to investigate the recent finding that an engineered monomeric chorismate mutase exhibits catalytic efficiency similar to the naturally occurring dimer even though it exhibits the properties of an intrinsically disordered molten globule. It is found that the monomer becomes more confined than its native-like counterpart upon ligand binding but still retains a wider catalytic region. Although the overall rate acceleration is still determined by reduction of the reorganization energy, the detailed contribution of different barriers yields a more complex picture for the chemical process than that of a single path. This work provides insight into the relationship between folding landscapes and catalysis. The computational approach used here may also provide a powerful strategy for modeling single-molecule experiments and designing enzymes.
Keywords: chorismate mutase, molten globule, preorganization, induced fit, dynamics
Although many proposals have been put forward to rationalize the enormous catalytic power of enzymes (1, 2), almost all of these proposals invoke a rather precise orientation of active-site groups. However, protein free-energy landscapes are very complex (3), and similar complexity may also apply to the landscape of activation barriers for the chemical step (2, 4,5–7). Thus we face the intriguing possibility that protein catalytic power may reflect the nature of its folding landscape. In fact, the realization that the chemical landscape is complex has motivated our approach of averaging calculated activation barriers in studies of enzyme catalysis (8).
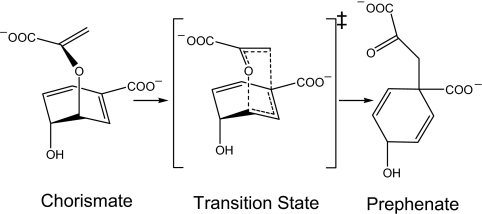
A closely related experimental observation has been provided by a study of Hilvert and coworkers (9, 10), who demonstrated that intrinsically disordered proteins can achieve large catalytic effects. These researchers converted a dimeric chorismate mutase (CM) from Methanococcus jannaschii, which catalyzes the conversion of chorismate to prephenate (see Fig. 1 and ref. 11) in the biosynthesis of l-tyrosine and l-phenylalanine, into a highly active monomer (mMjCM). Surprisingly, despite providing essentially the same catalytic power as the native enzyme, the engineered catalyst behaves like a molten globule, an ensemble of poorly packed and rapidly interconverting conformers. When it binds a transition-state analog (TSA), the monomer becomes more ordered, although the resulting complex retains unprecedented flexibility on the millisecond time scale across its entire length (9, 10). These findings seem to challenge the conventional view that efficient catalysis requires an exquisitely preorganized active-site structure.
Fig. 1.
Rearrangement of chorismate (Left) to prephenate (Right) via a chair-like transition state (Center).
The current work explores the relationship between folding and catalytic landscapes by using a simplified folding model to generate the folding landscape and then by evaluating the activation barriers for the chemical step in different regions of this landscape. The nature of the catalytic effect in both the engineered monomer and the dimeric WT CM is considered. Our study reproduces the observed experimental trends and reveals an interesting situation where the flat landscape of the monomer allows this system to move from the native enzyme·substrate (ES) complex and reach different preorganized catalytic configurations, without paying significant preorganization free energy. In addition to constituting a systematic computational study of the landscape for enzyme catalysis, the approach used here provides fundamental insight into the relationship between folding and catalysis and could become an effective tool for computer-aided enzyme design.
Simulating the Landscape for Folding and Catalysis
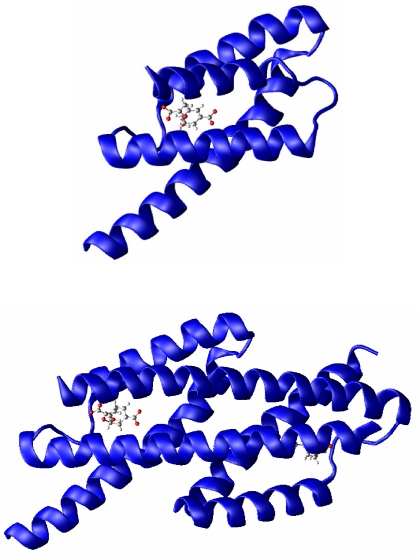
We start our study by using a simplified folding model to explore the free-energy landscape of the monomer and dimer systems. The two systems are the homodimeric CM from Escherichia coli (EcCM) (12) and the monomeric CM mMjCM obtained by Hilvert and coworkers (9) by topological redesign of the thermostable EcCM homologue from M. jannaschii (MjCM).¶ The coordinates for the EcCM (x-ray) and mMjCM (NMR) structures were obtained from the Protein Data Bank with ID codes 1ECM and 2GTV, respectively. Both enzymes adopt a helix-bundle structure (Fig. 2) and contain an endo-oxabicyclic dicarboxylic acid inhibitor that mimics the TS of the CM reaction at their active site.
Fig. 2.
3D structural representation of monomeric mMjCM (Upper) and dimeric EcM (Lower). The active site is occupied by the TSA, which is represented as a ball-and-stick model in both structures.
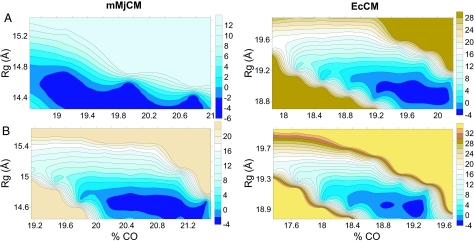
The free energy of the protein configurations was explored as a function of two well defined parameters, specifically the radius of gyration (Rg) and the contact order (CO) (see Methods). In principle, any set of generalized coordinates could have been used to explore how catalysis is influenced by protein flexibility. We chose Rg and CO because they have been successfully used in many folding simulations (13, 14). The resulting free-energy surface (which is referred to as a landscape) reflects the probability of finding the protein in different configurations, ranging from fully folded to partially unfolded. The landscapes for the two proteins in the absence of TSA are shown in Fig. 3A. As seen in Fig. 3A, the two surfaces are very different. Specifically, the monomer surface is more extended along the CO axis than the dimer. This feature is consistent with the corresponding experimental observation that the monomer behaves like a molten globule (9, 10). Fig. 3B depicts the folding landscapes in the presence of the TSA. The low energy region of the landscape becomes more confined than in the absence of TSA for both the monomer and the dimer, although this effect is much more pronounced in the case of the monomer, again in agreement with the experimental finding of a drastic reduction in molten globule character upon TSA binding (10).
Fig. 3.
Free-energy landscapes for the monomeric (mMjCM) (Left) and dimeric (EcCM) (Right) enzymes in the absence of TSA (A) and in the presence of TSA (B). The free-energy surface is represented in terms of the Rg and the percent CO. Energies are expressed in kcal/mol and distances are in Å.
Next, we explored the catalytic power of the monomer and the dimer in different regions of the folding landscape. This analysis was accomplished by calculating the full empirical valence bond (EVB) surfaces for: (i) explicit structures derived from the x-ray and NMR structures of EcCM and mMjCM, respectively (region I); (ii) explicit structures corresponding to the minimum free energy region of the simplified models for both enzymes, using a K′ = 5 kcal/mol·Å2 potential (see Methods) to constrain the distance between key catalytic residues and bound ligand to be near the corresponding native distance (region II); and (iii) explicit structures generated from a region far from the minimum of the simplified model, again with K′ = 5 kcal/mol·Å2 (region III). The sections of the landscape corresponding to regions II and III for the monomer and the dimer are shown in supporting information (SI) Fig. S1. As can be seen from Table S1, the procedure used for region I allows us to sample structures that are in the immediate neighborhood of the native proteins (rmsd < 1.0 Å). In contrast, the approach used in exploring regions II and III provides access to structures that are further away (rmsd <4.0 and >4.8 Å, respectively). Without a simplified model it would be difficult to generate the latter structures with reasonable statistics. Note that the constraint used to generate protein configurations in region II has no impact on the calculated activation free energies, which were determined with the explicit model without the constraint.
The structures used in the calculations of the barriers in region I were generated by running 200-ps molecular dynamics simulations on the relaxed native structure and saving structural files each 5 ps, thus generating a total of 40 starting conformations. To generate the structures for region II, we started by taking randomly simplified structures from the lowest energy portion of the folding landscape (Fig. S1). Next, we added the side chains to these simplified structures, while minimizing the distance between the simplified side-chain center and the new explicit side-chain center. Next, minimization and relaxation of the side chains were performed with the explicit model. Finally, we replaced the TSA by the substrate for the catalytic reaction (chorismate) and evaluated the free-energy barriers. Because the simplified model can only generate near native structures, region II is different from the exact native region and represents a region where the catalytic groups are not oriented perfectly. The same procedure was followed in the treatment of structures from region III (Fig. S1).
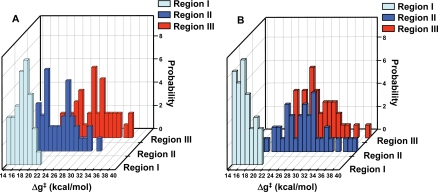
The experimentally observed activation barriers for the monomer and dimer are ≈16.9 and 16.3 kcal/mol (15), respectively. These can be compared with the calculated activation barriers and the probability of finding them within the population of the sample region (Fig. 4). As seen in Fig. 4, the lowest barriers are found in the native region (region I) for the monomer and the dimer, but we also found low barriers in region II. Interestingly, it appears that the monomer has a larger region with catalytic configurations than the dimer. That is, in the monomer we find a large probability of having barriers in the 16–18 kcal/mol range in region II, whereas the probability of encountering low barriers in the analogous region for the dimer is quite low. In region III, the probability of obtaining low activation barriers is zero in both systems.
Fig. 4.
The distribution of activation barriers for the monomer (A) and dimer (B) for different regions of the folding landscape. Region I was generated from the native mMjCM and EcCM structures; region II corresponds to low energy structures obtained by the simplified model (Fig. S1); and region III corresponds to higher-energy structures from the simplified landscape (Fig. S1). The average rmsd of structures in these regions are 0.9, 3.6, and 5.3 Å, respectively. The figure presents the probability of having a given value of the activation barrier (Δg‡) as a function of the value of the activation barrier.
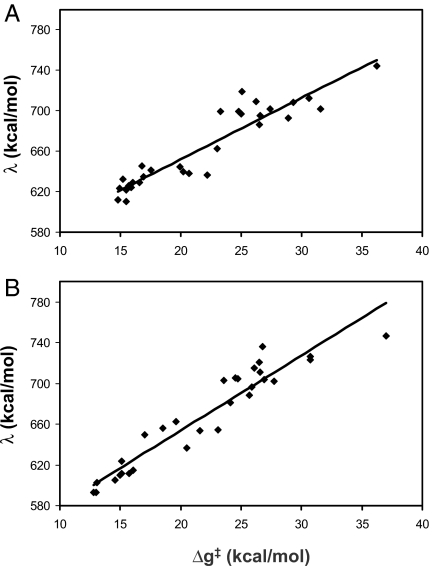
To further understand the nature of the catalytic effect in the different regions of the landscape we evaluated the reorganization free energies (λ) in different regions. As clarified in SI Text and ref. 8, λ is the free energy released if we start at the product state in the reactant structure and let the protein relax to the product structure (see Fig. S2). Because the changes in λ should be reflected in the activation free energy (Δg‡) (SI Text), we examined the correlation between the Δg‡ and λ values (Fig. 5) for both the monomer (Fig. 5A) and dimer (Fig. 5B). As seen in Fig. 5, the regions with low catalytic efficiency involve large reorganization in the direction of the reaction coordinate (the calculated reorganization energy is evaluated along the reaction coordinate), which means that although we have a large accessible landscape only a small part of it provides the needed small reorganization energy.
Fig. 5.
The correlation between the calculated activation barriers (Δg‡) and the calculated reorganization energy (λ) for the monomer (A) and the dimer (B). See also Fig. S2. The large value of λ reflects very large intramolecular contributions.
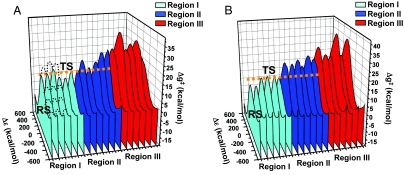
Finally, we considered the overall nature of the catalytic landscape (which corresponds to kcat) by sorting the activation barriers according to the rmsd of the atomic positions from the corresponding positions in the explicit native structure (this is possible because all of the activation barriers were calculated by using an explicit model regardless of the way the initial configuration was generated). The results of this analysis are depicted in Fig. 6. Fig. 6 arranges the free-energy profiles with arbitrary equal spacing and thus can only be considered as a qualitative description of the actual catalytic landscape (more quantitative ordering is given in Table S1). To reach more quantitative conclusions, the free energy of the different configurations in the reactant state was also estimated (SI Text). We have not determined the barrier for motion on the TS ridge between the different configurations considered in Fig. 6, so this challenging task is left for subsequent studies. However, our tentative landscape is clearly instructive. For example, as seen in Fig. 6, the catalytic configurations (with low barriers) for the WT EcCM dimer are confined to the native region, whereas the catalytic landscape of the monomer is more extended with some catalytic configurations in region II. That is, in the case of the monomer we have several low barriers in region II, whereas in the case of the dimer all of the barriers in the second region are significantly higher than those in the native region and thus cannot help in the catalytic process. The implications of the present findings are discussed below.
Fig. 6.
The landscape for the chemical profiles for the monomer (A) and the dimer (B). The profiles are equally spaced according to the rmsd from the native structure for the three regions (I, II, and III). The orange dashed line designates the 16 kcal/mol height that corresponds to reasonably low barriers. This line allows one to see that the monomer has several catalytic configurations in the second region, whereas the dimer does not have any (see Fig. 4). Black dashed lines indicate hypothetical barriers between the conformational states along the conformational coordinate. RS, reactant state; TS, transition state. See also Fig. S4. Note that Δε is the EVB energy gap.
Discussion
Because the relatively flat folding landscape found for the monomer seems to contradict the idea of optimized preorganization, we examined this observation from several perspectives. First, we evaluated the reorganization energy in several regions and showed that it is small only in regions with small activation barriers. We also showed in preliminary calculations (2) that the electrostatic contribution to protein stability is minimal in the regions with the largest catalytic effect. This effect, which is so crucial in enzyme catalysis, can be obtained even in the case of the CM monomer. It seems, however, that the region with low-reorganization energy in the case of mMjCM is wider than in the case of the dimer.
The approach exploited in this study provides a computational glimpse of the landscape that governs enzyme catalysis. It includes a statistical analysis of the probability of having small activation barriers in different regions (Fig. 4) and the landscape of activation barriers for randomly selected configurations. A more complete study will be needed to evaluate the barriers for moving between the different configurations used to construct Fig. 6 (see figure 3 in ref. 4 and the tentative barriers in Fig. 6A). Such an analysis will provide a more complete picture of the coupling between the different barriers.
Although the existence of a heterogeneous set of barriers provides an interesting twist to conventional enzyme models, it does not change the basic physics of enzyme catalysis. That is, the lowest barriers for the chemical step still determine the average rate and these barriers are determined by the corresponding reorganization energy (see below and SI Text). In other words, as long as the barriers between the different configurations in the ground state are lower than the chemical barrier, the solution of the multistate rate equation will follow the trend dictated by the lowest activation barriers. Of course, if the chemical barriers are very low (in the range of few kBT, where kB is the Boltzmann constant and T is the temperature), we will have diffusive type kinetics. However, the chemical barriers in most enzymes are >10 kcal/mol (the diffusion limit) and thus are likely to determine the overall rate. Although the reactant state energy could conceivably be higher in the native region (region I) than in region II (resulting in higher kcat/KM values for region II), the binding free energy is largest (more negative ΔGbind) in the native region for CM as was found in the preliminary analysis based on the treatment of Fig. S4 (see SI Text). The same conclusion emerged from studies of DNA polymerase (4), and probably applies to most enzymes. As a consequence, regions with the lowest kcat will generally have the largest contribution to catalysis (see SI Text). In this context, the small increase in kcat/KM relative to kcat observed in region II for the monomer (Table S2) is interesting and probably caused by entropic effects.
The finding of a shallow folding landscape might be considered as support for the idea that coupled motions contribute to catalysis (ref. 16 and references therein). However, as argued in our recent papers (2, 17), all reactions involve coupled motions, and properly preorganized active sites have in fact evolved to minimize motions along the reaction coordinate rather than to maximize them. To further explore this point, we calculated the coordinate vectors for the conformational change along the folding coordinate (from a partially unfolded to a folded structure) and the chemical reaction coordinate (evaluated between the reactant and product EVB states). The two multidimensional vectors calculated for the monomer are illustrated in Fig. S3. As seen in Fig. S3, the two vectors are nearly perpendicular when the conformational motion is defined by the vector that takes the system from the native structure to a partially unfolded structure with Rg ≈15 Å and %CO ≈20 (Fig. S3a). The situation is somewhat different when the protein is almost completely folded (Fig. S3b), indicating that the folding coordinate is not strongly coupled to the chemical reaction coordinate at regions far from the native structure. This finding is also relevant to the idea that motions in the landscape of the monomer constitute dynamical contributions to catalysis. That is, although there are motions on the millisecond time scale in the monomer [the rate constant for conversion of the initial encounter complex between mMjCM and the TSA to give the high affinity complex, k2 = 5.4 s−1 (10), is similar in magnitude to the turnover number for catalysis, kcat = 3.2 s−1], it is hard to see how these motions might be coupled dynamically to the chemical step (8, 17).
It should be emphasized that this study has not explored what happens when the barrier for the binding step is higher than the chemical barrier, because this does not seem to be the case in CM. That is, even with the above k2 and kcat values, the chemical barrier is not much smaller than the binding barrier. Here, we have to realize that there is no evolutionary pressure to reduce the chemical barrier for an enzyme-catalyzed reaction much below the diffusion controlled limit. As a consequence, it is unlikely that the chemical barrier will ever be much lower that the binding barrier. Thus, it is unlikely that the physics of our model will change significantly unless we reach the limit with a chemical barrier much smaller than the binding barrier [a very hypothetical case was modeled recently (7)].
There is currently significant interest in the role induced fit plays in catalysis and fidelity (see discussion in ref. 4), and here we have a case of induced fit. However, the induced-fit idea does not explain chemical catalysis because chemical catalysis is about the barrier for the chemical step when the substrate is already bound (which corresponds to kcat) and not about the fact that the binding of a substrate might help in preorganizing the active site, which obviously happens in the present case (see also ref. 4). Now, the issue in the case of the monomer is not the rather obvious finding that a positively charged active site is preorganized upon binding to a negatively charged substrate, but the fact that several configurations are able to provide similar preorganization. This finding is potentially very useful.
Perspectives
This work has explored fundamental aspects of the relationship between folding and catalytic landscapes, focusing on a comparison of an engineered but intrinsically disordered CM monomer and its native dimeric counterpart and exploring the observation that the molten globule protein can provide as much catalysis as the conventionally folded enzyme. Although the experimental findings may seem puzzling in view of the general assumption that an enzyme active site should be perfectly folded in the enzyme–substrate complex state, the present work demonstrates (in agreement with experiment) that the monomer has a larger catalytic region than the dimer.
There is significant interest in the relationship between single-molecule experiments and the nature of protein fluctuations and landscapes. A recent study (18), which focused on the relationship between electrostatic fluctuations and observed dielectric dispersion experiments, is particularly germane to our analysis. This study determined the behavior of the autocorrelation function C(t) of the electrostatic energy gap between the reactant and product state, which determines the rate constant (18). The next challenge is to reproduce the relevant information from actual simulations. Now, the behavior of C(t) on short time scales (nanoseconds) can be determined from the electrostatic fluctuations of the EVB energy gap obtained in the simulations of the activation barriers (2). However, the long-term behavior of C(t) is partially determined by the barriers along the configurational coordinate (the black dash barriers in Fig. 6A) and the fluctuations along these barriers. Thus, determining the configurational barrier and defining a “metric” for the distance between the different configurations will be extremely useful for modeling the fluctuations of the chemical barriers. This approach can provide deeper molecular insight in the interpretation of single-molecule experiments. In fact, a promising option for determining the behavior of C(t) over long time scales may involve using a Langevin dynamics approach to estimate the slow electrostatic fluctuations caused by transfer between different protein configurations.
Although the present work has focused on a microscopic catalytic landscape, it illustrates the potential of using a simplified model in studies of enzyme catalysis. For example, we can use the simplified model for fast exploration of the effect of charged mutations (as was done by an alternative model in ref. 19) and then evaluate the free energy of moving from the simplified to the explicit model at the TS region. This strategy should be useful for more systematic studies of the relationship between the protein folding and catalysis and in computer-aided enzyme design. Insofar as extended conformational probability distributions may reflect a common problem with designed enzymes, the ability to rapidly evaluate reorganization free energy may help guide experimental efforts to mimic the steep folding-catalysis landscapes of naturally evolved catalysts and improve the effectiveness of general enzyme design efforts.
Methods
To explore landscape effects and the probability of being at different configurations, it is important to be able to sample protein configurational space in an efficient way. At present, it is hard to accomplish this task with all atom models, and one viable option involves the use of a simplified protein model of the type used in simulations of protein folding (20–25). The version used in the present work is similar to that described in refs. 17 and 26. The simplified model is created by replacing the explicit side chain of each residue by an effective unified “atom” and an additional dummy atom. The unified atoms are placed at the center of mass of the corresponding side chains (with a residue-dependent charge and van der Waals parameters), and the dummy atoms are placed along the corresponding Cα–Cβ vectors and serve as tools for rotational transformations in the process of moving between the simplified and explicit models. The dummy atoms do not have any charge or van der Waals interactions with the rest of the system. The backbone atoms of each residue are treated explicitly, and the interactions between main-chain atoms are identical to those used in the explicit model. The potential surface of the simplified model has been described (17) and is written as:
Umain describes the potential energy for the main chain, which is a standard part of the MOLARIS software package (27). Uside-side describes the interaction between the side chains and is based on an “8–6” potential (as reported in refs. 17 and 26. The Umain-side term describes the interaction between the effective side chains and the main-chain atoms, and Usolvationself accounts for the change in the solvation energy of each of these groups upon moving from water to its protein site.
This simplified model can be used to determine the free energy of the protein as a function of any given set of coordinates [CO, native contacts, or native hydrogen bonds (13, 14)]. In the present case, we evaluated the free-energy landscape in terms of two parameters, the Rg and the CO (13), which is defined by,
where N is the total number of contacts in the protein, ΔZi,j is the number of residues separating contacts j and i, and L is the number of residues in the protein.
The free-energy surface was evaluated by using the FEP/US method (28) as in our previous study (17) as a function of the Rg and sorting the results in two dimensions (X1 = Rg, X2 = CO). The starting points for the free-energy landscapes were taken as the structure of the simplified model after 200 ps of equilibration. Starting from this structure, we obtained the free-energy surfaces, following the FEP/US method and applying a force constant of 100 kcal/mol·Å2 by unfolding the systems by increasing their Rg along 21 frames of 60 ps each at 300 K and with 1-fs time steps.
A crucial element of our study is the evaluation of the barrier for the chemical step in different protein conformations. The reaction (Fig. 1) was described by the EVB approach using the same treatment used in our previous EVB studies of CM (29) with the MOLARIS simulation program (27) using the ENZYMIX force field. The EVB activation barriers were calculated at the configurations selected by applying the same FEP/US approach used in all of our EVB studies. The simulation systems were solvated by the surface constrained all atom solvent model (27) using a radius for the explicit region of 18 Å, whereas long-range electrostatic effects were treated by the local reaction field method (27). The FEP mapping was evaluated by 21 frames of 20 ps each for moving along the reaction coordinate with our all atom surface constrained spherical model. All of the simulations were done at 300 K with a time step of 1 fs.
The problem is, of course, to relate the activation barriers of the chemical steps to the corresponding regions on the free-energy landscape. Here, we exploited the simplified folding model as a reference potential for studies of the free-energy surface of the explicit model (17, 26). This was done by taking points from the simplified landscape of the protein + TSA system, generating from them explicit models, and then calculating the full EVB profile starting from the given relaxed explicit model. Our preliminary exploration of this approach indicated that the lowest free-energy region in the simplified model (minimum region) did not produce the best catalytic configurations, because the simplified enzyme substrate model has not been refined sufficiently in terms of protein–substrate interactions. This does not pose a fundamental problem, however, because the simplified model is only used as a reference potential for calculations of the explicit landscape. Thus, any variation of the simplified potential is allowed, provided that one can get the difference between the simplified and explicit potentials (and use it to determine the free energy of moving from the simplified to the explicit model). To that end, we added an additional term (U′), the reflected constraint on the distance between the catalytic residues and the substrate, to the simplified potential:
where the ro,i are the distances between key charged residues and the substrate in the simplified model generated from the original x-ray or NMR structures. In principle, we could evaluate the free-energy landscape of the simplified model in terms of Rg, CO, and U′, and then calculate the free energy of moving from the simplified model to the explicit model. However, at this stage we use U′ mainly to explore different ranges in the overall landscape. Note that U′ is not used in the explicit model.
Supplementary Material
Acknowledgments.
We thank Dr. M. Kato for his previous work, Dr. P. K. Sharma for his useful help, and the University of Southern California's High-Performance Computing and Communication Center for computer time. M.R. thanks the Generalitat Valenciana of Spain for the postdoctoral fellowship. This work was supported by National Institutes of Health Grant GM24492 and the Schweizerischer Nationalfonds.
Footnotes
The authors declare no conflict of interest.
This article is a PNAS Direct Submission.
The dimer simulations were performed with EcCM rather than MjCM, which is more closely related to the monomer, because of the absence of detailed 3D structural information for MjCM. Because EcCM is mesostable, whereas MjCM is thermostable, differences between the monomer and the EcCM dimer are probably less pronounced than the corresponding differences between the monomer and the MjCM enzyme.
This article contains supporting information online at www.pnas.org/cgi/content/full/0803405105/DCSupplemental.
References
- 1.Marti S, et al. Theoretical insights in enzyme catalysis. Chem Soc Rev. 2004;33:98–107. doi: 10.1039/b301875j. [DOI] [PubMed] [Google Scholar]
- 2.Warshel A, et al. Electrostatic basis for enzyme catalysis. Chem Rev. 2006;106:3210–3235. doi: 10.1021/cr0503106. [DOI] [PubMed] [Google Scholar]
- 3.Onuchic JN, Wolynes PG. Theory of protein folding. Curr Opin Struct Biol. 2004;14:70–75. doi: 10.1016/j.sbi.2004.01.009. [DOI] [PubMed] [Google Scholar]
- 4.Xiang Y, Goodman MF, Beard WA, Wilson SH, Warshel A. Εxploring the role of large conformational changes in the fidelity of DNA polymerase β. Proteins. 2008;70:231–247. doi: 10.1002/prot.21668. [DOI] [PMC free article] [PubMed] [Google Scholar]
- 5.Benkovic SJ, Hammes GG, Hammes-Schiffer S. Free-energy landscape of enzyme catalysis. Biochemistry. 2008;47:3317–3321. doi: 10.1021/bi800049z. [DOI] [PubMed] [Google Scholar]
- 6.Prakash MK, Marcus RA. An interpretation of fluctuations in enzyme catalysis rate, spectral diffusion, and radiative component of lifetimes in terms of electric field fluctuations. Proc Natl Acad Sci USA. 2007;104:15982–15987. doi: 10.1073/pnas.0707859104. [DOI] [PMC free article] [PubMed] [Google Scholar]
- 7.Min W, Xie XS, Bagchi B. Two-dimensional reaction free energy surfaces of catalytic reaction: Effects of protein conformational dynamics on enzyme catalysis. J Phys Chem B. 2008;112:454–466. doi: 10.1021/jp076533c. [DOI] [PubMed] [Google Scholar]
- 8.Liu H, Warshel A. The catalytic effect of dihydrofolate reductase and its mutants is determined by reorganization energies. Biochemistry. 2007;46:6011–6025. doi: 10.1021/bi700201w. [DOI] [PubMed] [Google Scholar]
- 9.Vamvaca K, Vögeli B, Kast P, Pervushin K, Hilvert D. An enzymatic molten globule: Efficient coupling of folding and catalysis. Proc Natl Acad Sci USA. 2004;101:12860–12864. doi: 10.1073/pnas.0404109101. [DOI] [PMC free article] [PubMed] [Google Scholar]
- 10.Pervushin K, Vamvaca K, Vögeli B, Hilvert D. Structure and dynamics of a molten globular enzyme. Nat Struct Mol Biol. 2007;14:1202–1206. doi: 10.1038/nsmb1325. [DOI] [PubMed] [Google Scholar]
- 11.Gajewski JJ, et al. On the mechanism of rearrangement of chorismic acid and related compounds. J Am Chem Soc. 1987;109:1170–1186. [Google Scholar]
- 12.Lee AY, Karplus PA, Ganem B, Clardy J. Atomic structure of the buried catalytic pocket of Escherichia coli chorismate mutase. J Am Chem Soc. 1995;117:3627–3628. [Google Scholar]
- 13.Fersht AR. Transition-state structure as a unifying basis in protein-folding mechanisms: Contact order, chain topology, stability, and the extended nucleus mechanism. Proc Natl Acad Sci USA. 2000;97:1525–1529. doi: 10.1073/pnas.97.4.1525. [DOI] [PMC free article] [PubMed] [Google Scholar]
- 14.Shea JE, Onuchic JN, Brooks CL. Probing the folding free-energy landscape of the src-SH3 protein domain. Proc Natl Acad Sci USA. 2002;99:16064–16068. doi: 10.1073/pnas.242293099. [DOI] [PMC free article] [PubMed] [Google Scholar]
- 15.MacBeath G, Kast P, Hilvert D. Redesigning enzyme topology by directed evolution. Science. 1998;279:1958–1961. doi: 10.1126/science.279.5358.1958. [DOI] [PubMed] [Google Scholar]
- 16.Hammes-Schiffer S, Benkovic SJ. Relating protein motion to catalysis. Annu Rev Biochem. 2006;75:519–541. doi: 10.1146/annurev.biochem.75.103004.142800. [DOI] [PubMed] [Google Scholar]
- 17.Roca M, Liu H, Messer B, Warshel A. On the relationship between thermal stability and catalytic power of enzymes. Biochemistry. 2007;46:15076–15088. doi: 10.1021/bi701732a. [DOI] [PMC free article] [PubMed] [Google Scholar]
- 18.Prakash MK, Marcus RA. An interpretation of fluctuations in enzyme catalysis rate, spectral diffusion, and radiative component of lifetimes in terms of electric field fluctuations. Proc Natl Acad Sci USA. 2007;104:15982–15987. doi: 10.1073/pnas.0707859104. [DOI] [PMC free article] [PubMed] [Google Scholar]
- 19.Ishikita H, Warshel A. Predicting drug-resistant mutations of HIV protease. Angew Chem Int Ed. 2008;47:697–700. doi: 10.1002/anie.200704178. [DOI] [PubMed] [Google Scholar]
- 20.Levitt M, Warshel A. Computer simulation of protein folding. Nature. 1975;253:694–698. doi: 10.1038/253694a0. [DOI] [PubMed] [Google Scholar]
- 21.Bryngelson JD, Wolynes PG. Spin glasses and the statistical mechanics of protein folding. Proc Natl Acad Sci USA. 1987;84:7524–7528. doi: 10.1073/pnas.84.21.7524. [DOI] [PMC free article] [PubMed] [Google Scholar]
- 22.Hinds DA, Levitt M. A lattice model for protein-structure prediction at low resolution. Proc Natl Acad Sci USA. 1992;89:2536–2540. doi: 10.1073/pnas.89.7.2536. [DOI] [PMC free article] [PubMed] [Google Scholar]
- 23.Shakhnovich E, Abkevich V, Ptitsyn O. Conserved residues and the mechanism of protein folding. Nature. 1996;379:96–98. doi: 10.1038/379096a0. [DOI] [PubMed] [Google Scholar]
- 24.Dill KA. Dominant forces in protein folding. Biochemistry. 1990;29:7133–7155. doi: 10.1021/bi00483a001. [DOI] [PubMed] [Google Scholar]
- 25.Olszewski KA, Kolinski A, Skolnick J. Folding simulations and computer redesign of protein A three-helix bundle motifs. Proteins. 1996;25:286–299. doi: 10.1002/(SICI)1097-0134(199607)25:3<286::AID-PROT2>3.0.CO;2-E. [DOI] [PubMed] [Google Scholar]
- 26.Fan ZZ, Hwang JK, Warshel A. Using simplified protein representation as a reference potential for all-atom calculations of folding free energy. Theor Chem Acc. 1999;103:77–80. [Google Scholar]
- 27.Lee FS, Chu ZT, Warshel A. Microscopic and semimicroscopic calculations of electrostatic energies in proteins by the Polaris and Enzymix programs. J Comput Chem. 1993;14:161–185. [Google Scholar]
- 28.Warshel A. Computer Modeling of Chemical Reactions in Enzymes and Solutions. New York: Wiley; 1991. [Google Scholar]
- 29.Strajbl M, Shurki A, Kato M, Warshel A. Apparent NAC effect in chorismate mutase reflects electrostatic transition state stabilization. J Am Chem Soc. 2003;125:10228–10237. doi: 10.1021/ja0356481. [DOI] [PubMed] [Google Scholar]
Associated Data
This section collects any data citations, data availability statements, or supplementary materials included in this article.


