

Abstract
Background:
Behavioral variant frontotemporal dementia (bvFTD) strikes hardest at the frontal lobes, but the sites of earliest injury remain unclear.
Objective:
To determine atrophy patterns in distinct clinical stages of bvFTD, testing the hypothesis that the mildest stage is restricted to frontal paralimbic cortex.
Design:
A bvFTD cohort study.
Setting:
University hospital dementia clinic.
Participants:
Patients with bvFTD with Clinical Dementia Rating (CDR) scale scores of 0.5 (n=15), 1 (n=15), or 2 to 3 (n=15) age and sex matched to each other and to 45 healthy controls.
Main Outcome Measures:
Magnetic resonance voxel-based morphometry estimated gray matter and white matter atrophy at each disease stage compared with controls.
Results:
Patients with a CDR score of 0.5 had gray matter loss in frontal paralimbic cortices, but atrophy also involved a network of anterior cortical and subcortical regions. A CDR score of 1 showed more extensive frontal gray matter atrophy and white matter losses in corpus callosum and brainstem. A CDR score of 2 to 3 showed additional posterior insula, hippocampus, and parietal involvement, with white matter atrophy in presumed frontal projection fibers.
Conclusions:
Very mild bvFTD targets a specific subset of frontal and insular regions. More advanced disease affects white matter and posterior gray matter structures densely interconnected with the sites of earliest injury.
Behavioral variant frontotemporal dementia (bvFTD) is the most common clinical syndrome associated with frontotemporal lobar degeneration pathology. This bvFTD has been associated with frontal, temporal, and insular degeneration accompanied by early deficits in personal and social conduct, emotion, and insight.1,2 The syndrome progresses relentlessly, with an interval of 3 to 5 years from diagnosis to death.3-5
Although the brain regions affected in bvFTD have been characterized without specific regard to disease stage,2,6-9 information is lacking about where the neurodegeneration begins. In Alzheimer disease, early pathologic changes target the medial temporal lobe.10 Early bvFTD, however, has proved difficult to study, and whether the disease begins focally, affecting 1 or 2 neighboring brain regions,11 or whether it affects a network of regions from early in its course is still unknown.6 Patients with little or no atrophy on magnetic resonance imaging (MRI) have been described, but their underlying diagnoses remain uncertain.12
Converging evidence implicates the dorsomedial and orbital frontoinsular cortices in bvFTD. In particular, neuroimaging studies have highlighted pregenual anterior cingulate (ACC) and frontoinsula (FI) cortex involvement through structural,2,6 metabolic,8,13,14 perfusion,9 and neurotransmitter receptor14 imaging analyses. Still, this body of work (for a review and meta-analysis, see Schroeter et al15) has not resolved the question of where bvFTD begins. Group studies often combine patients of varying clinical stages, rendering a picture of FTD as a diffuse frontal disorder. Few studies have attempted to refine the early anatomical picture. Broe et al16 examined gross atrophy patterns among 7 patients who died with clinically mild to moderate bvFTD. Four showed tissue loss restricted to dorsomedial frontal, orbital frontoinsular, and anterior hippocampal regions. A single presymptomatic P301L tau mutation carrier was found to have pregenual ACC and dorsolateral prefrontal hypometabolism.17 A recent volumetric region-of-interest MRI analysis stratified patients according to overall frontal atrophy severity.11 Among 3 patients classified as having mild disease, no single subregion was atrophic, whereas 6 moderately affected patients showed only orbitofrontal and right insular atrophy. These studies, although tantalizing, need to be extended through larger studies of bvFTD in its earliest clinical stages.
In the present study, we used a cross-sectional approach to identify brain structures atrophied in very mild, mild, and moderate to severe bvFTD, stratifying patients on clinical grounds according to the Clinical Dementia Rating (CDR) scale. On the basis of recent neuropathologic observations16,18 and previous bvFTD imaging studies,2,6,8,9,13,14 we hypothesized that the ACC and FI would be among the few regions focally affected in patients with very mild bvFTD.
METHODS
PARTICIPANTS
We searched the University of California at San Francisco Memory and Aging Center database for patients with a research diagnosis of FTD1 (also known as bvFTD), a high-quality MRI, and a CDR score.19 Fifty-eight patients met these criteria; 13 had coexisting motor neuron disease (MND). All were evaluated with an extensive protocol described previously.2 Neuroimaging abnormalities were not required for diagnosis.1 Among the 58 candidate patients, 15 had a CDR score of 0.5 (very mild dementia). For 14 of these 15, the CDR score was determined within 6 months of imaging (mean separation, 20.4 days; range, 0-65 days). We included 1 patient with a longer interval (MRI 372 days after CDR score was determined) whose Mini-Mental State Examination (MMSE) score and clinical status had not changed significantly between imaging (MMSE score, 28) and CDR score determination (MMSE score,29). We then matched 15 patients with a CDR score of 1 (mild) or 2 to 3 (moderate to severe) to our group with a CDR score of 0.5, seeking comparable distributions of age, sex, and the presence of MND (Table 1). We chose a uniform group size of 15 so that patterns of atrophy typical of each group would not be influenced by statistical power. All patients with a CDR score of 1 or higher had a CDR score determined within 6 months of imaging (CDR score of 1: mean, 27.5 days; range, 0-98 days; CDR score of 2 to 3: mean, 21.8 days; range, 0-147 days). For 2 patients in the group with a CDR score of 2 to 3, the total CDR score was estimated as 2 to 3 based on an ongoing requirement for full-time care; therefore, CDR subscale scores were not available for these patients. Forty-five healthy control subjects were matched to the patient groups (Table 1). All procedures were approved by the University of California at San Francisco Committee on Human Research, and informed consent was obtained from all participants (or their surrogates) according to the Declaration of Helsinki.
Table 1.
Demographic and Neuropsychological Variables for bvFTD Patient Groups and Controlsa
| Patients With bvFTD |
|||||
|---|---|---|---|---|---|
| Variable | Controls | CDR Score of 0.5 | CDR Score of 1 | CDR Score of 2-3 | Overall ANOVA |
| Age, y | 68.3 (7.9) | 65.9 (8.3) | 64.3 (8.9) | 62.3 (10.3) | F3,86=2.16 |
| Educational level, y | 16.4 (2.4) | 14.7 (3.3) | 15.9 (2.3) | 14.5 (2.4) | F3,86=3.00 |
| Male/female, No. | 23/22 | 9/6 | 10/5 | 7/8 | |
| Duration of symptoms, y | 5.8 (4.8) | 4.7 (3.6) | 6.1 (3.2) | F2,42=0.54 | |
| CDR box score sum | 0.0 (0.0) | 3.6 (2.3)b,c | 6.1 (1.4)c,d | 11.5 (2.5)b,c | F2,42=46.8e |
| MMSE score [range] (maximum score, 30) | 29.5 (0.7) [27-30] | 26.7 (3.1) [20-30]c | 23.3 (7.9) [2-29]c,f | 15.7 (7.7) [0-27]b,d,f | F3,84=33.9e |
| CVLT-SF, 4 trials, score (maximum score, 28) | 29.5 (3.8) | 19.6 (4.4)c,f | 18.1 (7.0)c,f | 9.3 (7.9)b,d,f | F3,75=52.0e |
| CVLT-SF, 10-minute recall, score (maximum score, 9) | 7.3 (1.6) | 3.0 (1.9)c,f | 4.1 (2.4)c,f | 0.7 (0.9)b,d,f | F3,71=47.9e |
| Modified Rey-Osterrieth copy score (maximum score, 17) | 15.8 (1.4) | 14.6 (1.8)c | 14.9 (1.8)c | 11.2 (5.4)b,d,f | F3,80=11.0e |
| Modified Rey-Osterrieth delay score (maximum score, 17) | 12.5 (3.1) | 7.1 (4.1)c,f | 5.7 (4.0)c,f | 1.8 (2.7)b,d,f | F3,79=37.6e |
| Digit span backward score | 5.3 (1.2) | 3.9 (1.1)f | 3.7 (1.9)f | 2.8 (2.4)f | F3,81=11.2e |
| Modified Trails B score (correct lines in 1 minute) | 32.4 (12.2) | 13.5 (15.5)f | 11.8 (14.3)f | 7.3 (8.8)f | F3,76=19.4e |
| Stroop interference task score (correct in 1 minute) | 55.1 (15.3) | 33.0 (24.9)f | 28.6 (16.9)f | 22.4 (16.1)f | F3,71=13.8e |
| Design fluency score (correct in 1 minute) | 11.2 (2.5) | 6.1 (4.0)f | 5.5 (2.7)f | 3.6 (3.5)f | F3,69=26.9e |
| Phonemic fluency score (D words generated in 1 minute) | 15.5 (4.6) | 8.2 (5.7)f | 5.8 (4.2)f | 3.8 (4.0)f | F3,81=31.5e |
| Semantic fluency score (animals generated in 1 minute) | 22.8 (5.3) | 10.0 (6.3)c,f | 8.8 (5.4)f | 4.6 (4.2)d,f | F3,83=57.5e |
| Abbreviated BNT score (maximum score, 15) | 14.6 (0.7) | 11.2 (3.7)f | 11.3 (4.5)f | 8.7 (3.7)f | F3,83=17.4e |
| Calculations score (maximum score, 5) | 4.8 (0.4) | 4.1 (1.2)c | 3.5 (1.8)f | 2.5 (1.5)d,f | F3,82=16.9e |
Abbreviations: ANOVA, analysis of variance; BNT, Boston Naming Test; bvFTD, behavioral variant frontotemporal dementia; CDR, Clinical Dementia Rating; CVLT-SF, California Verbal Learning Test–Short Form; MMSE, Mini-Mental State Examination.
Data are presented as mean (SD) unless otherwise indicated.
P< .05 vs CDR score of 1.
P< .05 vs CDR score of 2 to 3.
P< .05 vs CDR score of 0.5.
P< .01 across groups.
P< .05 vs controls.
NEUROPSYCHOLOGICAL BATTERY
The neuropsychological battery has been described elsewhere.2 General intellectual functioning was assessed with the MMSE. Memory tests included the California Verbal Learning Test–Short Form and 10-minute free recall of the modified Rey-Osterrieth complex figure. Language was assessed with the abbreviated (15-item) Boston Naming Test and semantic fluency (animals generated in 1 minute). Copy of the modified Rey-Osterrieth figure provided a measure of visuospatial functioning. Executive function tests included phonemic fluency (D words generated in 1 minute), design fluency (Delis-Kaplan Executive Functions System–Trial 1), a modified version of the Trails B test, backward digit span, and the Stroop interference task. Patients were asked to perform 5 simple arithmetic calculations.
Group differences in continuous demographic and neuropsychological variables were assessed with 1-way analyses of variance and post hoc Tukey tests for pairwise group comparisons, correcting for multiple comparisons. Dichotomous measures were evaluated using χ2 analyses.
VOXEL-BASED MORPHOMETRY
Image Acquisition
Structural MRI was performed with a 1.5-T Magneton VISION system (Siemens Inc, Iselin, New Jersey). A volumetric magnetization-prepared rapid gradient echo MRI (repetition time, 10 milliseconds; echo time, 4 milliseconds; inversion time, 300 milliseconds) was used to obtain a T1-weighted image of the entire brain (15° flip angle, coronal orientation perpendicular to the double spin echo sequence, 1.0×1.0-mm2 in-plane resolution of 1.5-mm slab thickness).
Preprocessing and Analysis
Voxel-based morphometry (VBM) is a whole-brain MRI analysis technique used to assess local changes in brain tissue content. It includes an image-preprocessing step followed by statistical analysis. Both were implemented in the SPM2 software package (www.fil.ion.ucl.ac.uk/spm). Preprocessing followed the optimized VBM protocol.20 A study-specific template and prior probability maps were created. Voxel values were modulated by multiplying them by the jacobian determinants derived from the spatial normalization step, and all images were smoothed with a 12-mm isotropic gaussian kernel. Identical procedures were applied to gray matter (GM) and white matter (WM) compartments.
Statistical analysis was applied to 4 groups: control subjects and patients with bvFTD with a CDR score of 0.5 (very mild bvFTD), 1 (mild bvFTD), and 2 to 3 (moderate to severe bvFTD). Age and sex were entered into the model as nuisance covariates, and total intracranial volume was used as a global correction factor. Comparisons of interest were each patient group vs controls. Exploratory head-to-head bvFTD group comparisons were also performed. The statistical threshold was set at P<.05, whole brain corrected for familywise error.
RESULTS
GROUP DEMOGRAPHIC AND NEUROPSYCHOLOGICAL FEATURES
Consistent with our study design, groups were similar in age, sex, and educational level (Table 1), and patient groups did not differ statistically in the rate of coexisting MND (CDR score of 0.5, 5 of 15 patients; CDR score of 1, 5 of 15 patients; CDR score of 2-3, 3 of 15 patients; χ2=0.86; P=.65). Symptom duration did not differ significantly across bvFTD groups, suggesting that mildly affected patients represent a more indolent disease course, having relatively few symptoms despite a symptomatic interval similar to that seen in patients with later-stage disease. As indicated in Table 2, patients with very mild bvFTD showed greatest impairment on the CDR subscale for judgment and problem solving, followed by community affairs and home and hobbies. Memory and orientation were the least affected across stages, with no patient showing a subscale score greater than 1 except in moderate to severe disease.
Table 2.
Clinical Dementia Rating (CDR) Subscale Scores in Very Mild, Mild, and Moderate to Severe Behavioral Variant Frontotemporal Dementia CDR Subscale CDR Score, Median (Range) Very Mild Mild Moderate to Severea
| CDR Score, Median (Range) |
|||
|---|---|---|---|
| CDR Subscale | Very Mild |
Mild | Moderate to Severea |
| Memory | 0.5 (0-1) | 1.0 (0.5-1) | 1.0 (1-3) |
| Orientation | 0.0 (0-1) | 0.5 (0-1) | 1.0 (1-2) |
| Judgment and problem solving | 1.0 (0-2) | 1.0 (1-3) | 2.0 (2-3) |
| Community affairs | 0.5 (0-2) | 1.0 (1-2) | 2.0 (2-3) |
| Home and hobbies | 0.5 (0-2) | 1.0 (1-2) | 2.0 (2-3) |
| Personal care | 0.0 (0-2) | 1.0 (0-2) | 2.0 (0-3) |
n = 13 (see the “Participants” subsection of the “Methods” section).
Neuropsychological performance differed with stage (Table 1). At a CDR score of 0.5, patients with bvFTD showed mild executive and memory deficits that were slightly worse at a CDR score of 1. A CDR score of 2 to 3 involved posterior cortical functions (calculations and drawing) consistent with biparietal atrophy identified with VBM, although worsening executive function could also have contributed to these deficits. Overall, lower MMSE scores were correlated with more advanced disease stage, as indicated by the CDR (MMSE vs CDR box score sum: Pearson r=−0.53, P=.001, n=39).
VBM-ESTIMATED GM
Patients with a CDR score of 0.5 showed circumscribed GM atrophy in a network of anterior brain regions (Figure 1 and eTable; available at: http://manuscripts.archneurol.com), including paralimbic (ACC, FI, dorsal anterior insula, and lateral orbitofrontal cortex), frontal neocortical (dorsolateral, rostromedial, and frontal polar), limbic (right hippocampus), and subcortical (ventral striatum and dorsomedial thalamus) areas, as well as the precentral gyrus. Extent of right hemisphere involvement exceeded that on the left.
Figure 1.

Stage-specific gray matter atrophy in behavioral variant frontotemporal dementia. Maps of significantly atrophied voxels (each group vs controls: P<.05, whole brain corrected) are overlaid on the study-specific brain template, using an inclusive gray matter mask for visualization purposes only. On the right, the same color scheme is overlaid on a single image to show overlap of stage-related atrophy patterns. The right side of the axial and coronal images corresponds to the right side of the brain. Numbers indicate the MNI (Montreal Neurological Institute) coordinate of the template brain magnetic resonance image shown. CDR indicates Clinical Dementia Rating; CDR 1-3, mild to severe; CDR 0.5, very mild; CDR 1, mild; and CDR 2+, moderate to severe.
eTable.
Regions of Gray Matter Loss in Very Mild, Mild, and Moderate to Severe bvFTD
| CDR Score |
|||||||
|---|---|---|---|---|---|---|---|
| 0.5 |
1 |
2-3 |
|||||
| Region | BA | x, y, z | z Score | x, y, z | z Score | x, y, z | z Score |
| Paralimbic | |||||||
| R pregenual ACC | 24 | 2, 36, 14 | 5.79 | 4, 38, 20 | 5.66 | 2, 28, 18 | 6.68 |
| L pregenual ACC | 24 | −2, 36, 12 | 5.83 | −2, 38, 16 | 5.06 | −2, 32, 16 | 6.61 |
| R paracingulate | 32 | 2, 44, 20 | 5.79 | 2, 44, 30 | 5.92 | 2, 44, 28 | 6.81 |
| L paracingulate | 32 | −2, 48, 22 | 5.38 | −2, 46, 28 | 5.98 | −2, 46, 24 | 5.96 |
| R rostromedial SFG | 10 | 2, 53, −4 | 5.89 | −2, 58, 2 | 5.83 | 1, 53, −3 | 6.82 |
| L rostromedial SFG | 10 | −2, 54, −4 | 5.52 | −2, 54, −2 | 5.57 | −2, 54, −4 | 6.62 |
| R subgenual ACC | 25 | 2, 8, −4 | 5.44 | 4, 8, −8 | 5.43 | 4, 8, −6 | 7.05 |
| L subgenual ACC | 25 | −4, 12, −6 | 4.85 | −4, 8, −6 | 5.20 | −4, 10, −6 | 6.88 |
| R frontal insula | 47/12 | 42, 17, −10 | 5.46 | 36, 18, −8 | 5.58 | 42, 16, −12 | 6.80 |
| L frontal insula | 47/12 | −39, 17, −13 | 5.44 | −38, 20, −10 | 5.18 | −39, 17, −13 | 6.92 |
| R dorsal anterior insula | NA | 39, 23, 5 | 5.61 | 35, 18, 5 | 6.97 | 35, 16, 7 | 7.22 |
| L dorsal anterior insula | NA | −34, 24, 4 | 4.98 | −32, 22, 4 | 6.05 | −36, 24, 4 | 6.68 |
| R lateral orbital gyrus | 47/11 | 33, 36, −13 | 4.66 | 34, 36, −13 | 5.72 | 42, 16, −12 | 6.80 |
| L lateral orbital gyrus | 47/11 | −29, 38, −13 | 4.86 | −29, 38, −14 | 6.00 | −30, 38, −15 | 5.60 |
| R posterior insula | NA | 44, −10, −4 | 6.55 | ||||
| L posterior insula | NA | −40, −12, −2 | 5.40 | ||||
| Neocortical | |||||||
| R frontal pole | 11 | 28, 61, −15 | 5.85 | 24, 61, −13 | 4.81 | 33, 63, −6 | 6.10 |
| L frontal pole | 11 | −31, 61, −2 | 5.67 | −29, 61, −2 | 6.78 | −27, 61, −3 | 6.31 |
| R MFG, ventral | 46 | 30, 52, 18 | 5.18 | 38, 52, 6 | 5.43 | 36, 44, 28 | 5.37 |
| L MFG, ventral | 46 | −42, 52, 9 | 4.84 | −42, 53, 7 | 5.87 | −45, 53, 4 | 6.60 |
| R IFG, opercularis | 44 | 38, 14, 33 | 5.13 | 38, 15, 33 | 6.57 | 38, 13, 34 | 6.76 |
| L IFG, opercularis | 44 | −44, 13, 28 | 5.70 | −44, 11, 27 | 6.25 | −43, 10, 25 | 6.69 |
| R precentral gyrus | 4 | 47, −6, 33 | 4.97 | 47, −6, 34 | 5.25 | ||
| L STS | 21 | −53, −30, −8 | 4.82 | −54, −29, −4 | 5.51 | ||
| R IFG, triangularis | 45 | 45, 36, 17 | 4.60 | 45, 34, 20 | 5.60 | 44, 34, 24 | 4.87 |
| L IFG, triangularis | 45 | −48, 36, 26 | 4.96 | −56, 28, 18 | 6.85 | ||
| R MFG, dorsal | 9 | 26, 34, 40 | 5.55 | 30, 26, 40 | 5.92 | ||
| L MFG, dorsal | 9 | −40, 25, 46 | 4.82 | −42, 28, 45 | 5.28 | ||
| Dorsomedial SFG | 9 | 0, 36, 38 | 6.02 | 0, 36, 38 | 6.91 | ||
| L SFG | 8 | −24, 19, 47 | 4.72 | −25, 21, 47 | 5.80 | ||
| R middle temporal gyrus | 21 | 48, −18, −4 | 4.99 | 50, −18, −6 | 5.40 | ||
| L angular gyrus | 22 | −50, −51, 26 | 4.75 | ||||
| R inferior parietal lobule | 39 | 48, −59, 44 | 5.37 | ||||
| Limbic | |||||||
| R anterior hippocampus/amygdala | NA | 29, −13, −13 | 5.64 | 30, −14, −10 | 4.74 | −30, −14, −10 | 6.12 |
| L anterior hippocampus/amygdala | NA | 28, −14, −16 | 5.86 | ||||
| R posterior hippocampus | NA | 27, −26, −10 | 5.68 | ||||
| L posterior hippocampus | NA | −28, −32, −6 | 5.60 | ||||
| Subcortical | |||||||
| L caudate | NA | −7, 15, 6 | 6.15 | −8, 13, 9 | 7.23 | −10, 15, 7 | 7.88 |
| R caudate | NA | 9, 13, 9 | 6.15 | 9, 13, 9 | 6.97 | 9, 12, 7 | 7.65 |
| R putamen | NA | 30, 4, 8 | 5.51 | 27, 6, 8 | 6.57 | 29, 8, 10 | 7.27 |
| L putamen | NA | −22, 3, 6 | 5.63 | −22, 5, 4 | 6.40 | −22, 11, 4 | 7.23 |
| Medial thalamus | NA | 2, −8, 10 | 4.98 | 2, −8, 8 | 6.65 | 2, −8, 8 | 7.55 |
| R lateral cerebellum | NA | 48, −67, −48 | 4.65 | ||||
Abbreviations: ACC, anterior cingulate; bvFTD, behavioral variant frontotemporal dementia; BA, Brodmann area, CDR, Clinical Dementia Rating; IFG, inferior frontal gyrus; MFG, middle frontal gyrus; NA, not applicable; SFG, superior frontal gyrus; STS, superior temporal sulcus.
Among patients with a CDR score of 1, atrophy was more confluent, extensive, and bilateral within regions affected in very mild disease. Most of the medial frontal surface and new lateral frontal regions (Brodmann areas 9/45) were involved, and striatal-thalamic atrophy was diffuse. In the group with a CDR score of 2 to 3, nearly the entire frontal lobe was affected bilaterally, and GM loss was seen within posterior reaches of the insula, posterior hippocampi, parietal lobes, and right cerebellum. No posterior cingulate or precuneus atrophy was detected. Sparse temporal atrophy was seen across stages. Head-to-head comparisons between bvFTD groups revealed a difference only between patients with very mild and severe disease, in whom greater left caudate atrophy was seen (P<.05, whole brain corrected for familywise error).
VBM-ESTIMATED WM
Patients with bvFTD who had a CDR score of 0.5 showed minimal WM loss, with only small subfrontal and basal pontine foci detected (Figure 2). With a CDR score of 1, atrophy involved the subfrontal, parahippocampal, and midcallosal WM and extended into the cerebral peduncles and the pontine base. A CDR score of 2 to 3 showed WM loss that affected the entire corpus callosum and extensive subcortical WM reaching from subfrontal to parahippocampal and parietal areas. More severe WM loss was also seen in the midbrain and brainstem, with pontine involvement affecting the middle cerebellar peduncles (Figure 2).
Figure 2.
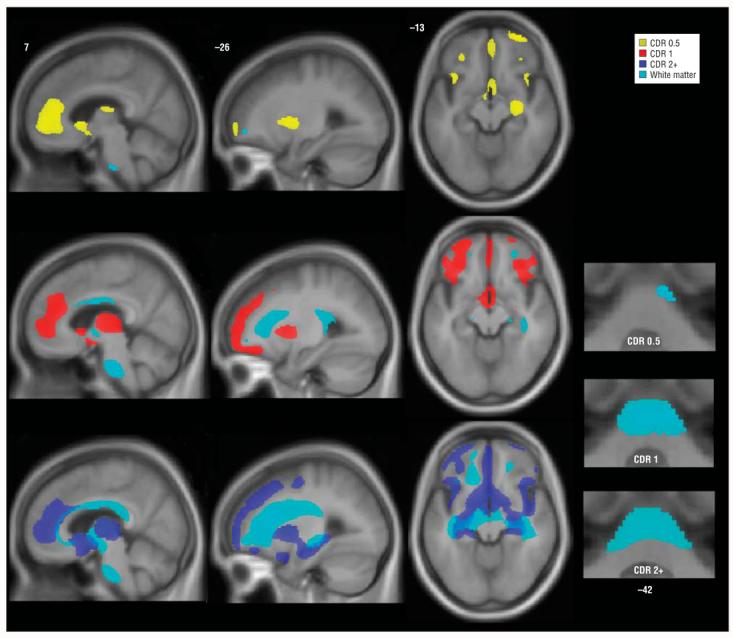
Stage-specific white matter atrophy in behavioral variant frontotemporal dementia. Areas of white matter loss are overlaid on gray matter atrophy maps for each stage. Bottom right images show basal pontine white matter loss that involves the middle cerebellar peduncles at later stages. Images are otherwise displayed as in Figure 1. Numbers indicate the MNI (Montreal Neurological Institute) coordinate of the template brain magnetic resonance image shown. CDR indicates Clinical Dementia Rating, CDR 0.5, very mild; CDR 1, mild; and CDR 2+, moderate to severe.
IMPACT OF FTD-MND ON VBM FINDINGS
Finally, to assess whether GM or WM findings in MND-relevant areas (precentral gyrus, cerebral peduncles, and pontine base) were being driven solely by patients with bvFTD-MND, we reanalyzed the main contrasts after removing the patients with MND from each group. After removing the patients with bvFTD-MND from the very mild (CDR score of 0.5) group, the right precentral gyrus no longer showed significant GM atrophy. Results from MND-relevant regions showed no other changes, at any disease stage, after this manipulation. Furthermore, extending this reanalysis to the entire brain for each group, only the left parietal region in the moderate to severe group no longer reached significance vs controls when patients with bvFTD-MND were excluded. Otherwise, the regions atrophied at each disease stage (eTable) were unchanged, although the extent (total number of contiguous, significantly atrophied voxels) was slightly reduced in some regions because of lowered statistical power.
COMMENT
To our knowledge, this is the first neuroimaging study to identify bvFTD atrophy patterns specific to clinical stage. Fifteen patients with a CDR score of 0.5 showed atrophy within a multifocal, distributed frontal insular network. In keeping with our hypotheses, this early bvFTD network featured the ACC, FI, and orbitofrontal and cingulofrontal transition zones. These areas have been highlighted in small autopsy studies16,18,21,22 of bvFTD, in which some patients died early in the illness. In addition, in very mild disease, we found atrophy in small regions of dorsolateral and polar frontal neocortex, dorsal insula, striatum, thalamus, and anterior hippocampus. In patients with a CDR score of 1, additional frontal neocortical GM regions were atrophied, whereas those with a CDR score of 2 to 3 showed atrophy in the posterior hippocampi, posterior insulae, and parietal lobes.
Why does early FTD target a focal paralimbic frontal insular circuit? Recently, we have observed that bvFTD is associated with severe, selective, and disease-specific injury to von Economo neurons (VENs), a class of large bipolar projection neurons unique to humans, great apes, and possibly selected whales.18,23,24 von Economo neurons are 30% more abundant in the right hemisphere and reside mainly in the ACC, FI, and orbitofrontal and cingulofrontal transition zones.25,26 Furthermore, we and others27,28 have shown with functional MRI that ACC and FI activity levels correlate tightly with each other in task-free settings as part of a normal human intrinsic connectivity network. This network closely mirrors the group of regions, identified in this study, that are targeted in very mild bvFTD. This group of findings suggests that early bvFTD targets a specific anterior network that may bridge limbic, paralimbic, and neocortical centers and integrate them through the caudate and thalamus. von Economo neurons are a distinguishing feature at the core of this network and may support human social cognition,18,25 but further studies are needed to determine if and how VENs render the FTD network vulnerable.
Previous imaging and pathologic studies of more advanced or mixed bvFTD stages suggest that, with time, the disease encompasses most of the frontal lobe2,6,8,9,13,16 and may spread to posterior neocortex.22,29,30 A positron emission tomography study29 found diffuse frontal and insular hypometabolism in patients with CDR scores of 0.5 to 1 that progressed to involve lateral parietal and temporal regions 20 months later. These findings agree with stage-wise pathologic analyses16,22 and with our data. However, positron emission tomography may represent a more sensitive measure than MRI because, in contrast to the positron emission tomography study,29 we found parietal involvement only in moderate to severe bvFTD.
Both bvFTD-related WM atrophy and the timing of WM changes have received limited previous attention.31,32 We found later-stage WM contraction not only in tissue subjacent to degenerating GM but also in midbrain and pontine regions that carry dense frontal, cingulate, and insular efferent and afferent projections, a finding not attributable to MND-related degeneration alone. A recent diffusion tensor imaging study33 showed prominent superior longitudinal fasciculus involvement in bvFTD, in keeping with our findings, although the functional status of the patients was not specified. Our data suggest that early frontal GM damage induces WM degeneration, which in turn erodes GM in later-affected posterior regions.
The present study has 2 main limitations. First, no clinical staging system for bvFTD has been established. We chose the CDR because it is a widely used, validated instrument for characterizing dementia. The CDR, however, was developed for Alzheimer disease and emphasizes memory more than a bvFTD-specific staging system might. Despite this limitation, the CDR produced bvFTD groups that differed anatomically in keeping with our hypotheses. Second, although it was not a primary aim of this study, we attempted to make inferences about longitudinal change based on cross-sectional data from clinically stratified patients. Previous longitudinal studies of bvFTD were performed on relatively small sample sizes, yielding similar but less anatomically refined results.30,34,35 Consistent with our cross-sectional findings, a recent longitudinal tensor-based morphometry study36 on a subset of the patients studied herein showed cingulofrontal and frontoinsular volume loss during a 1-year interval.
In contrast to some previous reports,22,37,38 this study did not detect significant temporal polar atrophy in any disease stage. The literature, however, suggests that bvFTD often shows predominantly frontal insular degeneration,2,6,13,15 at least when it is distinguished from right hemisphere–predominant semantic dementia, in which early behavioral features result from temporal pole disease.39,40 Our clinical experience suggests that temporal atrophy, although universal in semantic dementia, occurs in only a subset of patients with bvFTD, perhaps impeding statistical detection by a technique such as VBM.
The healthy brain safeguards an anterior paralimbic frontal-subcortical network that is crucial for processing emotional salience and orchestrating visceral-autonomic responses.27,28,41,42 Early injury to this network, as demonstrated in very mild bvFTD, may strip the brain of its ability to integrate internal and external stimuli with response options to produce adaptive, context-sensitive behavior.42,43 Further insights into bvFTD pathogenesis will require careful study of the cells and regions first injured by the disease.
Acknowledgments
Funding/Support: This work was supported by a National Institute on Aging K08 award and a Larry L. Hill-blom Foundation grant to Dr Seeley, grant RO1 NS050915-01A1 from the National Institute on Neurological Disorders and Stroke to Dr Gorno-Tempini, the State of California Department of Health Services, and grants 1P01 AG19724-01A1 and P50 AG1657303-75271 from the National Institute on Aging.
Footnotes
Financial Disclosure: None reported.
Additional Information: The eTable is available at http://www.archneurol.com.
REFERENCES
- 1.Neary D, Snowden JS, Gustafson L, et al. Frontotemporal lobar degeneration: a consensus on clinical diagnostic criteria. Neurology. 1998;51(6):1546–1554. doi: 10.1212/wnl.51.6.1546. [DOI] [PubMed] [Google Scholar]
- 2.Rosen HJ, Gorno-Tempini ML, Goldman WP, et al. Patterns of brain atrophy in frontotemporal dementia and semantic dementia. Neurology. 2002;58(2):198–208. doi: 10.1212/wnl.58.2.198. [DOI] [PubMed] [Google Scholar]
- 3.Rascovsky K, Salmon DP, Lipton AM, et al. Rate of progression differs in frontotemporal dementia and Alzheimer disease. Neurology. 2005;65(3):397–403. doi: 10.1212/01.wnl.0000171343.43314.6e. [DOI] [PubMed] [Google Scholar]
- 4.Roberson ED, Hesse JH, Rose KD, et al. Frontotemporal dementia progresses to death faster than Alzheimer disease. Neurology. 2005;65(5):719–725. doi: 10.1212/01.wnl.0000173837.82820.9f. [DOI] [PubMed] [Google Scholar]
- 5.Hodges JR, Davies R, Xuereb J, Kril J, Halliday G. Survival in frontotemporal dementia. Neurology. 2003;61(3):349–354. doi: 10.1212/01.wnl.0000078928.20107.52. [DOI] [PubMed] [Google Scholar]
- 6.Boccardi M, Sabattoli F, Laakso MP, et al. Frontotemporal dementia as a neural system disease. Neurobiol Aging. 2005;26(1):37–44. doi: 10.1016/j.neurobiolaging.2004.02.019. [DOI] [PubMed] [Google Scholar]
- 7.Whitwell JL, Jack CR, Jr, Senjem ML, Josephs KA. Patterns of atrophy in pathologically confirmed FTLD with and without motor neuron degeneration. Neurology. 2006;66(1):102–104. doi: 10.1212/01.wnl.0000191395.69438.12. [DOI] [PMC free article] [PubMed] [Google Scholar]
- 8.Ibach B, Poljansky S, Marienhagen J, Sommer M, Manner P, Hajak G. Contrasting metabolic impairment in frontotemporal degeneration and early onset Alzheimer's disease. Neuroimage. 2004;23(2):739–743. doi: 10.1016/j.neuroimage.2004.06.041. [DOI] [PubMed] [Google Scholar]
- 9.Varrone A, Pappata S, Caraco C, et al. Voxel-based comparison of rCBF SPET images in frontotemporal dementia and Alzheimer's disease highlights the involvement of different cortical networks. Eur J Nucl Med Mol Imaging. 2002;29(11):1447–1454. doi: 10.1007/s00259-002-0883-5. [DOI] [PubMed] [Google Scholar]
- 10.Hyman BT, Damasio AR. Hierarchical vulnerability of the entorhinal cortex and the hippocampal formation to Alzheimer neuropathological changes: a semi-quantitative study. Neurology. 1990;40:403. [Google Scholar]
- 11.Perry RJ, Graham A, Williams G, et al. Patterns of frontal lobe atrophy in frontotemporal dementia: a volumetric MRI study. Dement Geriatr Cogn Disord. 2006;22(4):278–287. doi: 10.1159/000095128. [DOI] [PubMed] [Google Scholar]
- 12.Davies RR, Kipps CM, Mitchell J, Kril JJ, Halliday GM, Hodges JR. Progression in frontotemporal dementia: identifying a benign behavioral variant by magnetic resonance imaging. Arch Neurol. 2006;63(11):1627–1631. doi: 10.1001/archneur.63.11.1627. [DOI] [PubMed] [Google Scholar]
- 13.Ishii K, Sakamoto S, Sasaki M, et al. Cerebral glucose metabolism in patients with frontotemporal dementia. J Nucl Med. 1998;39(11):1875–1878. [PubMed] [Google Scholar]
- 14.Franceschi M, Anchisi D, Pelati O, et al. Glucose metabolism and serotonin receptors in the frontotemporal lobe degeneration. Ann Neurol. 2005;57(2):216–225. doi: 10.1002/ana.20365. [DOI] [PubMed] [Google Scholar]
- 15.Schroeter ML, Raczka K, Neumann J, von Cramon DY. Neural networks in frontotemporal dementia: a meta-analysis [published online ahead of print, November 29, 2006] Neurobiol Aging. doi: 10.1016/j.neurobiolaging.2006.10.023. doi: 10.1016/j.neurobiolaging.2006.10.023.17140704. [DOI] [PubMed] [Google Scholar]
- 16.Broe M, Hodges JR, Schofield E, Shepherd CE, Kril JJ, Halliday GM. Staging disease severity in pathologically confirmed cases of frontotemporal dementia. Neurology. 2003;60(6):1005–1011. doi: 10.1212/01.wnl.0000052685.09194.39. [DOI] [PubMed] [Google Scholar]
- 17.Alberici A, Gobbo C, Panzacchi A, et al. Frontotemporal dementia: impact of P301L tau mutation on a healthy carrier. J Neurol Neurosurg Psychiatry. 2004;75(11):1607–1610. doi: 10.1136/jnnp.2003.021295. [DOI] [PMC free article] [PubMed] [Google Scholar]
- 18.Seeley WW, Carlin DA, Allman JM, et al. Early frontotemporal dementia targets neurons unique to apes and humans. Ann Neurol. 2006;60(6):660–667. doi: 10.1002/ana.21055. [DOI] [PubMed] [Google Scholar]
- 19.Morris JC. The Clinical Dementia Rating (CDR): current version and scoring rules. Neurology. 1993;43(11):2412–2414. doi: 10.1212/wnl.43.11.2412-a. [DOI] [PubMed] [Google Scholar]
- 20.Good CD, Johnsrude IS, Ashburner J, Henson RN, Friston KJ, Frackowiak RS. A voxel-based morphometric study of ageing in 465 normal adult human brains. Neuroimage. 2001;14(1 pt 1):21–36. doi: 10.1006/nimg.2001.0786. [DOI] [PubMed] [Google Scholar]
- 21.Brun A, Gustafson L. Limbic lobe involvement in presenile dementia. Arch Psychiatr Nervenkr. 1978;226(2):79–93. doi: 10.1007/BF00345945. [DOI] [PubMed] [Google Scholar]
- 22.Kril JJ, Macdonald V, Patel S, Png F, Halliday GM. Distribution of brain atrophy in behavioral variant frontotemporal dementia. J Neurol Sci. 2005;232(12):83–90. doi: 10.1016/j.jns.2005.02.003. [DOI] [PubMed] [Google Scholar]
- 23.Nimchinsky EA, Gilissen E, Allman JM, Perl DP, Erwin JM, Hof PR. A neuronal morphologic type unique to humans and great apes. Proc Natl Acad Sci U S A. 1999;96(9):5268–5273. doi: 10.1073/pnas.96.9.5268. [DOI] [PMC free article] [PubMed] [Google Scholar]
- 24.Hof PR, Van Der Gucht E. Structure of the cerebral cortex of the humpback whale, Megaptera novaeangliae (Cetacea, Mysticeti, Balaenopteridae) [published online ahead of print, November 27, 2006] Anat Rec A Discov Mol Cell Evol Biol. doi: 10.1002/ar.20407. [DOI] [PubMed] [Google Scholar]
- 25.Allman JM, Watson KK, Tetreault NA, Hakeem AY. Intuition and autism: a possible role for von Economo neurons. Trends Cogn Sci. 2005;9(8):367–373. doi: 10.1016/j.tics.2005.06.008. [DOI] [PubMed] [Google Scholar]
- 26.von Economo C. Eine neue Art Spezialzellen des Lobus cinguli und Lobus insulae. Z Ges Neurol Psychiatr. 1926;100:706–712. [Google Scholar]
- 27.Beckmann CF, DeLuca M, Devlin JT, Smith SM. Investigations into resting-state connectivity using independent component analysis. Philos Trans R Soc Lond B Biol Sci. 2005;360(1457):1001–1013. doi: 10.1098/rstb.2005.1634. [DOI] [PMC free article] [PubMed] [Google Scholar]
- 28.Seeley WW, Menon V, Schatzberg AF, et al. Dissociable intrinsic connectivity networks for salience processing and executive control. J Neurosci. 2007;27(9):2349–2356. doi: 10.1523/JNEUROSCI.5587-06.2007. [DOI] [PMC free article] [PubMed] [Google Scholar]
- 29.Diehl-Schmid J, Grimmer T, Drzezga A, et al. Decline of cerebral glucose metabolism in frontotemporal dementia: a longitudinal 18F-FDG-PET-study. Neurobiol Aging. 2007;28(1):48–50. doi: 10.1016/j.neurobiolaging.2005.11.002. [DOI] [PubMed] [Google Scholar]
- 30.Chan D, Fox NC, Jenkins R, Scahill RI, Crum WR, Rossor MN. Rates of global and regional cerebral atrophy in AD and frontotemporal dementia. Neurology. 2001;57(10):1756–1763. doi: 10.1212/wnl.57.10.1756. [DOI] [PubMed] [Google Scholar]
- 31.Kitagaki H, Mori E, Hirono N, et al. Alteration of white matter MR signal intensity in frontotemporal dementia. AJNR Am J Neuroradiol. 1997;18(2):367–378. [PMC free article] [PubMed] [Google Scholar]
- 32.Yoshiura T, Mihara F, Koga H, et al. Cerebral white matter degeneration in frontotemporal dementia detected by diffusion-weighted magnetic resonance imaging. Acad Radiol. 2006;13(11):1373–1378. doi: 10.1016/j.acra.2006.08.009. [DOI] [PubMed] [Google Scholar]
- 33.Borroni B, Brambati SM, Agosti C, et al. Evidence of white matter changes on diffusion tensor imaging in frontotemporal dementia. Arch Neurol. 2007;64(2):246–251. doi: 10.1001/archneur.64.2.246. [DOI] [PubMed] [Google Scholar]
- 34.Whitwell JL, Anderson VM, Scahill RI, Rossor MN, Fox NC. Longitudinal patterns of regional change on volumetric MRI in frontotemporal lobar degeneration. Dement Geriatr Cogn Disord. 2004;17(4):307–310. doi: 10.1159/000077160. [DOI] [PubMed] [Google Scholar]
- 35.Avants B, Grossman M, Gee JC. The correlation of cognitive decline with frontotemporal dementia induced annualized gray matter loss using diffeomorphic morphometry. Alzheimer Dis Assoc Disord. 2005;19(suppl 1):S25–S28. doi: 10.1097/01.wad.0000183083.14939.82. [DOI] [PubMed] [Google Scholar]
- 36.Brambati SM, Renda NC, Rankin KP, et al. A tensor based morphometry study of longitudinal gray matter contraction in FTD. Neuroimage. 2007;35(3):998–1003. doi: 10.1016/j.neuroimage.2007.01.028. [DOI] [PMC free article] [PubMed] [Google Scholar]
- 37.Bocti C, Rockel C, Roy P, Gao F, Black SE. Topographical patterns of lobar atrophy in frontotemporal dementia and Alzheimer's disease. Dement Geriatr Cogn Disord. 2006;21(56):364–372. doi: 10.1159/000091838. [DOI] [PubMed] [Google Scholar]
- 38.Galton CJ, Gomez-Anson B, Antoun N, et al. Temporal lobe rating scale: application to Alzheimer's disease and frontotemporal dementia. J Neurol Neurosurg Psychiatry. 2001;70(2):165–173. doi: 10.1136/jnnp.70.2.165. [DOI] [PMC free article] [PubMed] [Google Scholar]
- 39.Seeley WW, Bauer AM, Miller BL, et al. The natural history of temporal variant frontotemporal dementia. Neurology. 2005;64(8):1384–1390. doi: 10.1212/01.WNL.0000158425.46019.5C. [DOI] [PMC free article] [PubMed] [Google Scholar]
- 40.Thompson SA, Patterson K, Hodges JR. Left/right asymmetry of atrophy in semantic dementia: behavioral-cognitive implications. Neurology. 2003;61(9):1196–1203. doi: 10.1212/01.wnl.0000091868.28557.b8. [DOI] [PubMed] [Google Scholar]
- 41.Mesulam MM, Mufson EJ. Insula of the old world monkey, III: Efferent cortical output and comments on function. J Comp Neurol. 1982;212(1):38–52. doi: 10.1002/cne.902120104. [DOI] [PubMed] [Google Scholar]
- 42.Critchley HD. Neural mechanisms of autonomic, affective, and cognitive integration. J Comp Neurol. 2005;493(1):154–166. doi: 10.1002/cne.20749. [DOI] [PubMed] [Google Scholar]
- 43.MacDonald AW, III, Cohen JD, Stenger VA, Carter CS. Dissociating the role of the dorsolateral prefrontal and anterior cingulate cortex in cognitive control. Science. 2000;288(5472):1835–1838. doi: 10.1126/science.288.5472.1835. [DOI] [PubMed] [Google Scholar]