

Abstract
The nicotinic acetylcholine receptor is a prototype ligand-gated ion channel that mediates signal transduction in the neuromuscular junctions and other cholinergic synapses. The molecular basis for the energetics of ligand binding and unbinding is critical to our understanding of the pharmacology of this class of receptors. Here we used steered molecular dynamics to investigate the unbinding of acetylcholine from the ligand-binding domain of human alpha7 nicotinic acetylcholine receptor along four different predetermined pathways. Pulling forces were found to correlate well with interactions between acetylcholine and residues in the binding site during the unbinding process. From multiple trajectories along these unbinding pathways, we calculated the potentials of mean force for acetylcholine unbinding. Four available methods based on Jarzynski's equality were used and compared for their efficiencies. The most probable pathway was identified to be along a direction approximately parallel to the membrane. The derived binding energy for acetylcholine was in good agreement with that derived from the experimental binding constant for acetylcholine binding protein, but significantly higher than that for the complete human alpha7 nicotinic acetylcholine receptor. In addition, it is likely that several intermediate states exist along the unbinding pathways.
Introduction
Nicotinic acetylcholine receptors (nAChRs) are pentameric transmembrane proteins belonging to the “cys-loop” superfamily of ligand-gated ion channels that also includes 5HT3, GABAA, GABAC, and glycine receptors 1-3. These ion channels mediate intercellular communication by converting the neurotransmitter signal released from the nerve ending into a transmembrane ion flux in the postsynaptic neuron or muscle fiber. The pentameric nAChR can be composed of either identical (homo-pentamer) or different (hetero-pentamer) subunits. In vertebrates, the combinatorial assembly of various homologous subunits (α1-10, β1-4, γ, δ, ε) generates a wide diversity of nAChRs with various electrical and binding properties 4. The presence of nicotinic ligands, agonists, or competitive antagonists, and also of noncompetitive allosteric factors, can alter the equilibrium between different conformational states, which are basal or resting (closed), active (open), and desensitized (closed) 5.
Because of their functional importance and their implication in numerous pathologies, the nAChRs have been subject to thorough investigations 6. Two decades of biochemical studies have revealed many important structural features of nAChRs. Recently some breakthroughs in structural studies have greatly increased our understanding of the three dimensional structure of nAChR. These include the crystal structures of acetylcholine binding protein (AChBP) 7-10 and the high-resolution cryo-electron microscopy (EM) image of nAChR from Torpedo electric organ 11,12. AChBP is a soluble homo-pentameric homolog of the amino terminal extracellular domain of nAChR, which is also called the ligand-binding domain (LBD). Using these structures, the three-dimensional atomic structure of different nAChRs can be predicted with homology modeling 13-15. AChBP has the highest identity rate (23%) with the human α7 type neuronal nAChR (hα7-nAChR), also a homo-pentamer, among known nAChRs16. To study ligand unbinding, we need the structure of nAChR in the active state with ligand bound. However, such a structure for nAChR from Torpedo is currently limited to 9 Å in resolution17, not suitable for simulation at the atomic level. Therefore we used a homology model of the LBD of hα7-nAChR as the starting model in this study.
The interplay between different states modulated by ligand binding is a complicated process. The following simple kinetic scheme describes the binding and channel gating5:
| (1) |
where C is the closed, unliganded receptor; A is the agonist ligand; CA and CA2 are singly- and doubly-liganded closed receptor; and OA2 is the doubly-liganded, open receptor.
From kinetic analysis of ligand binding and channel gating measured by single channel electrophysiological techniques, it is possible to characterize the thermodynamic properties of these individual states18. Over the last twenty years, numerous such studies have been done. With the structure becoming available for nAChR, it is also feasible to investigate the structural changes upon ligand binding/unbinding. The binding and unbinding event happens on the millisecond or longer time scale 18,19, and it is out of the reach for the normal molecular dynamics technique. Here we used steered molecular dynamics (SMD) 20,21 to investigate the energetics of ACh unbinding from the LBD of hα7-nAChR along four different pre-determined low-energy pathways. The force profile was found to correlate well with the breakup of interactions between ACh and residues in the binding site. Using four available methods based on Jarzynski's equality, we calculated the potentials of mean force (PMF) from a large number of unbinding SMD trajectories along these pathways. The efficiencies of these methods were compared. Based on the calculated binding affinity, the most probable unbinding pathway was determined to be along a direction approximately parallel to the membrane. The binding energy obtained from the PMF is in excellent agreement with the experimentally measured value for AChBP, the structure and functional homolog of the LBD of hα7-nAChR. We also tried to identify intermediate states along the unbinding pathways.
Methods and Model
Structure Preparation
The three-dimensional structure of the LBD of hα7-nAChR was built from homology modeling using an AChBP crystal structure (PDB ID: 1I9B) as a template13. The procedure has been described in detail before, and the same model has been used to gain insight about the dynamic properties of the LBD of hα7-nAChR22-24. The protonation states of all titratable residues and orientation of Asn and Gln residues were determined using WHAT IF 25 to optimize the hydrogen bond network. Standard protonation states including neutral His were assigned for all residues in all proteins. His 114 was protonated at delta-N, and His 62, 104 and 140 were protonated at epsilon-N. No calcium ion was included in the structure. In a complete structure of hα7-nAChR, the LBD is covalently connected to the transmembrane domain of the receptor. Hence the C-terminal of the LBD was acetylated to neutralize the terminal charge in order to avoid the repulsion between these artificial negative charges.
The structure of ACh was built using Sybyl (Tripos Inc., St. Louis, MO). Mullikan charges were calculated at the Hartree-Fock level with the 6-31G** basis set using Gaussian (Gaussian Inc., Pittsburgh, PA). ACh was parameterized according to the rules for the CHARMM27 force field 26. Missing bond, angle, dihedral parameters were estimated from similar terms within the force field. The charges and parameters are available as supporting information.
Autodock 3.027 was used in determining the binding mode of ACh in each of the five binding sites of the LBD of hα7-nAChR. For each binding site, a potential grid of 60×60×60 with a 0.2 Å grid spacing was generated for each element type in ACh. The grid center was set at the geometric center of the alpha-carbon atoms of the following five residues: C190, W148, Y187, Y194 and W54′ from the complementary subunit. These residues have long been known to form the binding site for ACh from biochemical studies 28,29, and their corresponding residues form the binding site for various ligands in the AChBP crystal structure 7,8. Distance dependent dielectric constant was used to mimic the solvation effect in scoring docked conformations. The hybrid genetic algorithm-local search method was used in finding the correct binding conformation for ACh. The docked structure was then further optimized with energy minimization and molecular dynamics after solvation as described below.
The LBD of hα7-nAChR structure with ACh bound in each of the five binding sites was solvated in explicit water in two steps. A 4 Å solvation shell was added using Solvate 1.0 (http://www.mpibpc.gwdg.de/abteilungen/071/solvate/docu.html) in the first step. In the second step the tleap module in Amber 7 was used to add 74 Na+ and 59 Cl-, and more water was added to form a cubic simulation box with edges of 114.5 Å. The total number of water molecules added in the two steps was 40075. The ion concentration was about 0.15 M for Na+ and 0.11 M for Cl-. The density of the system was 0.875 g/cm3 initially. The solvated system has 137470 atoms in total.
Steered Molecular Dynamics
The energy minimization and molecular dynamics were run using the CHARMM27 force field 26 and NAMD 2.5 30. The system was first energy minimized for 1000 steps using the conjugate gradient method, and subsequently heated up from 0.01 K to 310 K in six stages of 20 ps each (0.01 K, 50 K, 75 K, 120 K, 180 K and 310 K). Heavy atoms were initially restrained with a 20 kcal/mol/Å2 spring constant, and switched to 10 and 5 kcal/mol/Å2 during 50 K and 75 K. Only alpha-carbon atoms were restrained using a 5 kcal/mol/Å2 spring constant at 120 K, and the restraint was further decreased to 2 kcal/mol/Å2, finally completely removed at the last step. Temperature was controlled by Langevin dynamics. Particle Mesh Ewald (PME) method was used with a cutoff distance of 12 Å to sum up long-range interactions. Full electrostatic interaction was calculated every 4 steps. Use of SHAKE (rigid bonds) on all hydrogen-containing bonds allowed a 2 fs integration step to be used. Verlet-I (r-RESPA) multiple time step scheme was applied. Constant volume was maintained in these equilibration steps. The system was subsequently switched to constant pressure/constant temperature (NPT) after the temperature was stabilized at 310 K. The NPT condition was controlled with a combination of a modified Nose-Hoover pressure control and Langevin dynamics. The pressure was set at 1 bar. The system was equilibrated for 100 ps in NPT condition, and the final state was saved as a restart point for further SMD study. Benchmark showed that it took 27 hours to run 1 ns MD parallel with a 2 fs time step using 32 Intel Xeon 2.8 GHz processors in a Linux cluster.
In the production stage external steering forces were applied to pull the ACh ligand out of its binding site. Constant velocity pulling was applied to the ACh ligand in one of the binding sites of the LBD of hα7-nAChR along four different directions pre-determined by visualization. Figure 1 illustrates the pulling directions for the four unbinding pathways. In our current study, the pulling velocity was set at 0.00004 Å per time step (2 fs), or 20 Å/ns. The pulling velocity was considerably slower than those used in some previous SMD studies, such as the unbinding of retinoic acid from its receptor31 and the unbinding of avidin-biotin complex20, etc. As a result, the perturbation by the pulling force is reduced compared to the thermal fluctuation of the ligand in the binding site. We have also tried different pulling velocities, and this velocity seemed to give the best balance between better sampling and shorter simulation time as required for the PMF calculation32,33. A spring constant of 5 kcal/mol/Å2 was used to constrain ACh and it was large enough to allow us to use the stiff spring approximation31,33. For pathway 1 to 3, the C atom in the carbonyl group of ACh was pulled, while the N atom in the quaternary ammonium was tagged for pathway 4. This was done to allow ACh to better adjust to the new conformation after each pulling step. During the SMD, the force was only applied along the pulling direction. ACh was free from constraint in the plane perpendicular to the pulling direction. The trajectories were saved for every 10 ps, and steering forces were recorded every 1 ps.
Fig. 1.
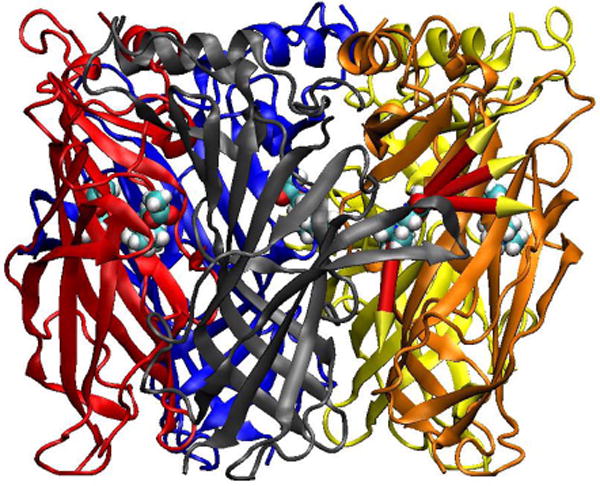
The four pathways along which ACh was pulled out of the binding site were illustrated by arrows. The pathways were numbered from top to bottom.
Construction of PMF from SMD trajectories
Currently there are a number of methods available to construct the PMF from SMD simulations34,35. We compared four different methods here, which were all based on Jarzynski's equality. In these methods, it is not required to know the friction coefficient during the PMF reconstruction. Here the reaction coordinate was the distance that ACh was pulled from its binding site. Because the drifting of the protein during the pulling process would change the distance between ACh and the binding site, some atoms needed to be fixed. By analyzing the structural fluctuation during ACh unbinding in a SMD simulation with no fixed atoms (protein drifting was subtracted in analysis), V109 was found to have the smallest root-mean-square (RMS) fluctuation. Hence the alpha-carbon atoms of V109 for each subunit were set as fixed atoms during these SMD runs. Each trajectory along the four unbinding pathways was repeated for a number of times (30 for path 1, 22 for path 2, 45 for path 3 and 24 for path 4). It has been demonstrated that the PMF is more accurate from fewer slower pulling trajectories32,33. The pulling velocity of 20 Å/ns is sufficiently slow to produce good statistics from the number of trajectories we used here.
The pulling force F at time t was calculated using the following equation:
| (2) |
where k is the spring constant of the constraint, v is the pulling velocity, n is the pulling direction normal, r(t) and r0 are the positions of ACh at time t and initial time, respectively.
The external work was calculated by integrating the force over the pulled distance from SMD trajectories:
| (3) |
Jarzynski's equality was used to derive the PMF or free energy difference from the work W as follows 33,36
| (4) |
where R is the universal gas constant, and T is the absolute temperature. It has been shown previously that the work distribution from over-damped Langevin dynamics satisfies a Gaussian distribution, and therefore the above equation can be simplified with the second-order cumulant expansion33:
| (5) |
where 〈W〉 is the mean work averaged from all trajectories, and σW is the standard deviation of the work distribution. Equation 5 has previously been derived from the fluctuation-dissipation relation for near equilibrium processes37-39.
Recently two extrapolation methods have been developed by Zuckerman and coworkers to improve the efficiency of free energy estimation with limited number of work values40. Both methods make use of block-averaged free energy, i.e., calculated from subsets from all available data using Jarzynski's equality. The linear extrapolation method simply estimates free energy by extrapolate the number of work value to infinity based on the monotonic change of free energy versus number of data. In the cumulative integral (CI) extrapolation method, an integral is defined to take into consideration of more accurate estimates of free energy. The CI method has been shown to reduce the required data by 5 to 40 fold40.
Here we compare all four available methods in our PMF calculation. Because the system is significantly larger than previously studied in those methods, these methods may perform differently. For the linear extrapolation and CI extrapolation methods, scripts from the authors' website (http://www.ccbb.pitt.edu/Professor_Websites/Zuckerman/Software.htm) were used in the analysis.
Results
Docking ACh to the LBD of hα7-nAChR
ACh was docked to each of the five binding sites of the LBD of hα7-nAChR using Autodock. The structure of the LBD of hα7-nAChR with ACh bound in each of the five binding sites was then subject to further optimization using energy minimization and molecular dynamics. In the optimized structure, the quaternary ammonium of ACh is buried in a set of aromatic groups, including the side chains of Y92, W148, Y187, Y194 in the principal subunit and W54′ from complementary subunit. C189 and C190 also make contact with the quaternary ammonium group. There is currently no crystal structure of nAChR or AChBP complexed with ACh. However, a crystal structure of AChBP complexed with carbamylcholine (CCh), a close analog of ACh (with the methyl group of the aceto moiety replaced by an amino group), was available8. Figure 2 shows the conformation of ACh compared with the CCh ligand from AChBP crystal structure (PDB 1UV6). Only the binding site residues (C189, C190, W54′, W148, Y92, Y187, Y194) were used in matching AChBP to the LBD of hα7-nAChR. The root-mean-square deviation (rmsd) between ACh and CCh except the methyl/amino group was about 0.85 Å to 1.06 Å for the five different binding sites. Although both CCh and ACh seem to fit quite well in the binding sites, the binding mode might be slightly different. For example, the angle between the three-fold rotation axis of the quaternary ammonium and the channel direction is measured to be 14.5° in CCh bound in AChBP, and about 45.0° in ACh docked to the LBD of hα7-nAChR. The same angle was 42° in ACh bound in Torpedo nAChR as measured by solid-state NMR41. The major difference is seen in the acetyl group end of ACh. The methyl group of the acetyl end of ACh sits in a hydrophobic pocket formed by side chains of L108, L118, and also the β-CH2 of Q116 side chain. In AChBP from L. stagnalis, these residues are mutated to hydrophilic residues and no such hydrophobic pocket exists for the methyl group of ACh. The binding affinity of ACh for AChBP from L. stagnalis is about 5 times lower than for AChBP from B. truncatus8,10, in which these hydrophobic residues are conserved compared to hα7-nAChR. This is in good agreement with the suggestion that a buried methyl group provides about 1 kcal/mol binding affinity42. When these residues in AChBP from L. stagnalis are mutated to their counterparts in AChBP from B. truncatus, the affinity mimics the B. truncatus protein10. Although initially not present, the OH group of the Y194 side chain formed a hydrogen bond with the carbonyl oxygen atom of ACh in two of the five binding sites after optimization by molecular dynamics. Mutagenesis studies showed that this is one of the most important residues for ACh binding, as the affinity for ACh decreased 140 times when it was mutated to a Phe43.
Fig. 2.
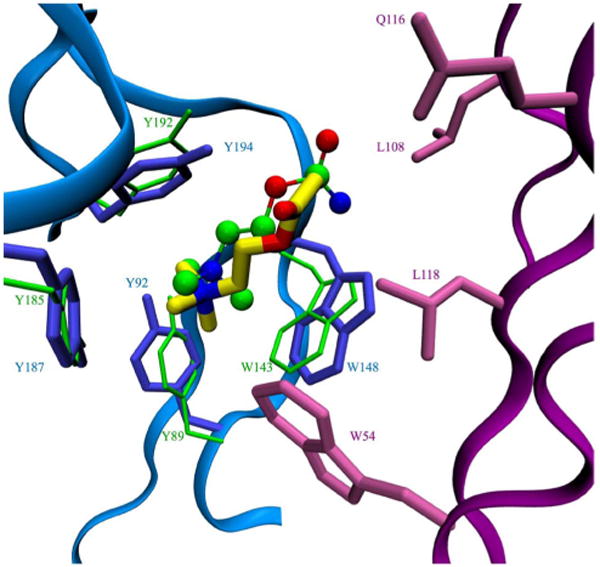
Structural conservation of the ACh binding pocket. Conformation of docked ACh (yellow licorice) is compared with that of CCh (ball-and-stick model) in the crystal structure of AChBP. Residues from the principal subunit (blue) and the complementary subunit (purple) forming the ACh binding pocket in hα7-nAChR are shown together with the homologous aromatic residues from the crystal structure of CCh bound to AChBP (green). C189 and C190 are not shown here for clarity.
SMD
Fig. 3 shows typical force profiles for pulling ACh along the four different pathways. The forces fluctuate to both positive and negative values, indicating that the thermal fluctuation of ACh is larger than the perturbation from the pulling force. The unbinding process is therefore near equilibrium. Based on the magnitude of force peaks for the four pathways, it appears that pathway 3 is smoother than the other three pathways. This can be confirmed by inspecting the structural changes during the unbinding.
Fig. 3.
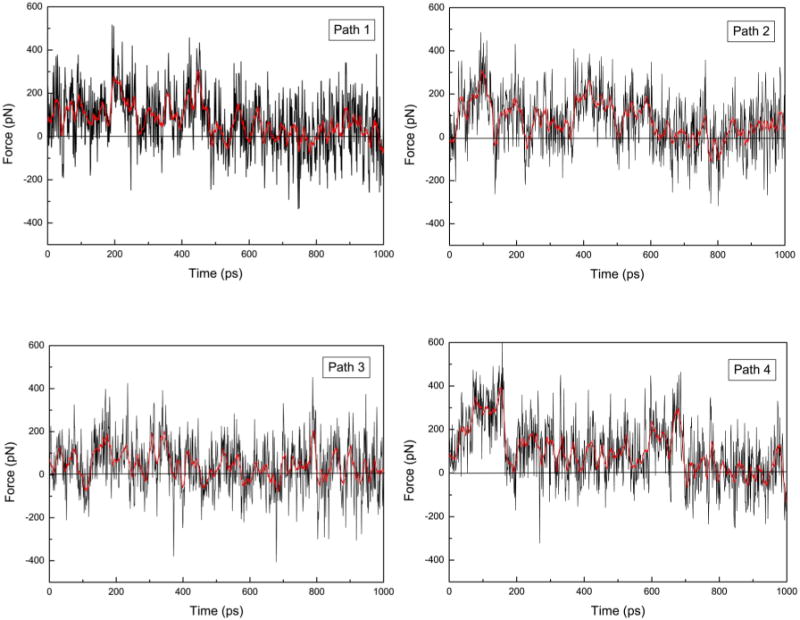
The force profiles in pulling ACh from its binding site in hα7 through four different pathways. The thick red curves represents the moving averages (using 15 points).
Along pathway 1, the residues in the binding site altered their interactions with ACh throughout the unbinding process. The first residue to shift its position was W54′ from the complementary subunit. The distance from the nitrogen atom of ACh to the CZ2 atom in W54′ increased about 5 Å in the first 200 ps. The binding site was partially exposed to solvent at the position originally occupied by W54′. Y92 started to leave the binding site at a later stage. The methyl group of the acetyl end was also pulled out of its hydrophobic pocket during the first 200 ps. As a result, several contributions were mixed together in the force profile. The force peak from 200 ps to 250 ps was mainly due to the breakup of the interaction between Y187 and the quaternary ammonium of ACh. The change was abrupt, leading to a rather sharp peak in the force profile. From 280 ps to 500 ps, ACh continued to exit from the binding site by pushing the C loop outward. During this period W148 gradually stopped making contact with ACh. Although the peaks were not as sharp, the total work contribution was greater, indicating the strong interaction between W148 and ACh. By 600 ps, ACh was completely out of the binding site. The binding site was visibly larger because of the push by the bulky choline group of ACh.
The unbinding processes along pathways 2 and 3 were similar to those of pathway 1. However, the degrees of openness of the C loop were different among the three pathways (Fig. 4). Along pathway 1, the narrowest part was formed by C189 and C190 in the C loop, T76′ in β3 and N110′ in β5 of the complementary subunit. For pathway 2, this includes C189, C190, N110′ and also H114′ and Q116′. Significant clashes between ACh and these residues, especially N110′, were seen during the unbinding along both pathway 1 and 2. In pathway 3, N110′ was not part of the bottleneck, and it seemed to allow ACh to exit without extended opening of the C loop (Fig. 4).
Fig. 4.

The positions of the C loop before (blue) and after ACh unbinding along four different pathways (red: path 1; brown: path 2; green: path3, orange: path 4). ACh is shown in ball model as in the initial bound position.
Unbinding pathway 4 was very different from the other three pathways. ACh exits from the binding site toward the membrane. In this pathwayY92 and W54′ are both located on the unbinding path directly. The initial force peak at 0 to 200 ps in Figure 3(d) primarily involves clashes between ACh and the side chains of these two residues. The C loop opened significantly during this period, leading to expansion of the binding site toward the membrane side (Fig. 4). The interactions between ACh and all the residues in the binding site were weakened due to the expansion of the binding site. After the opening of the C loop, the unbinding of ACh became relatively smooth, though there were interactions with other residues on the path.
Among the four unbinding pathways, pathway 4 seems to involve the strongest clashes between ACh and binding site residues, while pathway 3 has the least. It is therefore reasonable to assume that pathway 3 is the most probable unbinding path for ACh. However, this conclusion is only tentative because stochastic forces are involved in Langevin dynamics simulation.
PMF Along Unbinding Pathways
Jarzynski's equality in Equation 4 relates free energy to the work distribution from a series of non-equilibrium processes between two states. The unbinding of ACh from the LBD of hα7-nAChR by SMD is a non-equilibrium process. By sampling the external work from repeated trajectories (30 for pathway 1, 22 for pathway 2, 45 for pathway 3, and 24 for pathway 4), we calculated the PMF for ACh unbinding along each pathway using Jarzynski's equality.
However, direct use of Jarzynski's equality requires the deviation of the work distribution within a few kT. Generally this is not true for large biomolecule systems, as can be seen from the histograms of work distribution from SMD along pathway 3 (Fig. 5a). The standard deviation grows with farther ACh leaving the binding site. In this case, the free energy estimated from Jarzynski's equality will be dominated by smaller work values. To solve this problem, the second cumulant expansion method32,33 and two extrapolation methods40 were developed to improve the statistics of work distribution from limited sampling. Figure 5b shows the results of PMF along pathway 3 calculated using Jarzynski's equality and these three derivative methods. It appears that the second cumulant expansion method gives very different result from Jarzynski's equality. The reason might be from the assumption that the work distribution has to satisfy the Gaussian distribution for the second cumulant expansion method33. In Figure 5a, not only the standard deviation of the work distribution grows with increasing distance of ACh unbinding, the skewness also grows from 0.04 (at 2 Å) to 0.22 (at 5 Å), −0.27 (at 10 Å) and −0.39 (at 20 Å). The two (linear and CI) extrapolation methods behave similarly, and the PMF levels off when ACh is completely out of the binding site at about 10 Å compared to using Jarzynski's equality directly. However, the downside for these extrapolation methods is that the PMF is more rugged compared with the direct method. Because the CI extrapolation method has been shown to get good estimate of free energy using 5 to 40 fold less work distribution data40, we applied this method on all four different unbinding pathways.
Fig. 5.

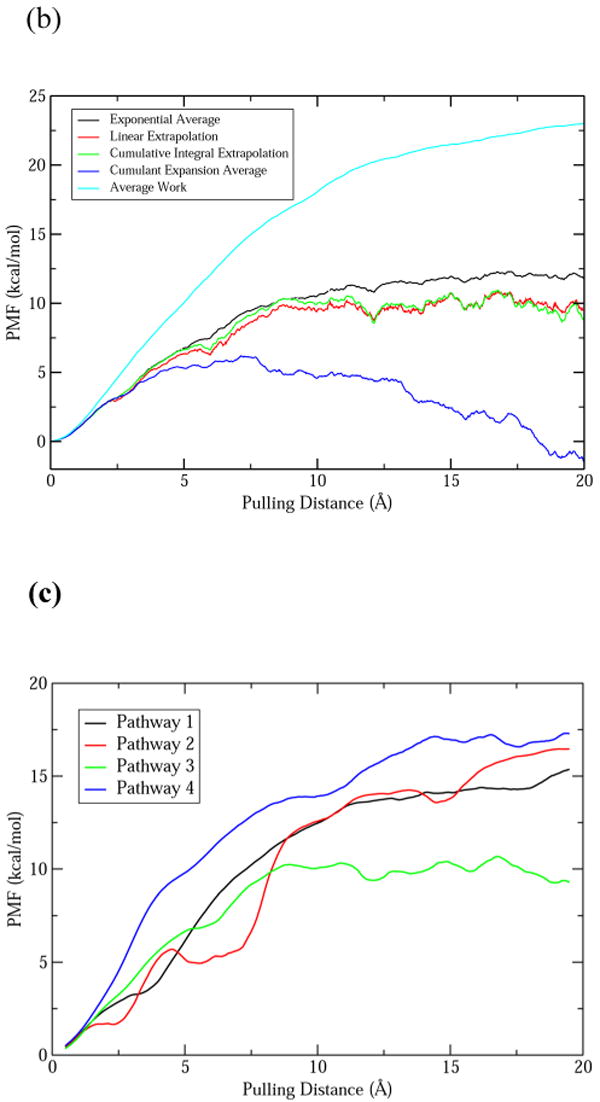
(a) The histograms of work distribution for four positions along unbinding pathway 3 (red: 2 Å; green: 5 Å; blue: 10 Å; cyan: 20 Å). The histograms were fitted to Gaussian distributions. (b) The PMF profiles for unbinding pathway 3 calculated by using Jarzynski's equality directly (black), the second cumulant expansion method (blue), linear (red) and CI (green) extrapolation methods. The average work is shown in cyan. (c) The PMF of ACh unbinding along four different pathways (1-black, 2-red, 3-green, 4-blue) calculated by using the CI extrapolation method. A 25-point moving average was applied to smooth the PMF.
Figure 5c shows the PMF for ACh unbinding along the four pathways calculated using the CI extrapolation method. A 25-point moving average was applied to make the PMF smooth. The PMF along pathway 4 shows a steep increase in the first 5 Å of pulling. Upon examining the structural changes during ACh unbinding, it was found that the clash between ACh and Y92 and W54′ caused the C loop to open greatly to allow ACh to exit through this path. In other words, the deformation energy of the protein was relatively high due to the unbinding-induced structural change. Therefore, pathway 4 is less likely a path for ACh to unbind from the LBD of hα7-nAChR. The same can be said for pathways 1 and 2. However, the steep increase in PMF came later for these two pathways. That is because the residues forming the constricting bottleneck along pathway 1 and 2 are farther from the bulky choline head group compared to pathway 4.
From Figure 5c, pathway 3 appears to be the most probable path for ACh to escape from the binding site, confirming the conclusion from analysis of the force profiles and structural changes. The unbinding energy for ACh is about 9.0 kcal/mol by taking the difference of the PMF between the starting and ending state along pathway 3. This is in good agreement with the binding energy of ACh in AChBP from B. truncatus (9.3±0.5 kcal/mol at 295K)10. Considering the high homology between AChBP and the LBD of hα7-nAChR, it is not surprising that the binding energies are so close for ACh. The binding energy of ACh for a complete nAChR is about 4.2 kcal/mol lower than this value (estimated from Kd=183 μM)44,45. It is therefore evident that the LBD alone has different binding affinity for ACh than in a complete receptor.
Discussion
Although the model we used here is only the LBD of hα7-nAChR without the transmembrane domain (TMD), the SMD study gives us some insight into how an agonist interacts with the receptor at the binding site and the structural changes associated with ligand binding/unbinding. An important purpose of this study is to identify a probable path for ACh unbinding from nAChR, which can be achieved by PMF calculations. Some residues located on the probable unbinding pathway, such as Y187 and Q116′, might be good targets for further mutational studies.
Free energy is a state function; therefore all four pathways should give the same unbinding energy for ACh. The fact that the net free energy changes were different along the four pathways indicates that the states of the system are different at the end of the ACh unbinding simulations. These differences could reflect two factors: residual interactions of ACh with different parts of the LBD, and incomplete relaxation of the LBD following the removal of ACh.
The energy barrier for ACh unbinding is estimated to be about 10.5 kcal/mol from pathway 3. According to the transition state theory, this will give us an estimation of the unbinding rate of 1.9×10⁵ s-1 (assuming the Arrhenius frequency factor as 1013 s-1). The experimentally measured ACh dissociation rate from nAChR in active state was 24 s-1 18. The discrepancy can be attributed to three factors. First, solvent friction can slow down the unbinding rate according to Kramers' reaction rate theory46. Second, the unbinding of ACh is coupled to the open of the C loop, which might be a rare event during the dynamics of nAChR. Third, the interaction between the LBD and the TMD might alter the unbinding barrier as well. Furthermore, the Kramers estimate of the reaction rate is based on a simple two-state scenario, and a more accurate estimation should be based on the first passage time using the complete PMF profile35.
The PMF calculations also indicate that there might be some distinctive intermediate states during the unbinding of ACh from the LBD of hα7-nAChR. At pulling distances of 2.5 Å and 6.0 Å, the PMF showed shoulders or local minima for pathways 1, 2 and 3. In the force profile shown in Figure 3, the forces tended to be negative in some regions, consistent with the presence of stable intermediate states. Figure 6 shows the interaction between ACh and some important residues in the binding site or along the unbinding pathway. At 2.5 Å, W148, Y187 and Y192 all make good contact with ACh (Fig. 6a). Especially for Y187 and Y192, the contact is optimal compared with the initial position of these residues as seen in Figure 2. This is due to the removal of constraints by other residues initially present in the binding site, but now left behind. These residues include Y92 and W54′. Another important finding for this intermediate is that a hydrogen bond is formed between the carbonyl group of ACh and the side chain of Q116′. At 6.0 Å, Y187 is the last aromatic residue still making good contact with ACh (Fig. 6b). Other residues such as W148 and Y194 only interact with ACh marginally. After 10 Å, ACh is already completely out of the binding site. However, some charged residues are located near the unbinding pathway. For example, at 12.0 Å, K191 is seen to interact with ACh (Fig. 6c). ACh turns around to point the positively charged quaternary ammonium opposite to the side chain of K191 to lower its free energy. As a result, there is a small dip in the PMF.
Fig. 6.

The interactions between ACh and binding site residues in three intermediate states identified from the PMF profiles. (a) at 2.5 Å; (b) at 6.0 Å; (c) at 12.0 Å
It is generally thought that the changes in agonist binding affinity to nAChR follow a two-state model47. In such a model, nAChR is assumed to be in a low-affinity agonist binding resting state in the absence of agonist, and a high-affinity agonist binding desensitized state. It has been observed that noncompetitive channel blockers such as proadifen, chloropromazine, and dimethisoquin, etc., can stabilize the desensitized conformation48,49, while others such as tetracaine, can shift the equilibrium toward the resting state50. However, conformational intermediates have been implicated from infrared difference spectroscopic studies of channel blocker binding to nAChR51. The rate-equilibrium free energy relationship (REFER) has been applied to the sequential pathway of channel gating in nAChR52. Recently it has been shown that significant discrepancies exist between the two-state model and experiments using REFER analysis53. Intermediate states such as those suggested by these simulations could help to explain such discrepancies, but more definitive statements will require much longer simulations.
Free energy calculations require extensive sampling of the configuration space. As concluded from earlier works, there is not much one can do to avoid adequate sampling to get an accurate estimate of free energy54. In the current study, the total simulation time is more than 100 ns, which is significantly longer than other similar PMF calculations35,55. Nonetheless, it remains insufficient to sample using SMD and Jarzynski's equality for this complex system, at least for some of the pathways investigated here. Other standard free energy methods, such as umbrella sampling, may give PMF with comparable or better accuracy with the same length of sampling. However, the setup process of SMD is much simpler than all other methods, as the same setup can be used to obtain many trajectories32. Finally, we should note that although free energy profiles are useful and important, they can sometimes lead to misleading interpretations of reaction rates and bottlenecks without careful analysis.
Supplementary Material
Charges and parameters for ACh, complete ref 26. This material is available free of charge via the Internet at http://pub.acs.org.
Acknowledgments
This work is in part supported by the National Institutes of Health, the National Science Foundation, the Howard Hughes Medical Institute, the NSF Center for Theoretical Biological Physics, the National Biomedical Computing Resource, the W. M. Keck Foundation, and Accelrys, Inc.
References
- 1.Galzi JL, Changeux JP. Curr Opin Struc Biol. 1994;4:554–565. [Google Scholar]
- 2.Karlin A, Akabas MH. Neuron. 1995;15:1231–1244. doi: 10.1016/0896-6273(95)90004-7. [DOI] [PubMed] [Google Scholar]
- 3.Karlin A. Nature Rev Neurosci. 2002;3:102–114. doi: 10.1038/nrn731. [DOI] [PubMed] [Google Scholar]
- 4.Role LW, Berg DK. Neuron. 1996;16:1077–1085. doi: 10.1016/s0896-6273(00)80134-8. [DOI] [PubMed] [Google Scholar]
- 5.Changeux JP. Harvey Lectures. 1981;75:85–254. [PubMed] [Google Scholar]
- 6.Lindstrom J. Mol Neurobiol. 1997;15:193–222. doi: 10.1007/BF02740634. [DOI] [PubMed] [Google Scholar]
- 7.Brejc K, van Dijk WJ, Klaassen RV, Schuurmans M, van der Oost J, Smit AB, Sixma TK. Nature. 2001;411:269–276. doi: 10.1038/35077011. [DOI] [PubMed] [Google Scholar]
- 8.Celie PHN, van Rossum-Fikkert SE, van Dijk WJ, Brejc K, Smit AB, Sixma TK. Neuron. 2004;41:907–914. doi: 10.1016/s0896-6273(04)00115-1. [DOI] [PubMed] [Google Scholar]
- 9.Bourne Y, Talley TT, Hansen SB, Taylor P, Marchot P. EMBO J. 2005;24:1512–1522. doi: 10.1038/sj.emboj.7600620. [DOI] [PMC free article] [PubMed] [Google Scholar]
- 10.Celie PHN, Kasheverov IE, Mordvintsev DY, Hogg RC, van Nierop P, van Elk R, van Rossum-Fikkert SE, Zhmak MN, Bertrand D, Tsetlin V, Sixma TK, Smit AB. Nat Struc Mol Biol. 2005;12:582–588. doi: 10.1038/nsmb951. [DOI] [PubMed] [Google Scholar]
- 11.Miyazawa A, Fujiyoshi Y, Unwin N. Nature. 2003;423:949–955. doi: 10.1038/nature01748. [DOI] [PubMed] [Google Scholar]
- 12.Unwin N. J Mol Biol. 2005;346:967–989. doi: 10.1016/j.jmb.2004.12.031. [DOI] [PubMed] [Google Scholar]
- 13.Sine SM, Wang HL, Bren N. J Biol Chem. 2002;277:29210–29223. doi: 10.1074/jbc.M203396200. [DOI] [PubMed] [Google Scholar]
- 14.Le Novere N, Grutter T, Changeux JP. Proc Natl Acad Sci USA. 2002;99:3210–3215. doi: 10.1073/pnas.042699699. [DOI] [PMC free article] [PubMed] [Google Scholar]
- 15.Amiri S, Tai K, Beckstein O, Biggin PC, Sansom MSP. Mol Membr Biol. 2005;22:151–162. doi: 10.1080/09687860500063340. [DOI] [PubMed] [Google Scholar]
- 16.Smit AB, Syed NI, Schaap D, van Minnen J, Klumperman J, Kits KS, Lodder H, van der Schors RC, van Elk R, Sorgedrager B, Brejc K, Sixma TK, Geraerts WP. Nature. 2001;411:261–268. doi: 10.1038/35077000. [DOI] [PubMed] [Google Scholar]
- 17.Unwin N. Nature. 1995;373:37–43. doi: 10.1038/373037a0. [DOI] [PubMed] [Google Scholar]
- 18.Grosman C, Auerbach A. Proc Natl Acad Sci USA. 2001;98:14102–14107. doi: 10.1073/pnas.251402498. [DOI] [PMC free article] [PubMed] [Google Scholar]
- 19.Adams PR. J Membr Biol. 1981;58:161–174. doi: 10.1007/BF01870902. [DOI] [PubMed] [Google Scholar]
- 20.Izrailev S, Stepaniants S, Balsera M, Oono Y, Schulten K. Biophys J. 1997;72:1568–1581. doi: 10.1016/S0006-3495(97)78804-0. [DOI] [PMC free article] [PubMed] [Google Scholar]
- 21.Isralewitz B, Baudry J, Gullingsrud J, Kosztin D, Schulten K. J Mol Graph & Model. 2001;19:13–25. doi: 10.1016/s1093-3263(00)00133-9. [DOI] [PubMed] [Google Scholar]
- 22.Henchman RH, Wang HL, Sine SM, Taylor P, McCammon JA. Biophys J. 2003;85:3007–3018. doi: 10.1016/S0006-3495(03)74720-1. [DOI] [PMC free article] [PubMed] [Google Scholar]
- 23.Henchman RH, Wang HL, Sine SM, Taylor P, McCammon JA. Biophys J. 2005;88:2564–2576. doi: 10.1529/biophysj.104.053934. [DOI] [PMC free article] [PubMed] [Google Scholar]
- 24.Law R, Henchman RH, McCammon JA. Proc Natl Acad Sci USA. 2005;102:6813–6818. doi: 10.1073/pnas.0407739102. [DOI] [PMC free article] [PubMed] [Google Scholar]
- 25.Vriend G. J Mol Graph. 1990;8:52–56. doi: 10.1016/0263-7855(90)80070-v. [DOI] [PubMed] [Google Scholar]
- 26.MacKerell AD, et al. J Phys Chem B. 1998;102:3586–3616. doi: 10.1021/jp973084f. [DOI] [PubMed] [Google Scholar]
- 27.Goodsell DS, Morris GM, Olson AJ. J Mol Recognit. 1996;9:1–5. doi: 10.1002/(sici)1099-1352(199601)9:1<1::aid-jmr241>3.0.co;2-6. [DOI] [PubMed] [Google Scholar]
- 28.Arias HR. Brain Res Rev. 1997;25:133–191. doi: 10.1016/s0165-0173(97)00020-9. [DOI] [PubMed] [Google Scholar]
- 29.Li LT, Zhong WG, Zacharias N, Gibbs C, Lester HA, Dougherty DA. Chem & Biol. 2001;8:47–58. doi: 10.1016/s1074-5521(00)00055-7. [DOI] [PubMed] [Google Scholar]
- 30.Kale L, Skeel R, Bhandarkar M, Brunner R, Gursoy A, Krawetz N, Phillips J, Shinozaki A, Varadarajan K, Schulten K. J Comput Phys. 1999;151:283–312. [Google Scholar]
- 31.Kosztin D, Izrailev S, Schulten K. Biophys J. 1999;76:188–197. doi: 10.1016/S0006-3495(99)77188-2. [DOI] [PMC free article] [PubMed] [Google Scholar]
- 32.Park S, Khalili-Araghi F, Tajkhorshid E, Schulten K. J Chem Phys. 2003;119:3559–3566. [Google Scholar]
- 33.Park S, Schulten K. J Chem Phys. 2004;120:5946–5961. doi: 10.1063/1.1651473. [DOI] [PubMed] [Google Scholar]
- 34.Gullingsrud JR, Braun R, Schulten K. J Comput Phys. 1999;151:190–211. [Google Scholar]
- 35.Jensen MO, Park S, Tajkhorshid E, Schulten K. Proc Natl Acad Sci USA. 2002;99:6731–6736. doi: 10.1073/pnas.102649299. [DOI] [PMC free article] [PubMed] [Google Scholar]
- 36.Jarzynski C. Phys Rev Lett. 1997;78:2690–2693. [Google Scholar]
- 37.Hermans J. J Phys Chem. 1991;95:9029–9032. [Google Scholar]
- 38.Wood RH, Muhlbauer WCF, Thompson PT. J Phys Chem. 1991;95:6670–6675. [Google Scholar]
- 39.Hendrix DA, Jarzynski C. J Chem Phys. 2001;114:5974–5981. [Google Scholar]
- 40.Ytreberg FM, Zuckerman DM. J Comput Chem. 2004;25:1749–1759. doi: 10.1002/jcc.20103. [DOI] [PubMed] [Google Scholar]
- 41.Williamson PTF, Watts JA, Addona GH, Miller KW, Watts A. Proc Natl Acad Sci USA. 2001;98:2346–2351. doi: 10.1073/pnas.031361698. [DOI] [PMC free article] [PubMed] [Google Scholar]
- 42.Nureki O, Vassylyev DG, Tateno M, Shimada A, Nakama T, Fukai S, Konno M, Hendrickson TL, Schimmel P, Yokoyama S. Science. 1998;280:578–582. doi: 10.1126/science.280.5363.578. [DOI] [PubMed] [Google Scholar]
- 43.Mclaughlin JT, Hawrot E, Yellen G. Biochem J. 1995;310:765–769. doi: 10.1042/bj3100765. [DOI] [PMC free article] [PubMed] [Google Scholar]
- 44.Chavez-Noriega LE, Crona JH, Washburn MS, Urrutia A, Elliott KJ, Johnson EC. J Pharmacol Exp Ther. 1997;280:346–356. [PubMed] [Google Scholar]
- 45.Gopalakrishnan M, Buisson B, Touma E, Giordano T, Campbell JE, Hu IC, Donnelyroberts D, Arneric SP, Bertrand D, Sullivan JP. Eur J Pharmacol Molec Ph. 1995;290:237–246. doi: 10.1016/0922-4106(95)00083-6. [DOI] [PubMed] [Google Scholar]
- 46.Kramers HA. Physica. 1940;7:284–304. [Google Scholar]
- 47.Heidmann T, Changeux JP. Eur J Biochem. 1979;94:255–279. doi: 10.1111/j.1432-1033.1979.tb12893.x. [DOI] [PubMed] [Google Scholar]
- 48.Krodel EK, Beckman RA, Cohen JB. Mol Pharmacol. 1979;15:294–312. [PubMed] [Google Scholar]
- 49.Heidmann T, Oswald RE, Changeux JP. Biochemistry-Us. 1983;22:3112–3127. doi: 10.1021/bi00282a014. [DOI] [PubMed] [Google Scholar]
- 50.Boyd ND, Cohen JB. Biochemistry-Us. 1984;23:4023–4033. doi: 10.1021/bi00313a003. [DOI] [PubMed] [Google Scholar]
- 51.Ryan SE, Blanton MP, Baenziger JE. J Biol Chem. 2001;276:4796–4803. doi: 10.1074/jbc.M007063200. [DOI] [PubMed] [Google Scholar]
- 52.Grosman C, Zhou M, Auerbach A. Nature. 2000;403:773–776. doi: 10.1038/35001586. [DOI] [PubMed] [Google Scholar]
- 53.Zhou Y, Pearson JE, Auerbach A. Biophys J. 2005;89:3680–3685. doi: 10.1529/biophysj.105.067215. [DOI] [PMC free article] [PubMed] [Google Scholar]
- 54.Gilson MK, Given JA, Bush BL, McCammon JA. Biophys J. 1997;72:1047–1069. doi: 10.1016/S0006-3495(97)78756-3. [DOI] [PMC free article] [PubMed] [Google Scholar]
- 55.Amaro R, Tajkhorshid E, Luthey-Schulten Z. Proc Natl Acad Sci USA. 2003;100:7599–7604. doi: 10.1073/pnas.1331150100. [DOI] [PMC free article] [PubMed] [Google Scholar]
Associated Data
This section collects any data citations, data availability statements, or supplementary materials included in this article.
Supplementary Materials
Charges and parameters for ACh, complete ref 26. This material is available free of charge via the Internet at http://pub.acs.org.