

Abstract
A noninvasive screening test would significantly facilitate early detection of epithelial ovarian cancer. This study used a combination of high-throughput selection and array-based serologic detection of many antigens indicative of the presence of cancer, thereby using the immune system as a biosensor. This high-throughput selection involved biopanning of an ovarian cancer phage display library using serum immunoglobulins from an ovarian cancer patient as bait. Protein macroarrays containing 480 of these selected antigen clones revealed 65 clones that interacted with immunoglobulins in sera from 32 ovarian cancer patients but not with sera from 25 healthy women or 14 patients having other benign or malignant gynecologic diseases. Sequence analysis data of these 65 clones revealed 62 different antigens. Among the markers, we identified some known antigens, including RCAS1, signal recognition protein-19, AHNAK-related sequence, nuclear autoantogenic sperm protein, Nijmegen breakage syndrome 1 (Nibrin), ribosomal protein L4, Homo sapiens KIAA0419 gene product, eukaryotic initiation factor 5A, and casein kinase II, as well as many previously uncharacterized antigenic gene products. Using these 65 antigens on protein microarrays, we trained neural networks on two-color fluorescent detection of serum IgG binding and found an average sensitivity and specificity of 55% and 98%, respectively. In addition, the top 6 of the most specific clones resulted in an average sensitivity and specificity of 32% and 94%, respectively. This global approach to antigenic profiling, epitomics, has applications to cancer and autoimmune diseases for diagnostic and therapeutic studies. Further work with larger panels of antigens should provide a comprehensive set of markers with sufficient sensitivity and specificity suitable for clinical testing in high-risk populations.
Introduction
The most extensively investigated biomarker for screening of ovarian cancer is CA-125, whose serum levels are elevated in 50% of stage I and 90% of stage II to IV ovarian cancer patients (1). However, elevated CA-125 levels have also been observed in healthy women during menstruation and in patients with other gynecologic diseases and other malignancies, which results in a high false-positive rate for CA-125 (2, 3).
In contrast to detection of serum antigens, the detection of serum antibody responses to tumor antigens may provide a more reliable serum marker for cancer diagnosis (4-7), because serum antibodies are more stable than serum antigens. Furthermore, antibodies may be more abundant than antigens, especially at low tumor burdens characteristic of early stages. Thirty percent of patients with ductal carcinoma in situ in which the proto-oncogene HER-2/neu was overexpressed had serum antibodies specific to this protein (8, 9). In addition, antibodies to p53 have been reported in patients with early-stage ovarian or colorectal cancers (10, 11). Changes in the level of gene expression in cancer (4, 8, 12, 13) and aberrant expression of tissue-restricted gene products in cancer (14, 15) are factors in the development of a humoral immune response in cancer patients. In this respect, serologic analysis of recombinant cDNA expression libraries of tumors with autologous serum has identified some relevant tumor antigens, MAGE (16), SSX2 (17), and NY-ESO-1 (18).
Screening for ovarian cancer at early stage has been reported by Petricoin et al. (19) using technology based on the generation of proteomic spectra of serum proteins using matrix-assisted laser desorption and ionization time-of-flight and surface-enhanced laser desorption and ionization time-of-flight mass spectroscopy. Due to the low prevalence of ovarian cancer in the general population, specificity of 95% obtained in this proteomic assay is not ready for a clinical ovarian cancer diagnostic test (20-24). Furthermore, some issues have arisen regarding the mass spectroscopy technology of protein profiling, as the data are difficult to reproduce and that they may be biased by artifacts in sample preparation, storage and processing, and patient selection (25).
This study describes a novel approach to clone and evaluate utility of tumor antigens in high throughput to detect serum antibodies on protein arrays. Multiple steps of selection of tumor antigens were used in this process. First, we employed a differential biopanning technique to screen a T7 phage display cDNA library to isolate cDNAs coding for antigenic proteins binding with antibodies present specifically in the sera of patients with ovarian cancer but not with antibodies in the sera of healthy women. Then, we conducted macroarray immunoscreenings to identify potential ovarian cancer biomarkers. Markers identified by macroarrays were validated on independent samples and other platforms, including two-color fluorescence microarrays, ELISA, and immunohistochemistry. Our goal was to evaluate the potential of a large panel of tumor antigens as biomarkers for a serum-based screening test that can detect the presence of epithelial ovarian cancer.
Materials and Methods
Serum samples
Blood samples from ovarian cancer patients (stage I-IV) and healthy controls were obtained from the Barbara Ann Karmanos Cancer Institute. Blood samples were centrifuged at 2,500 rpm at 4°C for 15 minutes and supernatants were stored at −70°C. Additional serum samples from ovarian cancer patients and patients with benign gynecologic conditions were obtained from the M. D. Anderson Cancer Center, Weill Medical College of Cornell University, and Northwestern University Robert H. Lurie Comprehensive Cancer Center. Healthy and diseased tissue sections were obtained from the Detroit Medical Center/Barbara Ann Karmanos Cancer Institute Pathology Core Facility and the Gynecologic Oncology Group Tissue Bank, which is funded by the National Cancer Institute. This study was conducted under protocols approved by the Wayne State University Human Investigation Committee.
Construction of T7 phage display cDNA library from ovarian cancer cell line (SKOV3) and isolation of mRNA from total RNA
Total RNA was prepared from ovarian cancer cells (grown in monolayer culture) using Trizol reagent according to the manufacturer’s instructions (Invitrogen, Carlsbad, CA). Purification of polyadenylate mRNA was done twice following the method as suggested by the manufacturer (Qiagen, Inc., Valencia, CA). The construction of the ovarian cancer T7 phage cDNA library was done using Novagen OrientExpress cDNA Synthesis (Random Primer System) and Cloning System according to the manufacturer’s suggestions (Novagen, Madison, WI; cDNA manual, TB247; T7Select System, TB178).
Biopanning of T7 phage displayed cDNA libraries with human sera
We did differential biopanning with negative and positive selection using 20 pooled sera from normal healthy women and serum from late-stage ovarian cancer patient PM2280 according to the manufacturer’s suggestions (Novagen; T7Select System, TB178). Protein G Plus-agarose beads were used for serum IgG immobilization. Four rounds of biopanning were done and the selected phage library was used for macroarray immunoscreening.
Macroarray immunoscreening
Four hundred eighty individual plaques were picked and amplified from biopanning 4 (BP4) and their lysates were arrayed onto a nitrocellulose membrane using the Beckman (Fullerton, CA) Biomek 2000 liquid handling robot. This robot, equipped with a 96-pin printing head, spotted the bacteriophage samples contained in 96-well plates onto nitrocellulose membranes in a 4 × 4 pattern (Fig. 1A). The nitrocellulose membranes were blocked with 5% dry milk for 1 hour at room temperature and incubated with individual patients’ sera (Table 1A; pretreated with 150 μg bacterial extracts for 2 hours at 4°C) at a dilution of 1:10,000 or 1:3,000 for 1 hour at room temperature. Bacterial extract was used because some patients and controls displayed antibody binding to bacterial protein(s). The membranes were washed thrice with 0.24% Tris, 0.8% NaCl, 1% Tween 20 (TBST) for 15 minutes each; incubated with secondary antibody, goat anti-human IgG horseradish peroxidase (HRP)–conjugated (Pierce, Rockford, IL) at 1:5,000 dilution for 1 hour at room temperature; washed thrice with TBST for 15 minutes each; and developed with SuperSignal West Pico chemiluminescent substrate (Pierce). The images were captured on X-ray film. The grid with uniformly low intensity for all the spots in that grid was chosen as the baseline corresponding to zero reactivity. Intensity of any other clones (in triplicate) in any grids higher than this the cutoff value (zero baseline) was taken as a positive reactive clone.
Figure 1.
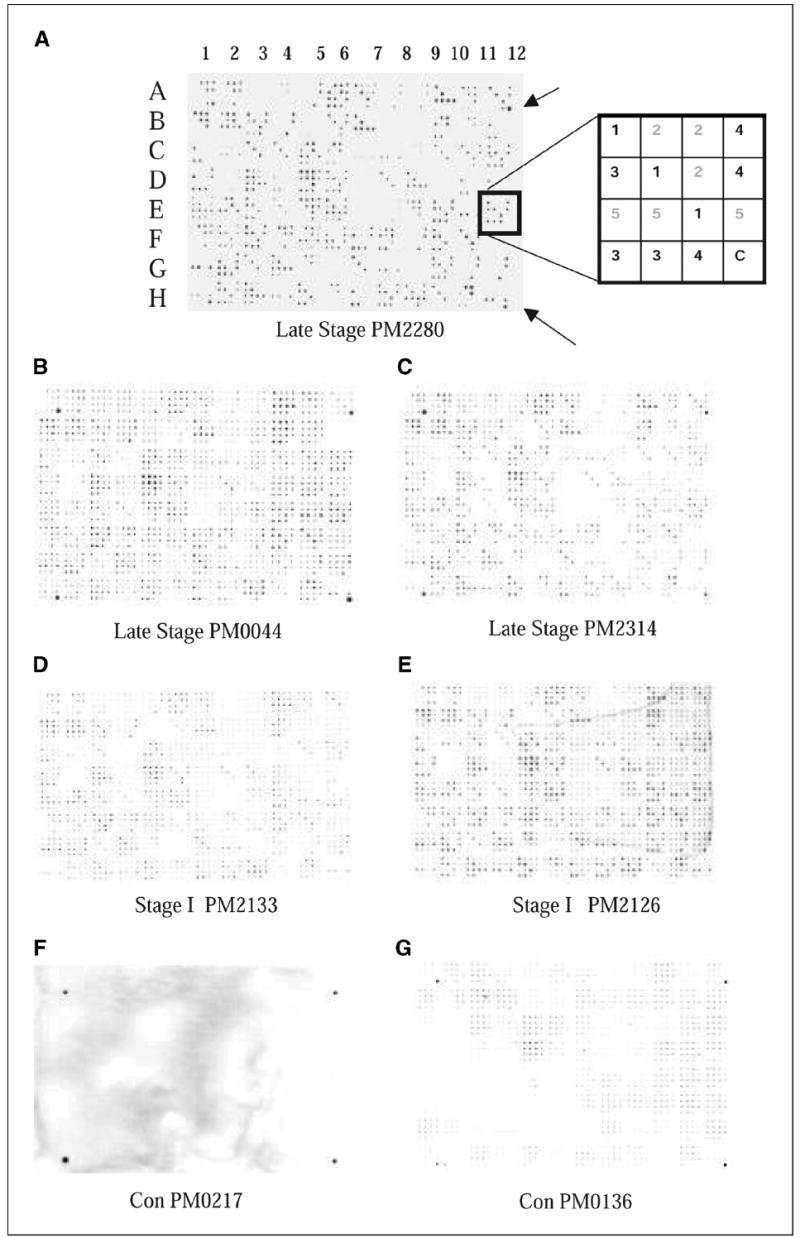
Filter macroarray. Five plates of amplified 96 phage clones from BP4 were spotted on nitrocellulose filters using Biomek robot with 96-pin print head. Filters were treated as a Western blot using patient sera or control sera as the primary antibody and antibody binding was detected using HRP-conjugated anti-human IgG antibody. A, filter was processed with PM2280 serum. The pattern consisted of 96 (4 × 4) patches. Each of the plates was spotted in triplicate and indicated by the same number 1, 2, 3, 4, or 5 (refer to box diagram at the right ). The outer four corners of the 96 sets of spots (A1, A12, H1, and H12) were spotted with a 1:10,000 dilution of human serum in the last spot of the 16 for orientation purposes (arrows). Note: In the diagram of the patch indicated by the box, clones from plates 1, 3, and 4 bound to the IgG in the patient’s serum; in this case, it is PM2280. B and C, filters were processed with late-stage patients’ sera, PM0044 and PM2314. D and E, filters showing antigen binding with IgG in the serum of stage I ovarian cancer patients, PM2133 and PM2126. F and G, filters labeled with Con PM0217 and Con PM0136 were treated with healthy control serum. Refer to Table 1A for tumor histology and stage of patients’ sera used.
Table 1.
Tumor histology and stage of sera used for screening of ovarian cancer
| Histology | Stage I | Stage II | Stage III | Stage IV | Total |
|---|---|---|---|---|---|
| A. Macroarray | |||||
| Borderline serous ovarian cancer | 3 | 3 | |||
| Clear cell ovarian cancer | 1 | 1 | |||
| Endometrioid ovarian cancer | 4 | 4 | |||
| Mixed epithelial ovarian cancer | 2 | 2 | 4 | ||
| Serous ovarian cancer | 2 | 11 | 1 | 14 | |
| Ovarian adenocarcinoma not otherwise specified | 1 | 1 | 3 | 1 | 6 |
| Total | 11 | 3 | 16 | 2 | 32 |
| B. Microarray | |||||
| Borderline serous ovarian cancer | 3 | 1 | 4 | ||
| Clear cell ovarian cancer | 5 | 1 | 6 | ||
| Endometrioid ovarian cancer | 6 | 2 | 1 | 9 | |
| Mixed epithelial ovarian cancer | 2 | 2 | 3 | 7 | |
| Mucinous ovarian cancer | 2 | 1 | 3 | ||
| Serous ovarian cancer | 2 | 29 | 4 | 35 | |
| Ovarian adenocarcinoma not otherwise specified | 3 | 2 | 5 | ||
| Total | 23 | 2 | 36 | 8 | 69 |
Microarray immunoscreening
We assessed accuracy of the antigen clones selected by macroarrays on a new set of sera (Table 1B) using a different experimental platform, protein microarrays. A set of 65 clones chosen from the macroarray data were spotted in quintuplicate onto FAST slides (Schleicher & Schuell, Keene, NH) by a robotic microarrayer, Prosys 5510TL (Cartesian, Inc., Ann Arbor, MI). T7 monoclonal antibody (Novagen) and goat anti-human IgG (Pierce) were labeled with monofunctional NHS ester-activated Cy3 and Cy5 dyes, respectively, following the manufacturer’s instructions (Amersham Biosciences Corp., Piscataway, NJ). The microarrays were blocked in 4% milk/PBS/0.1% Tween 20 for 1 hour at room temperature and incubated with human serum at a dilution of 1:300 in PBS at room temperature for 1 hour. The microarrays were rinsed in PBS and washed thrice in PBS/0.1% Tween 20 for 10 minutes each at room temperature and then incubated with Cy3-labeled-T7 anti-capsid antibody at a dilution of 1:70,000 and anti-human IgG labeled with Cy5 at a dilution of 1:3,000 in PBS for 1 hour in the dark. The microarrays were washed thrice in PBS/0.1% Tween 20 for 2 minutes each and then twice in PBS for 2 minutes each and air dried.
The arrays were scanned in an Axon Laboratories 4100A scanner (Palo Alto, CA) using 532 and 635 nm lasers. The ratio of anti-T7 capsid and anti-human IgG was determined by comparing the fluorescence intensities in the Cy3- and Cy5-specific channels at each spot using ImaGene software (Biodiscovery, Inc., El Segundo, CA).
Statistical analysis of microarray
Microarray data normalization and calculation of receiver operating characteristic (ROC) curve summary measures were conducted in R environment version 2.0.1 (26), with LIMMA (27), ROC (28), and NNET (VR bundle; ref. 29) packages for data input, ROC curve, and neural network, respectively; marker selection and utility calculation were conducted with SPSS version 13.0.1 (SPSS, Inc., Chicago, IL). The microarray data were preprocessed and normalized using local background subtraction of the raw spot signals. The red over green channel intensity ratios were log transformed and the data were normalized to the print-tip group median within each array. Mean of spot replicates (quintuplicate) was taken.
We validated the biomarkers by splitting the data into training and testing sets. The 129 sera were divided randomly into two partitions: a training set containing 2/3 of the samples (85 sera) and a testing set containing 1/3 of the samples (44 sera). This process was repeated 10 times in a stratified way (i.e., each training and testing set had the same proportion of healthy people and people with early-stage or late-stage ovarian cancer). The selection of clones and development of models were conducted on each training set and the performance evaluations were conducted on the respective testing set. Because an effective screening test for ovarian cancer should be highly specific, the threshold with highest specificity was chosen on each testing set ROC curve. The performance variables of the models were averaged across these 10 trials.
The models were built using neural networks. A feed-forward neural network architecture with 65 input nodes, 4 hidden nodes, and 1 output node was trained by error back propagation using the data in each training set. Missing values were substituted by the mean value of that attribute on the training and test set independently.
As a single marker may not be specific enough to be clinically meaningful and a very large number of markers may not be practical, a combination of several markers with the best utility was assessed to select markers with the highest accuracy. Conventional statistical tests sometimes fail to rank properly highly specific markers (30). Partial area under the ROC curve (pAUC) is a robust nonparametric estimator and may be a more accurate summary measure of biomarker utility compared with statistics assessing mean differences (30, 31). We ranked clones in each of 10 training sets on total AUC and pAUC using a false-positive fraction to 0.3. To select clones that were both highly specific and had good overall utility we used the mean of these two ranks for each clone. Six markers (4H4, 5B12, 2F7, 2A3, 5H8, and 5C12) were selected for evaluation because they were among the top 10 most specific markers in at least 9 of 10 training sets. Feed-forward neural networks with six input nodes, two hidden nodes, and one output node were trained by error back propagation (one model for each training set) to assess utility of these markers.
ELISA macroarray analysis
Six stage I to IV clones, printed in triplicate, were arrayed on nitrocellulose membranes, which were processed similarly as described in macroarray immunoscreening using patient or control serum at dilutions of 1:1,000, 1:3,000, 1:10,000, and 1:30,000. As a control, these macroarrays were also processed with a monoclonal antibody to the NH2 terminus of the T7 gene 10 protein at 1:10,000 dilution (Novagen). The intensity of each spot was measured using ImaGene software with background subtraction. Serum antibody binding was normalized to an empty vector phage capsid protein.
Sequencing of phage cDNA clones
Individual phage clones were PCR amplified using forward primer 5′-GTTCTATCCGCAACGTTATGG-3′ and reverse primer 5′-GGAGGAAAGTCGTTTTTTGGGG-3′ and sequenced using forward primer by Wayne State University DNA Sequencing Core Facility.
Immunohistochemistry
For the assessment of expression levels of RCAS1, eukaryotic initiation factor 5A (eIF-5A), and Nijmegen breakage syndrome 1 (Nibrin), immunohistochemical staining was done on 4-μm sections from formalin-fixed, paraffin-embedded tissue with antibodies to RCAS1 (Medical and Biological Laboratoires Co. Ltd., Woburn, MA), eIF-5A (Abcam, Inc., Cambridge, MA), and Nibrin (Abcam). These experiments were carried out using standard procedures by the Karmanos Cancer Institute Pathology Core (32). Each sample was scored for intensity of staining and percent positive cells by a clinical gynecologic pathologist.
Results
Differential biopanning of T7 phage display cDNA expression libraries employing sera obtained from women with ovarian cancer and healthy controls
To isolate a large panel of antigen biomarkers, we did differential biopanning of a T7 phage display cDNA library prepared from an ovarian cancer cell line, SKOV3, using a late-stage ovarian cancer patient’s serum (PM2280) as the bait to isolate tumor-specific antigens (Materials and Methods). Each antigen is expressed as a fusion protein in frame with T7 gene 10 phage capsid protein. Because ~35% of the selected phage clones interacted with PM2280 serum IgG after the fourth round of biopanning (data not shown), further biopanning was not done to avoid reducing the diversity of antigen clone set.
Serologic detection of antibodies using macroarrays
A set of 480 clones from the fourth round of biopanning was robotically spotted on nitrocellulose membranes. The binding of the cloned antigens with the IgG in patients’ sera was done at a dilution of 1:10,000. The strong positive interactions observed with the PM2280 serum indicated a relatively high titer of the IgG molecules that bound with the PM2280 clones (Fig. 1A). Although 480 clones were identified from the biopanning with PM2280 serum as the bait, not all 480 clones bound to IgG in the PM2280 serum (Fig. 1A). This may have been due to a nonspecific binding with phage clones and the protein G+ beads bearing the serum antibodies in the biopanning. When the IgG binding from sera of other patients (nonself reaction) was analyzed using replicates of these robotically spotted macroarrays, cross-reactivity was observed in most patients at a dilution of 1:10,000 (Fig. 1B-E). Sera from other patients required either 1:3,000 or 1:30,000 dilution to unambiguously detect positive clones. Binding was scored positive only when all three of the triplicates had similar intensity and when the intensity was significantly higher than the background intensity of other spots within the same patch. We tested sera from 71 women, including 8 with stage I invasive ovarian cancer, 3 with stage I borderline ovarian cancer, 21 with late-stage ovarian cancer, 10 with benign gynecologic diseases, and 4 with endometrial cancer as well as 25 sera from healthy female controls. Tumor histology and stage of all the patients used for the study are listed in Table 1A. Late-stage patients PM0044 and PM2314 bound more intensely than the stage I patients PM2133 and PM2126 (Fig. 1B-E), possibly indicative of differences in their antibody titers to the antigens. As expected, a fraction of the 480 phage clones on the macroarrays interacted with ~10% of the controls. All clones that interacted with the control sera were eliminated from further consideration. One hundred forty-nine clones interacted with sera from stage I to IV ovarian cancer patients but not with any of the 25 control sera. Forty-eight of 149 clones interacted specifically with IgG in these stage I to IV sera (Table 2A). The remaining 101 clones interacted with sera from women who had benign tumors, endometrial cancers, or other gynecologic diseases and may represent biomarkers of gynecologic disease. These clones were excluded because these conditions are a common source of false-positive results in CA-125 clinical testing. A matrix summarizing the binding of the 48 stage I to IV selected antigen clones to sera from patients and controls is shown in Table 2A. The derivation of this matrix was based on an agreement between two observers who analyzed the data independently, with 87% concordance. Only the concordant results are reported.
Table 2.
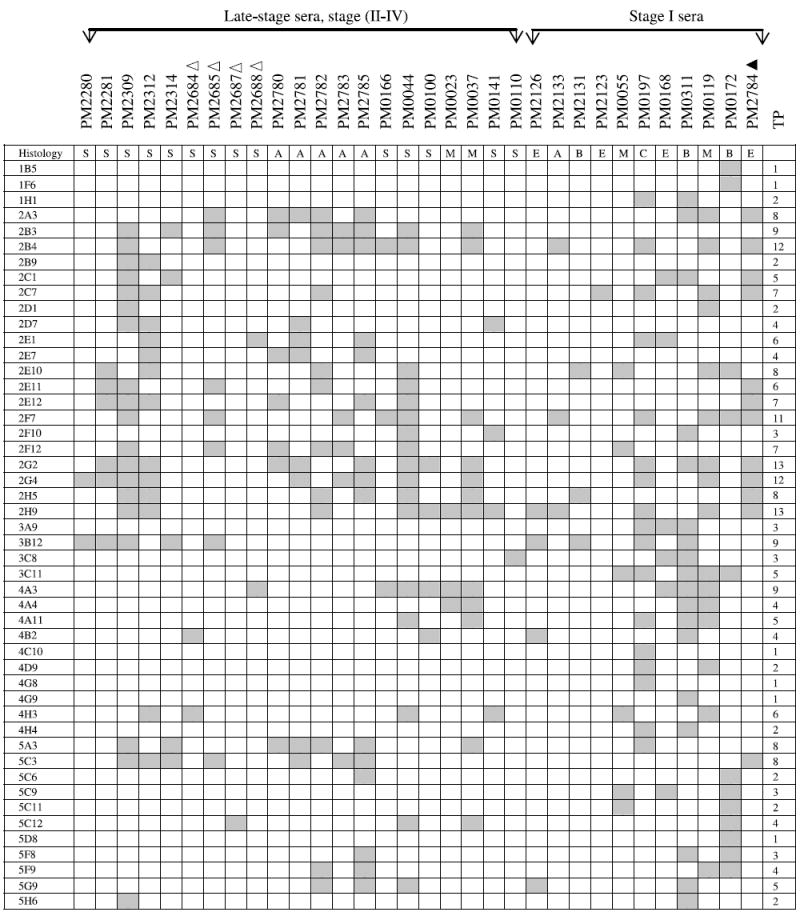
| A. Binding of 48 Clones with Late Stage and Stage ∣ Ovarian Cancer Patient Sera |
|---|
|
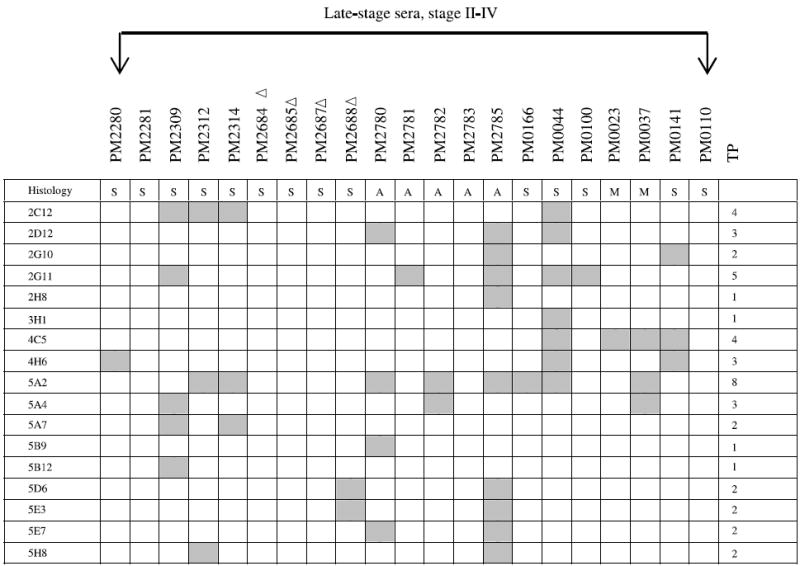
| B. Binding of 17 Clones with Late Stage Ovarian Cancer Patient Sera |
|
NOTE: The binding of a panel of 48 clones with 21 late-stage and 11 stage I ovarian cancer patients was determined. These 48 antigens bound exclusively with serum IgG derived from both late-stage and stage I ovarian cancer patients (including borderline histology) but not with serum IgG from normal controls or patients with benign gynecologic diseases. The gray boxes represent positive binding of phage clones with patient’s sera. TP, total number of patients whose serum IgG bound to each phage clone; Δ, 1:3,000 serum dilution; ▲, 1:30,000 serum dilution; all others were analyzed at a serum dilution of 1:10,000. Histology key: S, serous adenocarcinoma; A, adenocarcinoma not otherwise specified; M, mixed histology; E, endometrioid; B, borderline; C, clear cell. The binding of a panel of 17 clones with 21 late-stage ovarian cancer patients was determined on macroarrays. These 17 antigens bound exclusively with serum IgG derived from late-stage ovarian cancer patients but not with serum IgG from stage I patients, normal controls, or patients with benign gynecologic diseases. The gray boxes represent positive binding of phage clones with patient’s sera. TP, total number of patients whose serum IgG bound to each phage clone; Δ, 1:3,000 serum dilution; all others were analyzed at a serum dilution of 1:10,000.
Only 2 of 48 selected clones, 2G4 and 3B12, bound with PM2280 serum IgG, although T7 cDNA library was biopanned with PM2280 serum as the bait. A large number of clones interacting with the PM2280 serum were eliminated because they bound with either healthy controls or patients having benign or other gynecologic diseases. The best markers are those interacting with the most patients; these include such clones as 2H9 (13 of 32), 2G2 (13 of 32), 2B4 (12 of 32), and 2G4 (12 of 32) that had the highest frequency of IgG binding with sera from ovarian cancer patients. Three antigens, 2F7/2B4, 5C3/2G4, and 2E1/4A3, were found in multiple clones resulting in a panel of 45 markers binding with IgG in stage I to IV ovarian cancer sera (Table 2A).
A second group of 17 clones was found to interact with sera from 15 of 21 late-stage patients (Table 2B) but not with sera from early-stage patients, sera from 25 healthy women, or sera from 14 patients having either benign tumors, endometrial cancers, or other gynecologic diseases. Although 6 late-stage patients were not detected by these 17 clones (Table 2B), they were detected by 48 stage I to IV clones (Table 2A). Among these 17 clones, antigen 5A2 interacted with the greatest number of patients’ sera (8 of 21), clone 2G11 with 5 of 21, and clones 2C12 and 4C5 with 4 of 21 sera. Although these clones did not detect women with early-stage ovarian cancer, future analyses may show that they are useful as markers of recurrence. Again, only the concordant results obtained by independent analysis of two observers are reported.
Serologic detection of antibodies using microarrays
To independently evaluate the utility of these antigen biomarkers, we employed robotically prepared microarrays with each clone spotted each in quintuplicate. The set of 65 clones was immunoscreened on microarrays to evaluate their utility as biomarkers (Fig. 2). We tested sera from 129 women, including 20 with stage I invasive ovarian cancer, 3 with borderline ovarian cancer, 46 with late-stage ovarian cancer, and 60 healthy female controls. The average sensitivity, specificity, positive predictive value (PPV), and negative predictive value (NPV) of neural network models with 65 markers are shown in Table 3. Seven of 10 models had a threshold for specificity of 100%, thus providing 100% PPV. The predictive values were estimated with Bayes’ theorem (33). The prevalence of ovarian, fallopian tube, and peritoneal cancer over 10 years found among Jewish women with family history of ovarian cancer (any age) or breast cancer (age <50 years) in first-degree or second-degree relatives was 8 of 290 (2.76%). Estimated PPV and NPV were 43.8% and 98.7%, respectively, for average sensitivity and specificity of 65 markers. Prevalence of people with ovarian cancer among BRCA1 mutation carriers in this group of Jewish women was 7 of 31 (22.6%). Estimated PPV and NPV were 88.9% and 88.2%, respectively. Overall, these results provide a validation of the clones selected by macroarrays and their accuracy for detection of ovarian cancer (34).
Figure 2.
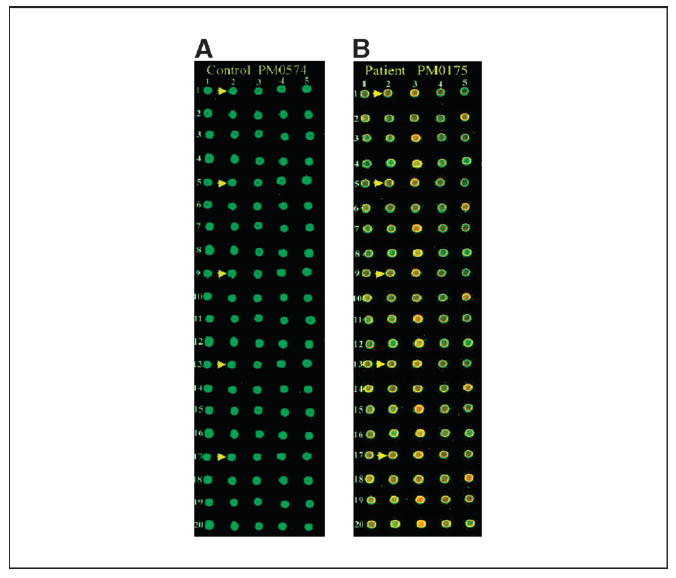
Antigen microarrays on biochip. Sixty-five clones in quintuplicate were robotically arrayed on biochip (FAST slides). Binding of antigens first with serum IgG from ovarian cancer patient and normal healthy individual and next with Cy3-labeled T7 anti-capsid antibody and Cy5-labeled anti-human IgG was done as described in Materials and Methods. The arrays were scanned at 532 and 635 nm lasers in an Axon Laboratories 4100A scanner. A, microarrays processed with serum IgG from control individual PM0574. A small section of the entire biochip. Arrows, five replicates of a particular clone; the location of the five replicates has been designated as r1_c2, r5_c2, r9_c2, r13_c2, and r17_c2 (r, row; c, column). B, microarrays processed with serum IgG from ovarian cancer patient PM0175. Arrows, five replicates of the same clone as shown in (A).
Table 3.
Measures of accuracy (%) for each training-testing set split of the serum samples
| 65 Clones
|
6 Clones
|
|||||||
|---|---|---|---|---|---|---|---|---|
| Split | SN | SP | PPV | NPV | SN | SP | ** PPV | ** NPV |
| 1 | 83 | 100 | 100 | 83 | 46 | 90 | 85 | 58 |
| 2 | 38 | 100 | 100 | 57 | 12 | 100 | 100 | 49 |
| 3 | 25 | 100 | 100 | 53 | 29 | 95 | 88 | 53 |
| 4 | 8 | 95 | 67 | 46 | 29 | 85 | 70 | 50 |
| 5 | 96 | 100 | 100 | 95 | 75 | 95 | 95 | 76 |
| 6 | 83 | 95 | 95 | 83 | 29 | 90 | 78 | 51 |
| 7 | 50 | 100 | 100 | 62 | 4 | 100 | 100 | 46 |
| 8 | 29 | 100 | 100 | 54 | 46 | 95 | 92 | 59 |
| 9 | 88 | 90 | 91 | 86 | 29 | 100 | 100 | 54 |
| 10 | 54 | 100 | 100 | 64 | 25 | 85 | 67 | 49 |
| Average | 55 | 98 | 95 | 68 | 32 | 94 | 88 | 54 |
Abbreviations: SN, sensitivity; SP, specificity.
PPV = (Sensitivity × Prevalence) / (Sensitivity × Prevalence) + (1 − Specificity) (1 − Prevalence).
NPV = Specificity × (1 − Prevalence) / Specificity × (1 − Prevalence) + (1 − Sensitivity) × Prevalence.
To implement autoantigen biomarkers on current clinical platforms, we may need to reduce the number of features that we analyze. To assess predictive value of the fewest clones with the highest utility, we selected the top 6 clones based on pAUC and AUC and built neural network models on the training sets. The average sensitivity specificity, PPV, and NPV obtained with six clones on the testing sets are shown in Table 3. These top 6 markers resulted in an average sensitivity and specificity of 32% and 94%, respectively. This indicates that a reduced panel can be developed that could retain significant accuracy once larger panels of markers are available.
To assess the false-positive fraction when testing sera from patients with other cancers, we conducted an experiment with the same protocol to evaluate the ability of these markers to distinguish ovarian cancer from people with breast cancer (BRCA; 10 samples) or head and neck cancer (HNSCC; 10 samples; 80% males). The neural networks using of 65 and 6 markers built for ovarian cancer were tested on these data. Using the BRCA and HNSCC groups together as controls and ovarian cancer as the case group, average false-positive fractions for 65 and 6 markers were 17% (range, 0-40%) and 5% (range, 0-20%), respectively. Ten models with six markers classified all HNSCC and 9 of 10 of the BRCA serum samples correctly as nonovarian cancer. These results indicate that our approach using multiple antigen biomarkers has the potential to distinguish ovarian cancer from other cancers.
ELISA macroarray analysis
To show the utility of the six clone set on a commonly used experimental platform, ELISA-like assay, these clones were robotically printed on nitrocellulose membranes. The binding of serum IgG to these antigens decreased with increasing dilutions of serum. Four of the six clones are presented in ELISA analysis in order of their accuracy Fig. 3A-D. Serum antibody binding was normalized to a clone containing an empty vector phage. This showed that the interaction of antigen clones with patients’ sera was a titerable antigen-antibody interaction and indicates the potential to use these markers in typical ELISA-based clinical tests.
Figure 3.
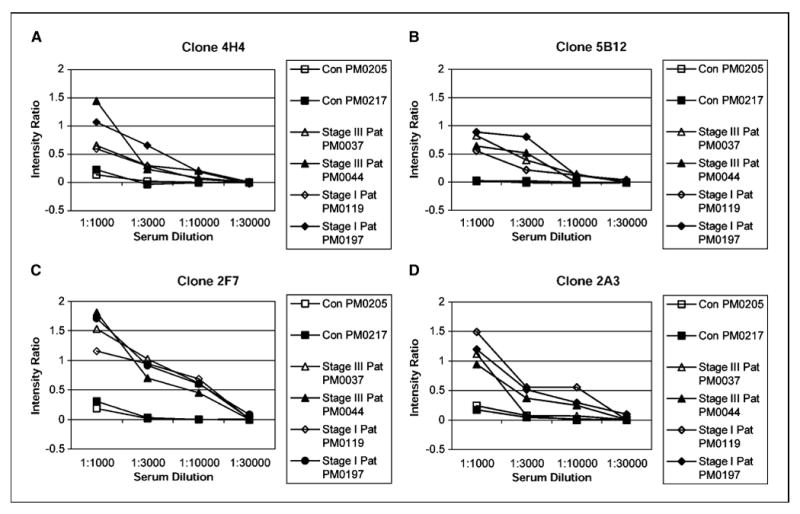
Determination of a titerable antigen-antibody binding in ELISA macroarray analysis. The clones were spotted on a set of four different nitrocellulose membranes that were later processed with four different dilutions (1:1,000, 1:3,000, 1:10,000, and 1:30,000) of either healthy control serum or patients serum (both stage I and III). Refer to Table 1A for tumor histology and stage of patients’ sera used. A set of four filters was also processed with T7 antibody at 1:10,000 dilution. Phage binding to serum IgG was detected with HRP-conjugated anti-human IgG, and intensity of each spot corresponding to a particular phage clone was determined as described in Materials and Methods. The intensity ratio of the four clones 4H4 (A), 5B12 (B), 2F7 (C), and 2A3 (D) were plotted against dilutions of serum obtained from healthy controls and patients. Intensity ratio = (mean signal intensity of a phage clone reacting with patient’s serum) / (mean signal intensity of that phage clone reacting with T7 antibody) – (mean signal intensity of blank phage clone reacting with patient’s serum) / (mean signal intensity of that blank phage clone reacting with T7 antibody). The intensity ratio versus serum concentration was plotted for each antigen clone.
Phage-coded antigen sequence analysis
To identify the selected gene products, phage DNAs were PCR amplified and sequenced. The DNA sequences were analyzed for homology to mRNA and genomic entries in the Genbank databases using BLASTn. We also determined the predicted amino acids in-frame with the T7 gene 10 capsid protein. Twelve gene products represented known gene products in the reading frame of the T7 gene 10 capsid protein, indicating that the serum IgG binding region was localized to a portion of the natural open reading frame of the protein (Supplementary Table S1). Of the remaining 36 clones, 14 clones contained an open reading frame with the T7 10B gene with a frameshift within the natural reading frame of the gene, 9 clones contained portions of either 5′ or 3′ untranslated regions of known genes, and 13 clones contained segments of genomic sequences (Supplementary Table S2). This in turn resulted in the formation of recombinant fusion proteins in which the predicted amino acid of the in-frame fusion with the T7 10B protein was not similar to the original protein coded by the gene. The size of the additional peptide sequences ranged from 5 to 48 amino acids. It is likely that the recombinant gene products of these clones are coding for proteins that mimic some other natural antigens and hence can be termed mimotopes (Supplementary Table S2). BLASTp search of the SWISSPROT database for homology to each in-frame mimotope identified entries that these proteins are mimicking.
Of the 17 stage II to IV clones (Table 2B), 1 clone represented known gene products in the correct orientation and in the correct reading frame with the T7 gene 10B capsid protein and the remaining 16 clones represented mimotopes (Supplementary Tables S3 and S4).
Overexpression of RCAS1, eIF-5A, and Nibrin in serous ovarian carcinomas
Our original hypothesis was that the humoral response to tumor-associated antigens resulted from overexpression or mutation of the protein. To address this point, we tested by immunohistochemical staining whether Nibrin, RCAS1, and eIF-5A were overexpressed in ovarian tissue using 69 ovarian carcinoma tissue blocks (30 stage I and 39 late-stage) and 20 tissue sections from normal ovaries. We assessed expression levels using a combined score based on staining intensity and percentage of cells stained. Staining intensity was scored as 0 (negative), 1+ (weak), 2+ (medium), or 3+ (strong). A combined value based on the staining intensity and the percentage of stained cells was used as the final score. Overexpression was defined as an intensity of 2 or 3 and >10% stained cells or an intensity of 1, 2, or 3 and >50% stained cells (32). We found that RCAS1 (clone 1F6) was highly expressed in 22 of 30 stage I tumors, 26 of 39 late-stage tumors, but only 1 of 20 normal ovary tissues. Likewise, another antigen biomarker eIF-5A (clone 2G4) was highly expressed in 16 of 30 stage I tumors, 32 of 39 late-stage tumors, and 9 of 20 normal ovary tissues. Overexpression of Nibrin was observed in 1 of 30 stage I tumors, 13 of 39 late-stage tumors, and 0 of 20 normal ovary tissues. Interestingly, the one stage I patient who was positive for staining with an antibody to Nibrin was a stage IC patient who was never in remission dying 2.5 years after diagnosis, indicating that her cancer had spread at the time of diagnosis. These data confirm that the antigenicity of these proteins is due to overexpression in ovarian tumors. Clearly, our approach identifies overexpressed proteins that can be useful as stage-specific tissue biomarkers.
Discussion
The early detection of ovarian cancer is a significant challenge in clinical oncology and detecting ovarian cancer at stage I could result in a cure rate of 90%. To this end, we have devised an approach of high-throughput selection of antigen biomarkers using phage display libraries and marker selection using a highly parallel analysis on protein arrays. We began with a representative sample of 480 cloned markers from biopanning an ovarian cancer T7 phage display cDNA library with one patient’s serum. We first showed that these clones bound to IgG molecules found in the sera of patients other than the one used for antigen selection. Forty-five unique antigen biomarkers bound to IgG in the sera of early-stage and late-stage ovarian cancer patients and exhibited no binding to IgG in sera from women having benign gynecologic syndromes, such as ovarian cysts and endometrial fibroids, or sera from women with endometrial cancer. Because stage I tumors can elicit a detectable immune response in this assay, this technology is sensitive to small tumor burdens. Although we have cloned our antigen markers using serum from a patient having the most common histologic type of ovarian cancer, serous adenocarcinoma, these antigen biomarkers are capable of detecting other histologic types of ovarian cancer, including endometrioid and clear cell tumors as well (Table 2A). Using sera from patients with other cancers (breast and head and neck), we were able to show that these markers were fairly specific to ovarian cancer. Larger studies with additional antigen biomarkers in these and other populations will be needed to verify whether the rate of diagnostic misclassification with this approach is sufficiently low to justify their use in a clinical setting as screening test for ovarian cancer.
Knowledge regarding the immunogenicity and expression pattern of serologically defined tumor antigens is critical in assessing the therapeutic and diagnostic potential of those antigens. The present study shows that the use of T7 phage display selected clones is an effective technique for molecular profiling of the humoral immune response in ovarian cancer. Within this initial panel of 48 biomarkers, 10 contained large portions of open reading frames of the parental proteins: 1F6, receptor-binding cancer antigen expressed on SiSo cells (human uterine adenocarcinoma cell line; RCAS1; ref. 35); 3A9, signal recognition protein-19 (36); 5C11, AHNAK-related sequence (37); 2B4, nuclear autoantogenic sperm protein (NASP; ref. 38); 3C11, ribosomal protein L4 (39); 4H3, Nibrin (40); 2G4, eIF-5A (41, 42); and 5F8, Homo sapiens KIAA0419 gene product (43). With the exception of clone 4A11, the H. sapiens chromodomain helicase DNA-binding protein 1, and 2B3, H. sapiens cDNA FLJ11029 (44), all of the aforementioned gene products have a known or suspected association with cancer. Using two-dimensional followed by mass spectrometry, autoantibodies against eIF-5A were detected in sera from patients having lung adenocarcinoma (45). RCAS1 is overexpressed in many cancers, such as uterine, breast, and pancreatic cancers (35, 46, 47). As indicated by the broad overexpression of RCAS1 in human cancers, some of the antigens we have identified may not be specific to ovarian cancer. Indeed, when we tested the expression level of three antigens, RCAS1, eIF-5A, and Nibrin, using immunohistochemical staining, we found that RCAS1 and eIF-5A were highly expressed in both early-stage and late-stage tumors. Elevated expression of Nibrin was specific to late-stage cancer and may discriminate between early-stage and late-stage ovarian cancer as a tissue biomarker elevated due to differences in the levels of DNA damage at these stages of ovarian cancer. This indicated that our epitomics profiling of the humoral immune response in cancer patients could identify serum antibody markers that are relevant to the etiology of their cancer (e.g., overexpressed or mutated).
The remaining 36 clones are mimotopes, defined as peptides capable of binding to the paratope of an antibody but unrelated in sequence to the natural protein that the antibody actually recognizes (48). Peptide mimotopes can potentially be used as a novel form of immunotherapy to induce a beneficial antitumor response (49). The homology of the 17 stage II to IV clones with other known antigens is described in Supplementary Tables S3 and S4.
Prevalence of ovarian cancer in general population is ~0.04%. Because of this low prevalence, an effective screening test for ovarian cancer should have an extremely low false-positive rate to avoid costly and invasive follow-up procedures. A screening test with sensitivity and specificity of 90% is not sufficiently accurate for ovarian cancer because of relatively low specificity. Thus, a useful screening test for ovarian cancer must have very high specificity even at a cost of lower sensitivity. Most of our neural network models were 100% specific and had PPV of 100%. Because predictive values depend on sensitivity, specificity, and prevalence, they represent a more meaningful measurement of screening utility compared with sensitivity and specificity alone. Thus, given that our estimates of sensitivity and specificity are true at the population level and one of our 100% specific models is reliable, a positive result on a screening test would indicate a very high likelihood that a subject has ovarian cancer.
These results are promising but should be interpreted with caution. The top 6 highly specific markers are short (7-28 amino acids) mimotopes with novel immunogenicity. These six markers taken individually may not be very accurate biomarkers—only their combination has some utility. Our results obtained with neural network models may overestimate the true utility of these clones at the population level. The validity of these markers will need to be evaluated on a larger sample and also using other experimental platforms. Nonetheless, these results indicate the potential of high-throughput antigen cloning and detection on microarrays to identify biomarkers for ovarian cancer.
The antigens identified with microarrays have diagnostic value with additional potential for development of therapeutic vaccines, tissue biomarkers, or imaging reagents. Because the host immune system can unravel molecular events (overexpression or mutation) critical to the genesis of ovarian cancer, this novel proteomics technology can also identify genes with mechanistic involvement in the etiology of the disease.
In conclusion, using a combination of high-throughput selection and array-based serologic profiling that we call epitomics (50), we isolated a panel of 65 antigens that could provide useful diagnostic markers for the early detection of ovarian cancer especially in high-risk populations. Interestingly, 11 of the 13 known protein antigens that we found were associated previously with cancer although not necessarily as tumor antigens. Further work with larger panels of antigens analyzed on microarrays should provide a comprehensive set of markers that can be evaluated using sera from other conditions, benign and malignant, to further evaluate the specificity of an ovarian cancer test.
Supplementary Material
Note: Supplementary data for this article are available at Cancer Research Online (http://cancerres.aacrjournals.org/).
Acknowledgments
Barbara and Fred Erb Endowed Chair in Cancer Genetics (M.A. Tainsky); Gail Purtan Ovarian Cancer Research Fund, The Sinai Guild; NIH grant CA100740; The Michigan Life Science Corridor Fund 085P300470 (M.A. Tainsky) and P30CA022453 (Applied Genomics Core, Wayne State University); National Science Foundation grants NSF BIODB-0234806 and NSF SoD-0438970, NIH grants 1R01NS045207-01 and 1R01HG003491-01, and U.S. Army Medical Research and Materiel Command grant DAMD 17-03-02-0035 (S. Draghici).
We thank Drs. Wei-Zen Wei, Faisal Qureshi, and Suzanne Jacques for advice on tumor immunology and tumor pathology, Robin Gold for assistance in recruiting ovarian cancer patients, Sylvia Dryden and Scott Tainsky for editorial comments on the article, and Jonah Tainsky, Barry Skoczylas, and Nathan Gonik for technical assistance.
References
- 1.Zurawski VR, Jr, Orjaseter H, Andersen A, et al. Elevated serum CA 125 levels prior to diagnosis of ovarian neoplasia: relevance for early detection of ovarian cancer. Int J Cancer. 1988;42:677–80. doi: 10.1002/ijc.2910420507. [DOI] [PubMed] [Google Scholar]
- 2.Mastropaolo W, Fernandez Z, Miller EL. Pronounced increases in the concentration of an ovarian tumor marker, CA-125, in serum of a healthy subject during menstruation. Clin Chem. 1986;32:2110–1. [PubMed] [Google Scholar]
- 3.Takahashi K, Shibukawa T, Moriyama M, et al. Clinical usefulness and false-positive results of CA 125 as a tumor marker of ovarian cancer—a study on 674 patients. Jpn J Surg. 1986;16:305–10. doi: 10.1007/BF02470551. [DOI] [PubMed] [Google Scholar]
- 4.Naora H, Yang YQ, Montz FJ, et al. A serologically identified tumor antigen encoded by a homeobox gene promotes growth of ovarian epithelial cells. Proc Natl Acad Sci U S A. 2001;98:4060–5. doi: 10.1073/pnas.071594398. [DOI] [PMC free article] [PubMed] [Google Scholar]
- 5.Scanlan MJ, Chen YT, Williamson B, et al. Characterization of human colon cancer antigens recognized by autologous antibodies. Int J Cancer. 1998;76:652–8. doi: 10.1002/(sici)1097-0215(19980529)76:5<652::aid-ijc7>3.0.co;2-p. [DOI] [PubMed] [Google Scholar]
- 6.Scanlan MJ, Gordan JD, Williamson B, et al. Antigens recognized by autologous antibody in patients with renal-cell carcinoma. Int J Cancer. 1999;83:456–64. doi: 10.1002/(sici)1097-0215(19991112)83:4<456::aid-ijc4>3.0.co;2-5. [DOI] [PubMed] [Google Scholar]
- 7.Struss AK, Romeike BF, Munnia A, et al. PHF3-specific antibody responses in over 60% of patients with glioblastoma multiforme. Oncogene. 2001;20:4107–14. doi: 10.1038/sj.onc.1204552. [DOI] [PubMed] [Google Scholar]
- 8.Disis ML, Calenoff E, McLaughlin G, et al. Existent T-cell and antibody immunity to HER-2/neu protein in patients with breast cancer. Cancer Res. 1994;54:16–20. [PubMed] [Google Scholar]
- 9.Disis ML, Pupa SM, Gralow JR, et al. High-titer HER-2/neu protein-specific antibody can be detected in patients with early-stage breast cancer. J Clin Oncol. 1997;15:3363–7. doi: 10.1200/JCO.1997.15.11.3363. [DOI] [PubMed] [Google Scholar]
- 10.Gadducci A, Ferdeghini M, Buttitta F, et al. Assessment of the prognostic relevance of serum anti-p53 antibodies in epithelial ovarian cancer. Gynecol Oncol. 1999;72:76–81. doi: 10.1006/gyno.1998.5101. [DOI] [PubMed] [Google Scholar]
- 11.Lechpammer M, Lukac J, Lechpammer S, et al. Humoral immune response to p53 correlates with clinical course in colorectal cancer patients during adjuvant chemotherapy. Int J Colorectal Dis. 2004;19:114–20. doi: 10.1007/s00384-003-0553-5. [DOI] [PubMed] [Google Scholar]
- 12.Brass N, Racz A, Bauer C, et al. Role of amplified genes in the production of autoantibodies. Blood. 1999;93:2158–66. [PubMed] [Google Scholar]
- 13.Scanlan MJ, Gout I, Gordon CM, et al. Humoral immunity to human breast cancer: antigen definition and quantitative analysis of mRNA expression. Cancer Immun. 2001;1:4. [PubMed] [Google Scholar]
- 14.Chen YT, Scanlan MJ, Sahin U, et al. A testicular antigen aberrantly expressed in human cancers detected by autologous antibody screening. Proc Natl Acad Sci U S A. 1997;94:1914–8. doi: 10.1073/pnas.94.5.1914. [DOI] [PMC free article] [PubMed] [Google Scholar]
- 15.Jager D, Stockert E, Gure AO, et al. Identification of a tissue-specific putative transcription factor in breast tissue by serological screening of a breast cancer library. Cancer Res. 2001;61:2055–61. [PubMed] [Google Scholar]
- 16.Boon T, van der BP. Human tumor antigens recognized by T lymphocytes. J Exp Med. 1996;183:725–9. doi: 10.1084/jem.183.3.725. [DOI] [PMC free article] [PubMed] [Google Scholar]
- 17.Sahin U, Tureci O, Schmitt H, et al. Human neoplasms elicit multiple specific immune responses in the autologous host. Proc Natl Acad Sci U S A. 1995;92:11810–3. doi: 10.1073/pnas.92.25.11810. [DOI] [PMC free article] [PubMed] [Google Scholar]
- 18.Jager E, Stockert E, Zidianakis Z, et al. Humoral immune responses of cancer patients against “cancer-testis” antigen NY-ESO-1: correlation with clinical events. Int J Cancer. 1999;84:506–10. doi: 10.1002/(sici)1097-0215(19991022)84:5<506::aid-ijc10>3.0.co;2-6. [DOI] [PubMed] [Google Scholar]
- 19.Petricoin EF, Ardekani AM, Hitt BA, et al. Use of proteomic patterns in serum to identify ovarian cancer. Lancet. 2002;359:572–7. doi: 10.1016/S0140-6736(02)07746-2. [DOI] [PubMed] [Google Scholar]
- 20.Diamandis EP. Proteomic patterns in serum and identification of ovarian cancer. Lancet. 2002;360:170. doi: 10.1016/s0140-6736(02)09390-x. [DOI] [PubMed] [Google Scholar]
- 21.Elwood M. Proteomic patterns in serum and identification of ovarian cancer. Lancet. 2002;360:170. doi: 10.1016/S0140-6736(02)09389-3. [DOI] [PubMed] [Google Scholar]
- 22.Pearl DC. Proteomic patterns in serum and identification of ovarian cancer. Lancet. 2002;360:169–70. doi: 10.1016/S0140-6736(02)09388-1. [DOI] [PubMed] [Google Scholar]
- 23.Petricoin EF, Mills GB, Kohn EC, et al. Proteomic patterns in serum and identification of ovarian cancer—reply. Lancet. 2002;360:170–1. [Google Scholar]
- 24.Rockhill B. Proteomic patterns in serum and identification of ovarian cancer. Lancet. 2002;360:169. doi: 10.1016/S0140-6736(02)09387-X. [DOI] [PubMed] [Google Scholar]
- 25.Diamandis EP. Analysis of serum proteomic patterns for early cancer diagnosis: drawing attention to potential problems. J Natl Cancer Inst. 2004;96:353–6. doi: 10.1093/jnci/djh056. [DOI] [PubMed] [Google Scholar]
- 26.R Development Core Team. R: a language and environment for statistical computing. Vienna (Austria): Foundation for Statistical Computing; 2004. Available from: http://www.r-project.org/ [Google Scholar]
- 27.Symth GK. Linear models and empirical Bayes methods for assessing differential expression in microarray experiments. Stat Appl Genet Mol Biol. 2004;3 doi: 10.2202/1544-6115.1027. Article 3. [DOI] [PubMed] [Google Scholar]
- 28.Carey V. ROC: utilities for ROC, with uarray focus; R package version 1.0.13. 2004 Available from: http://www.bioconductor.org.
- 29.Venables WN, Ripley BD. Modern applied statistics with S. 4. New York: Springer; 2002. [Google Scholar]
- 30.Pepe MS, Longton G, Anderson GL, et al. Selecting differentially expressed genes from microarray experiments. Biometrics. 2003;59:133–42. doi: 10.1111/1541-0420.00016. [DOI] [PubMed] [Google Scholar]
- 31.Dodd LE, Pepe MS. Partial AUC estimation and regression. Biometrics. 2003;59:614–23. doi: 10.1111/1541-0420.00071. [DOI] [PubMed] [Google Scholar]
- 32.Ali-Fehmi R, Che M, Khalifeh I, et al. The effect of cyclooxygenase-2 expression on tumor vascularity in advanced stage ovarian serous carcinoma. Cancer. 2003;98:1423–9. doi: 10.1002/cncr.11650. [DOI] [PubMed] [Google Scholar]
- 33.Reid MC, Lane DA, Feinstein AR. Academic calculations versus clinical judgments: practicing physicians’ use of quantitative measures of test accuracy. Am J Med. 1998;104:374–80. doi: 10.1016/s0002-9343(98)00054-0. [DOI] [PubMed] [Google Scholar]
- 34.Liede A, Karlan BY, Baldwin RL, et al. Cancer incidence in a population of Jewish women at risk of ovarian cancer. J Clin Oncol. 2002;20:1570–7. doi: 10.1200/JCO.2002.20.6.1570. [DOI] [PubMed] [Google Scholar]
- 35.Sonoda K, Nakashima M, Kaku T, et al. A novel tumor-associated antigen expressed in human uterine and ovarian carcinomas. Cancer. 1996;77:1501–9. doi: 10.1002/(SICI)1097-0142(19960415)77:8<1501::AID-CNCR12>3.0.CO;2-3. [DOI] [PubMed] [Google Scholar]
- 36.Horii A, Nakatsuru S, Ichii S, et al. Multiple forms of the APC gene transcripts and their tissue-specific expression. Hum Mol Genet. 1993;2:283–7. doi: 10.1093/hmg/2.3.283. [DOI] [PubMed] [Google Scholar]
- 37.Shtivelman E, Cohen FE, Bishop JM. A human gene (AHNAK) encoding an unusually large protein with a 1.2-microns polyionic rod structure. Proc Natl Acad Sci U S A. 1992;89:5472–6. doi: 10.1073/pnas.89.12.5472. [DOI] [PMC free article] [PubMed] [Google Scholar]
- 38.Richardson RT, Bencic DC, O’Rand MG. Comparison of mouse and human NASP genes and expression in human transformed and tumor cell lines. Gene. 2001;274:67–75. doi: 10.1016/s0378-1119(01)00605-9. [DOI] [PubMed] [Google Scholar]
- 39.Vaarala MH, Porvari KS, Kyllonen AP, et al. Several genes encoding ribosomal proteins are over-expressed in prostate-cancer cell lines: confirmation of L7a and L37 over-expression in prostate-cancer tissue samples. Int J Cancer. 1998;78:27–32. doi: 10.1002/(sici)1097-0215(19980925)78:1<27::aid-ijc6>3.0.co;2-z. [DOI] [PubMed] [Google Scholar]
- 40.Tessitore A, Biordi L, Flati V, et al. New mutations and protein variants of NBS1 are identified in cancer cell lines. Genes Chromosomes Cancer. 2003;36:198–204. doi: 10.1002/gcc.10145. [DOI] [PubMed] [Google Scholar]
- 41.Caraglia M, Tagliaferri P, Budillon A, et al. Post-translational modifications of eukaryotic initiation factor-5A (eIF-5A) as a new target for anti-cancer therapy. Adv Exp Med Biol. 1999;472:187–98. doi: 10.1007/978-1-4757-3230-6_16. [DOI] [PubMed] [Google Scholar]
- 42.Guan XY, Sham JS, Tang TC, et al. Isolation of a novel candidate oncogene within a frequently amplified region at 3q26 in ovarian cancer. Cancer Res. 2001;61:3806–9. [PubMed] [Google Scholar]
- 43.Scanlan MJ, Welt S, Gordon CM, et al. Cancer-related serological recognition of human colon cancer: identification of potential diagnostic and immunotherapeutic targets. Cancer Res. 2002;62:4041–7. [PubMed] [Google Scholar]
- 44.Ota T, Suzuki Y, Nishikawa T, et al. Complete sequencing and characterization of 21,243 full-length human cDNAs. Nat Genet. 2004;36:40–5. doi: 10.1038/ng1285. [DOI] [PubMed] [Google Scholar]
- 45.Brichory F, Beer D, Le Naour F, et al. Proteomics-based identification of protein gene product 9.5 as a tumor antigen that induces a humoral immune response in lung cancer. Cancer Res. 2001;61:7908–12. [PubMed] [Google Scholar]
- 46.Hiraoka K, Hida Y, Miyamoto M, et al. High expression of tumor-associated antigen RCAS1 in pancreatic ductal adenocarcinoma is an unfavorable prognostic marker. Int J Cancer. 2002;99:418–23. doi: 10.1002/ijc.10381. [DOI] [PubMed] [Google Scholar]
- 47.Rousseau J, Tetu B, Caron D, et al. RCAS1 is associated with ductal breast cancer progression. Biochem Biophys Res Commun. 2002;293:1544–9. doi: 10.1016/S0006-291X(02)00401-1. [DOI] [PubMed] [Google Scholar]
- 48.Geysen HM, Rodda SJ, Mason TJ. A priori delineation of a peptide which mimics a discontinuous antigenic determinant. Mol Immunol. 1986;23:709–15. doi: 10.1016/0161-5890(86)90081-7. [DOI] [PubMed] [Google Scholar]
- 49.Popkov M, Sidrac-Ghali S, Alakhov V, et al. Epitope-specific antibody response to HT-1080 fibrosarcoma cells by mimotope immunization. Clin Cancer Res. 2000;6:3629–35. [PubMed] [Google Scholar]
- 50.Draghici S, Chatterjee M, Tainsky M. Epitomics: serum screening for the early detection of cancer on microarrays using complex panels of tumor antigens. Expert Rev Mol Diagn. 2005;5:735–43. doi: 10.1586/14737159.5.5.735. [DOI] [PubMed] [Google Scholar]
Associated Data
This section collects any data citations, data availability statements, or supplementary materials included in this article.
Supplementary Materials
Note: Supplementary data for this article are available at Cancer Research Online (http://cancerres.aacrjournals.org/).