

Abstract
Skeletal and smooth muscle tropomyosin (Tm) require acetylation of their N termini to bind strongly to actin. Tm containing an N-terminal alanine serine (AS) extension to mimic acetylation, has been widely used to increase binding. The current study investigates the ability of an N-terminal AS extension to mimic native acetylation for both αα and ββ smooth Tm homodimers. We show that :1) ASα-Tm binds actin 100 fold tighter than α-Tm, and 2 fold tighter than native smooth αβ-Tm; 2) β-Tm requires an AS extension to bind actin; 3) ASβ-Tm binds actin 10 fold weaker than ASα-Tm. Tm is present in smooth muscle tissues as >95% heterodimer, therefore we studied the binding of recombinant αβ heterodimers with different AS extensions. This study shows that recombinant Tm requires an AS extension on both α and β chains to bind like native Tm and that the α chain contributes more to actin binding than the β chain. Once assembled onto an actin filament all smooth muscle Tms regulate S1 binding to actin Tm in the same way, irrespective of the presence of an AS extension.
Tropomyosin (Tm) is an actin binding, α-helical, coiled coil protein dimer which binds along the length of actin filaments in both muscle and non-muscle cells, and thus cooperatively regulates the interaction of actin with myosin heads. Muscle cells contain Tm expressed via two genes Tm1 and Tm2 (α and β), and isoform diversity (smooth and skeletal) results from the alternative splicing of the two genes. Each monomer of the dimer coiled-coil contains 284 amino acid residues (1-3).
In skeletal muscle tissue Tm is present predominantly as a mixture of αβ heterodimer and αα homodimer (4-6). ββ is less stable and is much less common in muscle tissues (5,6). Studies involving guanidinium hydrochloride dissociation of native homodimer chains and anion exchange chromatography have shown that smooth muscle contains roughly equal amounts of α and β chains, more than 95% of which is present as heterodimer (7-9). Thermal unfolding studies also show that the heterodimer is preferentially formed at temperatures below its unfolding transition (9). Preference of the heterodimer is not fully understood, however viscosity and thermal unfolding measurements indicate that the strength of the end-to-end interaction of the smooth αβ heterodimer is much higher than that of the αα and ββ homodimers which have about the same strength of end-to-end interaction (7, 8,10). The strength of end-to-end interactions in the heterodimer might affect the cooperative behaviour of the tropomyosin, and thus might provide a functional advantage for the predominance of heterodimer in native smooth muscle. The ability to be able to assemble in vitro heterodimers would be very valuable. Such ability could be used to monitor the behaviour of a single α or β chain on the dimer via either mutation or labelling. The current study investigates the properties of heterologously expressed and assembled heterodimers, including actin binding and the regulation of S1 binding to actin.
Skeletal and smooth muscle Tm require acetylation of its N terminus in order to bind strongly to actin, and thus regulate muscle contraction (11, 12). The precise mechanism by which this acetylation mediates actin binding is not fully understood, but it is known that the end-to-end Tm-Tm contacts are essential for the process and that these contacts are stronger in smTm than in skTm. Recent structural data for the striated Tm has shed more light on the nature of the overlap region between neighbouring Tms. The coiled-coil at C-terminal region of the dimer is splayed approximately over the last 10 amino acids, whilst the N terminus maintains its coiled-coil structure, provided the N-terminus is acetylated (13, 14). This allows the N-terminus to “slot” inside the C-terminus, thus enabling the polymerisation of Tm into filaments (15). The presence of an acetyl group at the N-terminus or an extension to the sequence has been shown to be essential for maintaining the coiled-coil structure in this region (11).
Expression of recombinant Tm in the bacteria E.coli is easily undertaken, and has the advantage of obtaining high yields, quickly. The alternative is expression in insect cells which can produce expression levels of 120-200 mg/L of infected cells using special enhancer sequences(16). E.coli cells are prokaryotic, and thus generally do not acetylate the N-terminus of eukaryotic proteins although there are exceptions (17). Tm expressed in E.coli is not acetylated and will be largely inactive (14, 18). Tm containing an N-terminal alanine serine (AS) extension to mimic acetylation, has been devised and shown to restore activity for skeletal Tm (19, 20). The current study is designed to investigate the efficacy of the N-terminal AS extension as a mimic of native acetylation for both α and β-SmTm. This study identifies the importance of acetylation and the AS extension in smooth muscle Tm/actin binding, and the regulation of S1 binding to actin via the comparison of the bacterially expressed AS-SmTm's with naturally acetylated Tm from chicken gizzard.
Experimental Procedures
Construction of Vectors for Expression of Tm
Plasmid vectors for the expression of chicken gizzard ASα-Tm, and α-Tm, were constructed as described in (21). ASβ-Tm and β-Tm were constructed by cloning NdeI /BamHI purified, digested PCR-amplified fragments into the NdeI /BamHI restriction sites of the pJC20 expression vector. PCR was carried out using the pAED4-91 vector construct as the template. ASα-Tm and ASβ-Tm contain the chicken gizzard α-tropomyosin and β-tropomyosin genes cloned in pJC20, and express Tm containing an N-terminal Met-Ala-Ser (ASTm). The N-terminal Met is removed post-translationally. α-Tm and β-Tm contain the chicken gizzard α-tropomyosin and β-tropomyosin genes cloned in pJC20, and express. DNA was sequenced to ensure fidelity of the PCR amplification. The following nucleotides were used in the PCR reactions for the construction of ASβ-Tm and β-Tm.
AS-Forward chk βTm
5′ GGA ATT CCA TAT GGC GAG CAT GGA GGC CAT CAA GAA GAA GAT GC 3′
Forward chk βTm
5′ GGA ATT CCA TAT GGA GGC CAT CAA GAA GAA GAT GC 3′
Reverse chk βTm
5′ CGC GGA TCC TCA GAG GTT GTT CAG CTC CAG CAA GGT CTG G 3′
Preparation of Proteins
Native chicken gizzard tropomyosin was prepared as described previously (22). Tm was further purified by ammonium sulphate fractionation and anion exchange chromatography on DEAE-cellulose.
Recombinant ASα-Tm, αTm, ASβ-Tm and β-Tm were expressed in bacteria (strain BL21 DE3). 1L cultures were grown to exponential phase and induced for 3 h with 100 mg/L IPTG. Cells were harvested and resuspended in 30 ml cold lysis buffer (20 mM Tris pH 7.5, 100 mM NaCl, 2 mM EGTA and 5 mM MgCl2) and lysed by sonication. The majority of E.coli proteins were precipitated by heating to 80°C for 10 min. The precipitated protein and cell debris were then removed by centrifugation. The soluble Tm was then isoelectrically precipitated at pH 4.5. The precipitate was pelleted and resuspended in 10-20 ml (dependent upon yield) running buffer (10 mM PO4- pH 7.0, 100 mM NaCl) with 10 mg/l DNase and 10 mg/L RNase and incubated at 4°C for 2 h. The Tm was then further purified using 2 × 5 ml Pharmacia HiTrap-Q columns in tandem, eluted with a 100- 900 mM NaCl gradient, the Tm eluting at ∼250- 350 mM NaCl. Fractions were analyzed by SDS-PAGE, pooled, and concentrated by isoelectric precipitation. Protein concentrations were determined by their absorbance at 280 nm using a molar extinction coefficient E280nm of 8,400 M-1 cm-1 for α-Tm, and 11,200 M-1 cm-1 for β-Tm, for the dimer in 5 mM Tris HCl buffer pH 7.0, respectively.
Preparation of Tm Heterodimers
α/β-Tm heterodimers were prepared using the method described in (8). Separate samples of α-Tm and β-Tm homodimers were heated to 65°C in the presence of 20 mM DTT to ensure reduction of the cysteine side chains (C190 in α-Tm and C36 in β-Tm) in a buffer of 20 mM MOPS, 500 mM KCl and 5 mM MgCl2 pH 7.0. Equimolar quantities of homodimers were then mixed at 65°C, allowed to cool to 37°C, and incubated for ∼2 hrs to allow dimer formation. For smTm it has been shown that the heterodimer is preferentially assembled (9,10) and this can be confirmed by examining the ability to form Cys-Cys cross links between the two chains of Tm. α and β Tm each have a single Cys (Cys-190 in α-Tm and Cys-36 in β-Tm) and under oxidising conditions inter chain cross links will be formed in the homodimers. For the αβ heterodimer the two cysteines are remote from each other and no cross links will form. A sample of the Tm mixture was used in the assay, DTT was removed via a Bio Rad Econo-Pac 10DG desalting column before treating the mixture with Cu2+ K3Fe(CN)6 at 20° C for 1.5 hrs to catalyse the cys oxidation. The presence of dimer was determined via non-reducing SDS-PAGE performed using 12.5% acrylamide gels stained with Coomassie Blue G-250.
Myosin Subfragment 1 (S1) was prepared by chymotryptic digestion of rabbit myosin as described in (23)
Rabbit skeletal actin was purified by the method described in (24). Its molar concentration was determined from its absorbance at 280 nm using an E1% of 1.104 cm-1 and a molecular mass of 42 000 Da. The preparation of pyrene labelled actin (pyr-actin) was as previously described in (25). F-actin was stabilised with phalloidin by incubating a solution of 10 μM pyr-actin with 10 μM phalloidin overnight in 20 mM MOPS, 100 mM KCl, 5 mM MgCl2, pH 7.0 at 4°C.
Cosedimentation and quantitative electrophoresis
Cosedimentation assays were performed at 20°C by mixing 10 μM of actin with increasing concentrations of Tm, in the standard experimental buffer (20 mM MOPS, 100 mM KCl, 5 mM MgCl2, pH 7.0), to a total volume of 100 μl. The actin was then pelleted along with any bound Tm by ultracentrifugation at 100,000 rpm for 20 min (Beckman Instruments TLA-100.1). Equivalent samples of pellet and supernatant were then separated by SDS-PAGE. Quantification of proteins was carried out using an Epson Perfection 1640SU scanner with a transparency adaptor attached to a PC. Scanned images were analyzed using the image-PC programme (Scion Corp., Frederick, USA).
Fluorescence Titrations
Fluorescence titrations were measured at 20°C using a Perkin Elmer Life Sciences 50B Spectrofluorimeter with excitation at 365 nm with a 10 nm band width and measuring emission at 405 nm with a 15 nm band width. A total working volume of 2 ml was used in a 10 × 10 mm cell constantly stirred using a magnetic stirrer below the light path of the instrument. Autotitrations were made by the continuous addition of a 5 μM S1 stock solution at a rate of 12 μl/min, using a Harvard Apparatus Syringe Infusion Pump 22, driving a 100 μl glass syringe (Hamilton). Data was acquired over a period of 250 s, with data points being collected every 0.5 s, using an integration time of 0.45 s. Buffer solutions for the titrations were as previously described, and were filtered using a 0.22 μM disposable syringe filter to remove dust particles that can produce significant noise in the stirred cell at the low levels of sample fluorescence used. Cooperative binding curves from the titrations were fitted using a 2-state version of the McKillop and Geeves model (Equation 1) with a varying cooperative unit size (26, 27).
| Equation 1 |
| Equation 2 |
where θ represents the fraction of total actin sites occupied; [M] is the concentration of free S1 heads; n is the cooperative unit size; P = 1 + K1[M](1 + K2) and Q = 1 + K1[M]. KT defines the equilibrium between the closed, C-state where only weak myosin binding is possible and the open, M-state that allows rigor like binding. The fluoresence signal (F) is related to θ through eqn 2 in which F0 is the initial fluorescence before addition of S1 and F∞ is the fluorescence at saturation with S1.
Results
Affinity of AS Tropomyosin for Actin
The affinity of ASα-Tm, α-Tm, ASβ-Tm and β-Tm for actin was measured and compared to native Tm using a cosedimentation assay. An example of an SDS-PAGE gel used for determining binding affinities is illustrated in figure 1. The two gels show an experiment involving the β-Tm protein. The top gel shows the supernatants and the bottom gel the pellets from the cosedimentation. Each sample contains 10 μM actin incubated with increasing concentrations of Tm from 0.5 μM (lane 1) to 7 μM (lane 8). In both gels actin is the upper band and the density of this band remains practically constant in all the samples, with the majority of the actin appearing in the pellet as expected (lanes 1-8). The lower band on both gels is Tm, and the optical density of the Tm band increases from the lowest Tm concentration sample (lane 1) to the highest Tm concentration sample (lane 8). The fraction of Tm bound to actin was estimated from the density of the bands in 1A and plotted in Fig 1B against the free Tm concentration. The ratio of the optical densities of the two bands in the pellet samples was 0.4 for a fully saturated actin filament which corresponds to a binding stoichiometry of 7 actins for each Tm bound. The K50% values were determined after fitting the curves with the Hill equation (Equation 3) and the values are given in table 1.
Figure 1. Sedimentation assay of tropomyosin binding to actin.
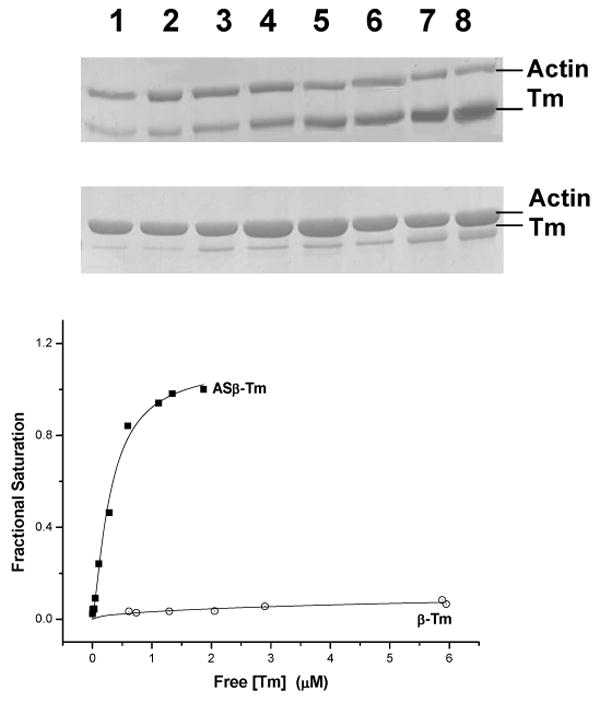
A) 10 μM actin and different β-Tm concentrations (0.5 – 7.0 μM) were spun at 100000 g and the supernatants (upper gel) and pellets (lower gel) analysed by SDS-PAGE.
B) Analysis of the fraction of β-Tm binding to actin from the relative band densities Binding constants (K50%).the fraction of Tm bound to actin was estimated from the density of the bands in the pellet and plotted against the free Tm concentration. The fitted line is the least squares best-fit to the Hill Equation. Conditions: 100 mM KCl, 5 mM MgCl2, 20 mM MOPS, pH 7.0, 20° C.
Table 1. Dissociation constants for the α & β Tm constructs with and without the AS-extension.
K50% values and the Hill cooefficient (h) were calculated via the Hill Equation from the Tm/actin binding plot featured in fig. 1 and were measured from the best fit to the Hill equation as the free Tm concentration at which the actin filament is half saturated by Tm. The errors on the fits to the data were all less than 10% of the value for K50% but much larger for h; 15-30% for values of 1-1.5 and 30-50% for values above 1.5. Thus differences in the values of h are not significant. KT and n values were obtained from the fit of the sigmoid titration curves to the 2-state model of McKillop and Geeves.
| Tm | K50% (μM) | h | KT | n |
|---|---|---|---|---|
| ASα-Tm | 0.035 | 2.65 | 0.1-0.25 | 5-9 |
| α-Tm | 2.22 | 1.42 | 0.12 | 5-9 |
| ASβ-Tm | 0.30 | 1.33 | 0.05-0.15 | 5-9 |
| β-Tm | >20 | - | ND | ND |
| ASα/ASβ-Tm | 0.03 | 3.05 | 0.1-0.25 | 5-9 |
| Native Gizzard Tm | 0.04 | 1.37 | 0.1-0.3 | 5-9 |
| Sk ASα-Tm | 0.18* | 2.05 | 0.1+ | 7+ |
| Sk ASβ-Tm | 0.23* | 1.6 | ND | ND |
Data from Boussouf et al submitted. The affinities without an AS extension were > 20 μM
Data from Maytum et al 2001 [KCl] 200 mM
ND not determined
| Equation 3 |
Where h is the Hill coefficient, θ is the fractional saturation of actin with Tm, and K50% is the Tm concentration required for 50% saturation of actin.
The Tm's containing the N terminal AS extension, which is added to mimic acetylation bind with much greater affinity (> than 100 fold) than the equivalent proteins containing no AS extension. ASα-Tm binds to actin with an affinity (K50% = 35 nM) which is similar to native Tm (K50% = 40 nM), thus suggesting that the N terminal AS extension is a good mimic for N terminal acetylation in the smTm system. ASβ-Tm had an affinity (K50% 300 nM) which is 10 times weaker than the ASα-Tm. In contrast,β-Tm did not show any significant binding to actin, therefore K50% is greater than 20 μM again demonstrating the importance of the N-terminal acetylation and the equivalence of the AS extension.
Regulation of S1 binding to pyr-actin by AS-Tm
Titration of the fluorescent pyrene labeled actin with S1 was used under equilibrium binding conditions to assess whether the expressed Tms regulate the binding of S1 to actin. Figure 2 shows the raw titration curves in which 5 μM S1 is continuously titrated into a cuvette containing 50 nM phalloidin stabilised pyrene actin, saturated with Tm (2 μM added). The sigmoidal shapes of the curves show Tm regulates S1 binding to actin. These curves were fitted to a 2-state version of the 3-state model. The value of K2 (the rigor isomerisation) has previously been determined to be 200, K1 (the weak binding) was seen to be ∼1.8 × 10⁵ s-1 M-1 for all the reconstituted filaments. The shape of the curves is therefore defined by the value of KT ([M]/[C] equilibrium), and n (the apparent cooperative unit size). Note that the values of KT and n are not independent; equivalent fits indistinguishable from the data can be obtained with a range of n and KT values which are indicated in Table 1. Larger values of n require smaller values of KT. Table 1 shows the KT values that were measured for each Tm after fitting to the 2-state model. The range of values given in Table 1 for native Tm are in the same range as those previously reported (28). However, at the lower KCl concentration used here to ensure binding of the non-AS Tm to actin the resolution of the parameters in the fit is not as precise as previously reported.
Figure 2.

Fluorescence titration of pyrene actin by S1 in 50 nM pyrene actin plus 2 μM native (dots) and ASα- ASβTm (dashes) titrated with S1 between 0 and 250 nM. The data was fitted to the 2-state cooperative binding model with the fits superimposed as a solid line on the raw data. Fitted parameters are given in Table 1. Conditions: 100 mM KCl, 5 mM MgCl2, 20 mM MOPS, pH 7.0, 20° C.
The KT values for the Tms containing the AS extension were similar to that of native Tm, therefore reinforcing the cosedimentation data in suggesting that the AS extension is a good mimic for N terminal acetylation.
Production of Heterodimers
To verify the assembly of heterodimers from the mixture of αα and ββ homodimers, using the conditions described in the materials and methods section, SDS-PAGE was used (figure 3). The presence of αβ heterodimer is confirmed by its inability to be cross-linked. Lane 1 and lane 4 contains the αα and ββ smooth homodimer species which show the presence of crosslinked species (upper band) as well as some uncrosslinked species (lower band). The cross-linking of the homodimer species occurs between the two cysteine residues at position 190 in αα and position 36 for ββ. The formation of αβ from the treated αα/ββ mixture is shown in lanes 3 and 6 (labelled αβ) by the lack of a high molecular band in the upper region of the gel. The heterodimer cannot form disulfide bonds because the single cysteines on each chain are too far apart (at positions 36 and 190). Instead, the presence of 2 bands with slightly different mobility is seen which correspond to α and β monomer chains. Lanes 2 and 5 show the result of treatment of the mixtures of αα+αβ and ββ+αβ. The data indicates that only homodimers can be crosslinked. Thus, a relatively pure sample of αβ smooth tropomyosin heterodimer can be prepared using the protocols described in the materials and methods section. The presence of a small amount of ββ smooth homodimer species present within the αβ smooth heterodimer sample is due to a slight excess of ββ smooth homodimer added before chain exchange. As can be seen below, the ββ smooth homodimer species binds actin with an affinity ∼100 fold weaker than the αβ smooth heterodimer, so that the occurrence of a small amount of ββ smooth homodimer will not significantly affect the binding of the αβ smooth heterodimer species to actin.
Figure 3.
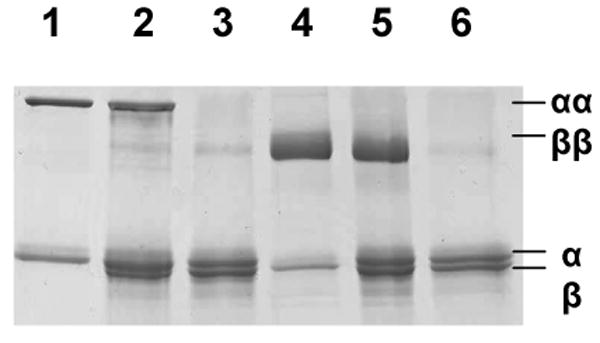
Verification of formation of αβ heterodimers by gel electrophoresis after cross-linking treatment SDS-PAGE of crosslinked Tm dimers run under oxidising conditions. Lane 1, αα homodimer alone; lane 2, a 1:1 mixture of αα homodimer with αβ heterodimer; lane 3, αβ heterodimer; lane 4, ββ homodimer; lane 5, a 1:1 mixture of ββ homodimer with αβ heterodimer; lane 5, αβ heterodimer. All samples were denatured in 20mM DTT at 60°C, left to cool to 37°C before cross-linking at 20°C via a Cu2+catalysed K3Fe(CN)6 reaction.
Heterodimers expressing different combinations of N-terminal AS extension were also made using the method described above. αβ heterodimers expressing an N-terminal AS extension on the α chain but not the β chain termed ASα-Tm/β-Tm, and an αβ heterodimer expressing an AS extension on the β chain but not the α chain (α-Tm/ASβ-Tm) were made. These heterodimers were then used in cosedimentation assays as described above to measure their actin binding affinity.
Affinity of actin for Tm heterodimers
The binding of αβ-Tm containing different combinations of N-terminal AS extensions to actin was compared to that of native Tm using the cosedimentation assay previously described. Figure 4 plots the cooperative binding curves of ASα-Tm/ASβ-Tm compared to native Tm. These curves were fitted with the Hill equation, and the concentration of free Tm at which half the actin becomes saturated (K50%) was determined. The K50% values obtained (table 2) demonstrate that ASα-Tm/ASβ-Tm binds actin with an affinity which is similar to native Tm. Table 2 also reports the K50% values obtained for αβ-Tm's containing different combinations of N-terminal AS extensions compared to native Tm. The K50% values which were obtained were 540 nM for ASα-Tm/βTm, and 1.21 μM for α-Tm/ASβ-Tm respectively. These results suggest that in order for αβ-Tm to have native like properties, it requires an N-terminal AS extension on both α and β chains. The reduction in the affinity for actin of α-Tm/ASβ-Tm compared to ASα-Tm/β-Tm suggests that the α-chain dominates actin binding however, an N-terminal AS extension on both α and β chains is required for native like actin binding.
Figure 4. Affinities of ASα-Tm/ASβ-Tm (open circles) compared with Native Gizzard Tm (squares) for actin as determined by cosedimentation analysis.

Conditions are the same as described in figure 1.
Table 2. Dissociation constants (K50%) for the ASα-Tm/ASβ-Tm heterodimer compared to heterodimers with a single AS extension.
| Tm | K50% (μM) |
|---|---|
| ASα-Tm/ASβ-Tm | 0.03 |
| ASα-Tm/β-Tm | 0.54 |
| α-Tm/ASβ-Tm | 1.21 |
| Native Gizzard Tm | 0.04 |
Discussion
We have expressed α and β smTm with and without the AS N-terminal extension that has been used as a mimic of the N-terminal acetylation of the native Tm. Acetylation is a requirement for effective binding of Tm to actin (11, 19, 20,). The extent of the affinity change has not been previously documented. Previous studies have used skTm, and there was no detectable binding for the Tm with an unmodified N-terminus (20). SmTm has a higher affinity for actin than skTm (29), and we show here differences of affinity of α-Tm to actin for native, and wild type with and without the AS extension. In the case of the αα homodimers, the AS extension increased the affinity by 100 fold and gave an affinity within a factor of 2 of the affinity of the native αβ-Tm. A similar increase in affinity was seen for the ββ homodimer although the unmodified dimer had an affinity that was too weak to define with any precision. The 100 fold increase in affinity for the AS-extension is consistent with an initiation polymerisation model of Tm binding to actin (30) where the end-to end interactions play a major role in defining the polymerisation of Tm on actin.
Note that the data in Table 1 indicates that the actin affinity of the ASβ-Tm is very similar for both skeletal and smooth muscle isoforms. This is not true for α-isoforms where the smooth muscle ASα-Tm has an actin affinity five times that of the skeletal isoform. Native smooth muscle Tm (αβ) also has a tighter affinity for actin than native skeletal αβ-Tm confirming that the actin affinity is dominated by the α-isoforms in the αβ heterodimers. Alpha and beta Tm isoforms are each derived from a single gene via alternate splicing (2, 3). The alpha isoforms differ at exon 2 and 9, whilst the beta isoforms differ at exon 6 and exon 9 (2, 3). The tighter actin affinity and stronger regulation of sm vs skeletal Tm may result from the exon 9 differences as this appears to affect the Tm-Tm interactions.
We also demonstrate that the AS-smTm can be successfully assembled into αβ heterodimers as has previously been shown for the native protein (8, 9). The αα homodimer and the αβ heterodimer carrying the AS extension have similar affinities to actin (K50%=0.03 μM), which are also similar to the native αβ Tm (K50%=0.04). Using this approach we have assembled heterodimers in which only one of the two chains carries the AS extension; AS α-Tm/β-Tm and α-Tm/AS β-Tm. The absence of the AS on the β-Tm results in a ∼8 fold weaker affinity of the heterodimer for actin, while the absence of AS on the αTm gave a ∼40 fold weaker affinity, only two fold tighter than that for the αα non-AS homodimer. Thus the α-Tm and the AS on the α-Tm dominate the actin binding properties of the heterodimer. Clearly both AS extensions are required to produce native-like actin affinities, but a single AS is sufficient to have a major effect on actin binding. This is consistent with the view that loss of actin binding without acetylation/AS extension is due to charge repulsion between the two +ve charges on the N-terminal amine groups (13). Removal of one charge may be sufficient to eliminate most of the repulsion to allow a native like structure of the N-terminus and Tm-Tn overlap.
The data on the titration with S1 show that once the filament is assembled all of the Tms induce sigmoid binding curves for S1 consistent with Tm occupying one of two states which sterically blocks the site on the thin filament where S1 binds (27, 31). In the McKillop and Geeves model this is called the C-state (closed or calcium induced state) and KT defines the equilibrium between the C-state and the open or myosin induced state. The value of KT and n are of the same order for all of the smTms; αα, ββ, and αβ are all similar and the value of KT is not greatly affected by the presence of the AS extension. All of the Tms are therefore predicted to occupy the same C-state (calcium-induced or closed-state) of the actin filament as seen for native skTm and smTm. Thus, although the AS extension and acetylation has a marked affect on the affinity of the Tm for actin, once assembled the behaviour of Tm on the actin surface is not greatly influenced by the N-terminal modification.
There are significant differences in the way in which skTm and smTm influence S1 binding to actin and analysis of titration curves suggests this is primarily due to greater cooperativity in the filaments (larger n) (29). We have interpreted this as due to stronger Tm-Tm contacts which allows greater communication between actin-Tm structural units (29). The stronger Tm-Tm contacts in smTm also give rise to the tighter affinity of smTm for actin and in the higher viscosity of smTm vs skTm (29). This increase in viscosity is also seen in the difference between AS and unacetylated Tm (20) and supports stronger end to end interactions as the major effect of acetylation/AS extension. This greater cooperativity in smTm is also reflected in actomyosin ATPase and motility data (29). The data presented here demonstrates that the N-terminal modification has a marked affect on binding but little affect on the cooperativity and regulation of S1 binding. This suggests that the increased cooperativity in smTm is not simply a result of stronger Tm-Tm contacts.
This study was only possible because of the high affinity of αα and αβ smTm for actin. Such a study cannot be made for skTm without an N-terminal modification because like ββ-smTm there is no significant binding of skTm (αα, ββ, or αβ) to actin (K50% > 20μM).
Abbreviations
- (AS)
N-terminal alanine-serine extension
- ASα-Tm, α-Tm
alpha smooth tropomyosin
- ASβ-Tm, β-Tm
beta smooth tropomyosin
- S1
myosin subfragment 1
- EGTA
ethylene glycol bis-(β-aminoethyl ether) –N, N′-tetraacetic acid
- MOPS
4-morpholinepropanesulphonic acid
- DTT
dithriothreitol
- SDS
sodium dodecyl sulphate
- PAGE
polyacrylamide gel electrophoresis
- chk bTm
chicken beta smooth tropomyosin
Footnotes
This work was supported by National Institute of Health grant number PO1AR041637
References
- 1.Smillie LB. Structure and functions of tropomyosins from muscle and non-muscle sources. Trends Biochem Sci. 1979;4:151–154. [Google Scholar]
- 2.Lees-Miller JP, Helfman DM. The molecular basis for tropomyosin diversity. Bioessays. 1991;13:429–437. doi: 10.1002/bies.950130902. [DOI] [PubMed] [Google Scholar]
- 3.Perry SV. Vertebrate tropomyosin: distribution, properties and function. J Muscle Res Cell Motil. 2001;22:5–49. doi: 10.1023/a:1010303732441. [DOI] [PubMed] [Google Scholar]
- 4.Eisenberg E, Kielley WW. Troponin-tropomyosin complex. Column chromatographic separation and activity of the three active troponin components with and without tropomyosin present. J Biol Chem. 1974;249:4742–4748. [PubMed] [Google Scholar]
- 5.Lehrer SS. Intramolecular crosslinking of tropomyosin via disulfide bond formation: evidence for chain register. Proc Natl Acad Sci USA. 1975;72:3377–3381. doi: 10.1073/pnas.72.9.3377. [DOI] [PMC free article] [PubMed] [Google Scholar]
- 6.Bronson DD, Schachat FH. Heterogeneity of contractile proteins. Differences in tropomyosin in fast, mixed, and slow skeletal muscles of the rabbit. J Biol Chem. 1982;257:3937–3944. [PubMed] [Google Scholar]
- 7.Sanders C, Burtnik LD, Smillie LB. Native chicken gizzard tropomyosin is predominantly a beta gamma-heterodimer. J Biol Chem. 1986;261:12774–12778. [PubMed] [Google Scholar]
- 8.Jancso A, Graceffa P. Smooth muscle tropomyosin coiled-coil dimers. Subunit composition, assembly and end-to-end interaction. J Biol Chem. 1990;266:5891–5897. [PubMed] [Google Scholar]
- 9.Lehrer SS, Stafford WF. Preferential assembly of the tropomyosin heterodimer: equilibrium studies. Biochemistry. 1991;30:5682–5688. doi: 10.1021/bi00237a007. [DOI] [PubMed] [Google Scholar]
- 10.Lehrer SS, Qian Y. Unfolding/refolding studies of smooth muscle tropomyosin. Evidence for a chain exchange mechanism in the preferential assembly of the native heterodimer. J Biol Chem. 1990;265:1134–1138. [PubMed] [Google Scholar]
- 11.Greenfield NJ, Stafford WF, Hitchcock-Degregori SE. The effect of N-terminal acetylation on the structure of an N-terminal tropomyosin peptide and alpha alpha-tropomyosin. Protein Sci. 1994;3:402–410. doi: 10.1002/pro.5560030304. [DOI] [PMC free article] [PubMed] [Google Scholar]
- 12.Palm T, Greenfield NJ, Hitchcock-Degregori SE. Tropomyosin ends determine the stability and functionality of overlap and troponin T complexes. Biophys J. 2003;84:3181–3189. doi: 10.1016/S0006-3495(03)70042-3. [DOI] [PMC free article] [PubMed] [Google Scholar]
- 13.Brown JH, Kim KH, Jun G, Greenfield NJ, Dominguez R, Volkmann N, Hitchcock-Degregori SE, Cohen C. Deciphering the design of the tropomyosin molecule. Proc Natl Acad Sci. 2001;98:8496–8501. doi: 10.1073/pnas.131219198. [DOI] [PMC free article] [PubMed] [Google Scholar]
- 14.Kluwe L, Maeda K, Miegel A, Fujita-Becker S, Maeda Y, Talbo G, Houthaeve T, Kellner R. Rabbit skeletal muscle alpha alpha-tropomyosin expressed in baculovirus-infected insect cells possess the authentic N-terminus structure and functions. J Muscle Res Cell Motil. 1995;16:103–110. doi: 10.1007/BF00122528. [DOI] [PubMed] [Google Scholar]
- 15.Greenfield NJ, Huang YJ, Swapna GVT, Rapp B, Bhattachary A, Montelione GT, Hitchcock-Degregori SE. NMR solution structure of the N-terminal/C-terminal interface of tropomyosin. Biophys J. 2006;90 [Google Scholar]
- 16.Sano K, Maeda K, Oki M, Maeda Y. Enhancement of protein expression in insect cells by a lobster tropomyosin cDNA leader sequence. FEBS Lett. 2002;532:143–146. doi: 10.1016/s0014-5793(02)03659-1. [DOI] [PubMed] [Google Scholar]
- 17.Saijo Y, Takeda S, Scherer A, Kobayashi T, Maeda Y, Taniguchi H, Yao M, Wakatsuki S. Production, crystallisation and preliminary X-ray analysis of rabbit skeletal muscle troponin complex consisting of troponin C and fragment (1-47) of troponin I. Protein Sci. 1997;6:916–918. doi: 10.1002/pro.5560060420. [DOI] [PMC free article] [PubMed] [Google Scholar]
- 18.Hitchcock-Degregori SE, Heald RW. Altered actin and troponin binding of amino-terminal variants of chicken striated muscle alpha-tropomyosin expressed in Escherichia coli. J Biol Chem. 1987;262:9730–9735. [PubMed] [Google Scholar]
- 19.Heald RW, Hitchcock-Degregori SE. The structure of the amino terminus of tropomyosin is critical for binding to actin in the absence and presence of troponin. J Biol Chem. 1988;263:5254–5259. [PubMed] [Google Scholar]
- 20.Monteiro PB, Lataro RC, Ferro JA, Reinach F de C. Functional alpha-tropomyosin produced in Escherichia coli. A dipeptide extension can substitute the amino-terminal acetyl group. J Biol Chem. 1994;269:10461–10466. [PubMed] [Google Scholar]
- 21.Kremneva E, Nikolaeva O, Maytum R, Arutyunyan AM, Kleimenov SY, Geeves MA, Levitsky DI. Thermal unfolding of smooth muscle and nonmuscle tropomyosin alpha-homodimers with alternatively spliced exons. FEBS J. 2006;273:588–600. doi: 10.1111/j.1742-4658.2005.05092.x. [DOI] [PubMed] [Google Scholar]
- 22.Graceffa P. Evidence for interaction between smooth muscle tropomyosin and caldesmon. FEBS lett. 1987;218:139–142. doi: 10.1016/0014-5793(87)81034-7. [DOI] [PubMed] [Google Scholar]
- 23.Weeds AG, Taylor RS. Separation of subfragment-1 isoenzymes from rabbit skeletal muscle myosin. Nature. 1975;257:54–56. doi: 10.1038/257054a0. [DOI] [PubMed] [Google Scholar]
- 24.Spudich JA, Watt S. The regulation of rabbit skeletal muscle contraction. I. Biochemical studies of the interaction of the tropomyosin-troponin complex with actin and the proteolytic fragments of myosin. J Biol Chem. 1971;246:4866–4871. [PubMed] [Google Scholar]
- 25.Cooper JA. Effects of cytochalasin and phalloidin on actin. J Cell Biol. 1987;105:1473–1478. doi: 10.1083/jcb.105.4.1473. [DOI] [PMC free article] [PubMed] [Google Scholar]
- 26.McKillop DF, Geeves MA. Regulation of the interaction between actin and myosin subfragment 1: Evidence for three states of the thin filament. Biophys J. 1993;65:693–701. doi: 10.1016/S0006-3495(93)81110-X. [DOI] [PMC free article] [PubMed] [Google Scholar]
- 27.Maytum R, Lehrer SS, Geeves MA. Cooperativity and switching within the three-state model of muscle regulation. Biochemistry. 1999;38:1102–1110. doi: 10.1021/bi981603e. [DOI] [PubMed] [Google Scholar]
- 28.Maytum R, Konrad M, Lehrer SS, Geeves MA. Regulatory properties of tropomyosin effects of length, isoform, and N-terminal sequence. Biochemistry. 2001;40:7334–41. doi: 10.1021/bi010072i. [DOI] [PubMed] [Google Scholar]
- 29.Lehrer SS, Golitsina NL, Geeves MA. Actin-tropomyosin activation of myosin subfragment 1 ATPase and thin filament cooperativity, The role of tropomyosin flexibility and end-to-end interactions. Biochemistry. 1997;36:13449–13454. doi: 10.1021/bi971568w. [DOI] [PubMed] [Google Scholar]
- 30.Wegner A. Equilibrium of the actin-tropomyosin interaction. J Mol Biol. 1979;131:839–853. doi: 10.1016/0022-2836(79)90204-3. [DOI] [PubMed] [Google Scholar]
- 31.Lehman W, Craig R. Crossbridge and tropomyosin positions observed in native, interacting thick and thin filaments. J Mol Biol. 2001;311:1027–1036. doi: 10.1006/jmbi.2001.4897. [DOI] [PubMed] [Google Scholar]