

Abstract
Thermodynamic analysis of urea-biopolymer interactions and urea effects on folding of proteins and α-helical peptides shows that urea interacts primarily with polar amide surface. Urea is therefore predicted to be a quantitative probe of coupled folding, remodeling and other large-scale changes in the amount of water-accessible polar amide surface in protein processes. A parallel analysis indicates that glycine betaine (N,N,N-trimethyl glycine; GB) can be used to detect burial or exposure of anionic (carboxylate, phosphate) biopolymer surface. To test these predictions, we have investigated the effects of these solutes (0 to 3 molal) on the formation of 1:1 complexes between lac repressor (LacI) and its symmetric operator site (SymL) at constant KCl molality. Urea reduces the binding constant KTO (initial slope dln KTO/dmurea = −1.7 ± 0.2) and GB increases KTO (initial slope dln KTO/dmGB = + 2.1 ± 0.2). For both solutes, this derivative decreases with increasing solute concentration.
Analysis of these initial slopes predicts that (1.5 ± 0.3) × 103 Å2 of polar amide surface and (4.5 ± 1.0) × 102 Å2 of anionic surface are buried in the association process. Analysis of published structural data, together with modeling of unfolded regions of free LacI as extended chains, indicates that 1.5 × 10³ Å2 of polar amide surface and 6.3 × 10² Å2 of anionic surface are buried in complexation. Quantitative agreement between structural and thermodynamic results is obtained for amide surface (urea); for anionic surface (GB), the experimental value is ~70% of the structural value. For LacI-SymL binding, two thirds of the structurally-predicted change in amide surface (1.0 × 10³ Å2) occurs outside the protein-DNA interface in protein-protein interfaces formed by folding of the hinge helices and interactions of the DNA binding domain (DBD) with the core of repressor. Since urea interacts principally with amide surface, it is particularly well-suited to detect and quantify the extent of coupled folding and other large-scale remodeling events in the steps of protein-nucleic acid interactions and other protein associations.
One of the most intriguing results from analyses of the ever-expanding genome sequence data base has been the discovery of the prevalence of intrinsically disordered regions in proteins (1, 2). These unstructured domains (and sometimes entire protein chains) play key roles in transcription regulation, translation and cellular signal transduction, where folding is coupled to binding and recognition (see (3) for a review and references therein). Thus the very lack of structures in these systems determines function.
Prior to the explosion in sequence information, analysis of available thermodynamic data for protein-ligand, protein-protein and site-specific protein-DNA interactions for which structural information was available foreshadowed the generality of this functional design (4). Comparisons of the observed heat capacity and entropy changes of protein interactions with those predicted from model compound data for formation of a rigid-body interface indicated that large scale folding transitions are often coupled to binding and recognition (4). However, heat capacity changes can have contributions from other coupled processes (see Discussion). NMR, CD and other biophysical techniques provide powerful probes of the dynamic states of free proteins, but many systems are not suitable for such studies. Additionally, conformational changes may occur transiently as part of multi-step mechanisms such as DNA opening in transcription initiation. Thus a current challenge is to find alternative methods for detecting and quantifying these remodeling events in solution in order to relate them to function.
Analysis of the temperature dependence of interactions between lac repressor and various operator sequences (5, 6) led to the proposal that folding was coupled to binding (4) and that the extent of folding was a function of operator sequence (7). NMR and X-ray crystallographic studies confirmed these proposals and elegantly elucidated that the region connecting the DNA recognition element (helix-turn-helix domain) to the core domain of the protein is fundamentally the origin of the transitions detected by biophysical solution studies (8–13). Using this system, we test the hypothesis that urea at non-denaturing concentrations can be used as a quantitative probe of ordering of intrinsically disordered regions and other remodeling events in protein processes.
Precedent for this study is provided by the seminal work of Myers, Pace and Scholtz (14), who observed that the derivative of the protein unfolding free energy change with respect to urea molarity (dΔGounfold/d[urea], defined as the urea m-value) is proportional to the calculated (disulfide-corrected) change in water-accessible surface area (ΔASA). Another important cornerstone for this study is provided by Baldwin and coworkers (15), who determined the per-residue m-value for unfolding of a series of α-helices (repeat unit AEAAKA). Using this per-residue α-helix m-value to estimate contributions from α-helical regions to observed m-values for unfolding of globular proteins, they concluded that the interaction of urea with peptide groups accounted for a major part of the destabilizing effect of urea on these systems. Significantly, ASA analysis reveals that the m-value/ΔASAtotal ratio for unfolding the AEAAKA α-helices is more than three times as large as for unfolding globular proteins (16). Our quantitative analysis of these unfolding data for proteins and α-helical peptides, together with data for interactions of urea with native proteins and DNA, demonstrates that the only significant preferential interaction of urea is with polar amide (N, O) surface (16–18), and is the basis for the determination of its intrinsic interaction coefficient per unit of amide surface (in the Analysis section below).
Typically, as exemplified for lac repressor-lac operator binding (see Results), only a small fraction (5–15%) of the surface buried in the interface of a complex between a protein and duplex DNA is composed of polar amide groups. Therefore the effect of urea concentration on a rigid-body interaction of a protein with duplex DNA or RNA (in which no conformational changes in the protein occur) is predicted to be relatively small. However, polar amide surface constitutes a large fraction (40–60%) of the surface buried in α-helix formation, and a significant fraction (20–30%) of the surface buried in protein folding. Consequently urea is predicted to be particularly suitable as a quantitative probe of α-helix formation and other large-scale folding/remodeling processes coupled to protein-DNA binding or other protein associations.
In the present study, we also test the hypothesis that glycine betaine (GB), which interacts primarily with anionic oxygen surface of proteins and DNA (18, 19), can be used to quantify the amount of this surface buried or exposed in a biopolymer process. For reasons detailed below (see Analysis), GB is not expected to be as unambiguous a probe of changes in ASA of anionic surface as urea appears to be for amide surface, and the experimental value is ~70% of the structural value.
For urea and GB, we obtain and analyze both initial slopes and curvature at higher solute concentrations characterizing the dependence of the standard binding free energy (equivalently the logarithm of the observed binding constant) on solute molality at constant KCl molality. Using osmometric data, we correct these initial slopes from constant KCl molality to constant KCl activity. We summarize the current status of the thermodynamic characterization of interactions of urea and GB with a spectrum of biopolymer surfaces, and obtain values for the intrinsic interaction coefficients (per unit area of the specified type of biopolymer surface and per unit solute molality). Using these intrinsic interaction coefficients, we interpret the initial slopes and curvatures of plots of lnKTO versus molality of urea and of GB to characterize coupled conformational changes and burial of polar amide and anionic surface respectively in the repressor-operator interaction. The agreement between predicted and experimental values of amide surface buried on forming the lac repressor-lac operator DNA interface indicates that urea will be a powerful tool for detecting coupled conformational changes in other protein associations.
MATERIALS AND METHODS
Chemicals
Glycine betaine monohydrate (>99% pure, FW 135.2) was obtained from Sigma (St. Louis, MO). Ultrapure urea (> 99.5% pure, FW 60.06) was obtained from Life Technologies. Glycerol (>99.5% pure, FW 92.09) was obtained from Aldrich (Milwaukee, WI). All other chemicals and enzymes are reagent or molecular biology grade.
Preparation and operator binding activity of lac repressor
Tetrameric lac repressor was purified from the E. coli strain HB101/lac pIQ by the method of (20) and (21) as modified (22, 23). Aliquots of purified repressor were stored at a total protein concentration of 27.1 μM (tetramer) at −70°C in 10 mM HEPES (pH 7.5), 0.1M KCl, 0.1 mM DTT and 30% (v/v) glycerol. Molar concentrations of repressor tetramer were determined from absorbance at 280 nm using the extinction coefficient ε = 9.2 × 10⁴ M−1 cm−1 (24). Working stocks of repressor were prepared by dilution from the −70°C stock to the μM range and stored for up to 10 days at −20° C in10 mM KH2PO4 (pH 7.5), 0.075 M KCl, 0.1 mM DTT and 30% (v/v) glycerol. Activities of these samples, defined as the fraction of active repressor tetramers, were determined from filter binding titrations in the CBLR (complete binding of limiting reagent) regime (25). Activities ranged from 36% to 44%; repressor activity was not significantly affected by urea or GB (tested up to 0.6 m urea and 1.1 m GB (data not shown)), nor by storage at −20°C during use for titrations of a labeled DNA sample (up to 10 days). All concentrations specified in the text are total (active plus inactive) molar concentrations of repressor tetramer.
Preparation of 32P-labeled SymL plasmid DNA
pAS 8-1 (6) plasmid DNA (2514bp), carrying the symmetric 20 base pair SymL (formerly designated Osym) operator (26) and no other operator sites, was isolated from E. coli HB101 using the QIAGEN plasmid purification method and linearized with restriction endonuclease PstI to obtain a centrally-located SymL operator. Linear plasmid DNA was replacement labeled (27) with [32P]dATP and [32P]dCTP (>6000 Ci/mmol), purified as previously described (25), and stored at a concentration of approximately 6 μM at −20°C in TE buffer (10 mM Tris pH 8.0, 1 mM Na2EDTA).
The concentration of 32P -labeled DNA was determined by a novel quantitative fluorescence assay using Gel-Star (Cambrex BioScience RockLand Inc.) stain to detect DNA; this reagent gives lower background, higher sensitivity and broader range of linearity than ethidium bromide. In this assay, fluorescence at 545 nm was measured with excitation at 310 nm in an SLM 8000 spectro-fluorimeter. A standard curve was prepared using DNA standards in the concentration range 0.035 to 0.18 μg/ml (0.11 to 0.53 μM in nucleotide monomer). These standards were prepared by accurate dilutions of a stock solution of known concentration of purified linearized plasmid DNA (3824bp pKOc (28)), first with TE buffer, followed by a 1:20 dilution with a Gel Star solution prepared by 1:5000 dilution of the proprietary Gel Star stock. The concentration of the DNA stock solution was determined from absorbance at 260 nm by UV spectroscopy using ε = 0.02 (μg/ml)−1 cm−1 (27). Concentration determinations for one DNA sample using independently prepared standard curves are reproducible to approximately 5%.
Filter binding assays
The nitrocellulose filter assay for repressor - operator DNA binding (25, 29–33) was used to determine binding isotherms and binding constants (equilibrium concentration quotients) KTO for formation of 1:1 repressor tetramer-operator complexes (TO) as a function of urea or GB molality in binding buffer (BB: 0.010 m K2HPO4, 0.001 m K2EDTA, 0.001 m dithiothreitol (DTT), 0.752 m glycerol, 50 μg/ml bovine serum albumin (BSA); and either 0.189 m or 0.404 m KCl; pH adjusted to 7.3 with concentrated HCl). The K+ concentration of BB (0.212 m or 0.427 m) is the sum of contributions from K2HPO4, K2EDTA and KCl.
For binding studies in the presence of urea or GB, a series of binding buffers with varying molal concentrations (m3) of urea or GB were prepared by adding accurately weighed amounts of solid urea or GB to BB. In the case of urea, this procedure kept the molality of all other solutes constant. For GB, added as the monohydrate, this procedure reduced the molality of K+, glycerol and other constituents in BB by approximately 5% at 3 molal GB. Experimentally-determined values of KTO at each mGB were corrected for the small and opposing effects of the changes in molality of K+ and glycerol. To determine the glycerol correction, complete titrations of operator DNA with repressor at 0.212 m K+ and zero or 1.59 m urea were performed at least twice at zero and 0.752 m glycerol. These data provide an estimate of ∂ ln KTO/∂mglycerol = 1.5 ± 0.5 (23), used here to correct KTO to a constant glycerol concentration (0.752 molal). The log-log [salt] derivative of the LacI-SymL binding constant in the vicinity of 0.4 M KCl (SKTO = −6.3; 30) was used to correct KTO to a constant K+ concentration (0.427 m) as shown in the tabulated values of KTO in supporting information. The calculated (opposing) effects on KTO of the small reductions in K+ and glycerol molality with addition of hydrated GB increase the initial slope dlnKTO/dmGB by only 3%, which is substantially less than the uncertainty in this slope (10%). Repressor and 32P SymL plasmid DNA stocks were serially diluted into BB at the desired solute concentration; dilution factors exceeded 103 except for activity assays, where they exceeded 60, so that solutes in the storage buffer make no significant contribution to the composition of the binding buffer.
In urea, binding isotherms were determined at 0.212 m and 0.427 m K+ (corresponding to KCl concentrations (m4) of 0.189 m and 0.404 m, respectively); in GB, binding isotherms were determined only at ~0.43m K+ because KTO is too large to measure at high mGB in 0.2 m K+. Ranges of solute concentration investigated were 0–3.2 m urea at 0.212 m K+, 0–1.3 m urea at 0.427 m K+ and 0–3.0 m GB at 0.43 m K+. All protein DNA binding experiments were performed at 24°C.
For each forward titration of SymL operator DNA with repressor, 15 sample tubes with the same concentration of 32P labeled SymL operator DNA and increasing concentrations of repressor were equilibrated in binding buffer at a specified concentration of urea or GB for 0.8–2 hr at 24°C. Duplicate aliquots from each sample were then filtered under 250–350 mmHg vacuum through Schleicher & Schuell BA-85 nitrocellulose filters, pretreated as described (25). After filtration, filters were washed once and dried. Cerenkov radiation of each filter was measured in a Beckman LS 1801 scintillation counter. The total radioactivity filtered in each aliquot was measured by counting multiple aliquots of unfiltered reaction mixture. Experiments were carefully designed, based on preliminary results, to obtain data characterizing the entire binding isotherm. At least two independent determinations of the binding isotherm were performed for each solute and salt concentration investigated, with one exception (one isotherm at 1.06 m urea, 0.212 m K+).
The experimentally observed fraction of operator DNA retained on the filter by repressor (θobs) was calculated by eq 1 from the counts per minute (C) retained on the filter for each sample in a repressor titration experiment:
| (1) |
where Cb and Ct are the background and total values of C for a sample. Values of θobs are related to θ, the fractional saturation of operator DNA with repressor by the efficiency E of retention of operator DNA on the filter at saturation with lac repressor:
| (2) |
The efficiency E is invariably less than 1.0 because of DNA damage and/or incomplete retention of preexisting complexes; values of E in the range 0.55 to 0.65 were obtained in this study, and no solute effect on E was observed.
Titrations of a fixed operator DNA concentration with increasing repressor concentration were performed over a range of [SymL]total (0.69–2.5 pM) chosen to be low enough so that even in the initial stages of the titration only 1:1 TO complexes formed (25). Lac repressor tetramer is stable to dissociation in the concentration range investigated (25, 34). The two-site binding model of the repressor tetramer (25, 30) was used to analyze binding isotherms, with the constraint that the two sites are identical at the salt concentrations investigated (equal site binding constants; ks1 = ks2, 30). Using the independently determined protein activity, values of θobs as a function of the total (active plus inactive) molar concentration of lac repressor for each isotherm (15 points) were fitted to the two-site binding model to determine binding constants KTO (=2 ks1) and filter efficiency E for each protein titration experiment. The activity of repressor tetramer was determined by fitting values of the observed fractional saturation of SymL operator DNA (θobs) for a protein titration in the CBLR regime (30) to the two-site model and fixing ks1 ≫ [SymL]total−1.
Data fitting
The fitting program to determine the binding constant KTO from the binding isotherm (25) uses the Newton-Raphson algorithm (35) linked to the non-linear least-squares parameter minimization program NONLIN (36). Multiple linear regression (37) was used to fit the dependences of ln KTO on solute concentration (m3) to second order polynomials and in analysis of thermodynamic data for urea-biopolymer interactions and urea effects on proteins and α helix folding (see Analysis).
Modeling and calculation of changes in water-accessible surface areas
All water-accessible surface areas (ASA) were calculated using ANAREA (38) as previously described (39).
a) Lac Repressor-SymL Operator
For the LacI-SymL interaction, the file 1EFA (40) from the Protein Data Bank (41) was used to calculate rigid-body changes in ASA on forming the LacI-SymL operator complex. This file contains the coordinates for the repressor dimer (lacking only the C-terminal helix required for tetramerization) bound to SymL operator DNA and the anti-inducer orthonitrophenyl fucoside (40). The resolution of the crystal structure is 2.6 Å. No water molecules are bound in the relevant protein-DNA or protein-protein interfaces in 1EFA. Although chemically both the repressor and this DNA site are two-fold symmetric, the degree of resolution in each half site differs. In the protein-DNA interface, side chains of residues 2 and 26-37 in monomer A and 2, 31, 36, and 37 in monomer B are missing. In the half site contacted by the A “headpiece” domain (residues 1-49), the terminal 5′ end is missing density for nucleic acid bases and backbone assigned as D1-D4 and E19-E21. In the “B” half site, only the terminal base E1 is missing. We chose a model that utilizes the B half site where more atoms are resolved. In 1EFA, SymL is bent by ~40°. InsightII (Accelyrs Software Inc.) was used to build a B-form DNA corresponding to the sequences E2-E11 and D12-D21 as a model of the free DNA half site. Values of ΔASA for forming the rigid body LacI-SymL interface were then calculated as the difference in ASA between the bound half site (B chain, DNA bases D12-D21, E2-E11 in 1EFA) and the “free” B chain (1EFA) and free DNA model. This difference was then multiplied by two.
In the free repressor, residues connecting headpiece to the core are unfolded (12), but fold upon binding SymL operator (8–13). To calculate the ΔASA of this folding process, Insight II was used to put the conformation of residues 50–60 from 1EFA in an extended conformation, a reproducible representation of unfolded regions used to calculate ΔASA of unfolding (14, 39, 42). However, under conditions where secondary structures or tertiary interactions (e.g. hydrophobic collapse) are stable, this model presumably overestimates the ASA of these regions (see (c) below). Since the side chains missing in chain A are not involved in this coupled folding transition, chains A and B were used in this calculation. The difference between ASA in this extended state model of the LacI dimer and in the bound conformation in1EFA was calculated. Values of ΔASA for this calculation include the folding transition in residues 50-58 as well as the surface changes arising from “docking” the DBD on the core domain. The change in ASA in residues 50-58 was subtracted from the total to obtain the amount buried in docking.
b) α-helical and unfolded states of alanine-containing peptides
Scholtz et al. (15) reported and analyzed the urea denaturation at 273 K of a series of α-helical peptides with sequence Ac-Tyr-(Ala-Glu-Ala-Ala-Lys-Ala)k-Phe-NH2, with values of k of 2, 3, 4, 5, and 8. To calculate the changes in total and amide surface area in the unfolding of these peptides, a representative α-helical peptide with k=3 was built using the standard parameters from the Insight II Biopolymer library (Accelrys). The denatured state was modeled as an extended chain. The difference in ASA calculated for the central six-residue internal repeat for conversion from the α-helix to the unfolded state was divided by six to obtain the ΔASA of unfolding per average residue. Three different conformations of the lysine and glutamate side chains in the α-helix were used and the results were averaged to obtain the values reported in Table 3. The first was the conformation modeled by Insight II and reported previously (16). In the second model, these side chains were rotated to be maximally extended from the helix backbone. In the third model, glutamate and lysine were rotated to make the best possible salt bridge consistent with the α-helical geometry (the side chain rotamer library in Insight II allows the carbonyl oxygens of glutamate to be positioned 3.4 Å from the terminal nitrogen in the side chain of lysine). Although the change in total ASA varies, the change in polar amide ASA upon unfolding is the same (±0.5 Å2) for all three models of the α-helix.
Table 3.
Quantifying Urea Accumulation at Polar Amide Surfacea
| Process | Example(s) | (cal mol−1 M−1 Å−2) | % polar amide ΔASA | Urea accumulation per Å2 polar amide ΔASA Γμ3/m3ASAamide (m−1 Å−2) | Footnote |
|---|---|---|---|---|---|
| Protein unfolding | Set of 40 Globular proteins (without S-S or heme groups) | 0.15 ± 0.03 | 17 ± 2% | (1.4 ± 0.3) ×10−3 | b |
| α-helix melting | AcY(AEAAKA)kFNH2 ΔASAtotal = 42 ± 6 Å2 per residue | 0.52 ± 0.07 | 49 ± 7% | (1.8±0.1) × 10−3 | c |
| System: | ASAtotal (Å2) | % polar amide ASA | Urea accumulation per Å2 polar amide ASA Γμ3/m3ASAamide(m−1 Å−2) | ||
| BSA | 2.78 × 10⁴ | 0.12 ± 0.03 | 14.6% | (1.3± 0.4) × 10−3 | d |
| ds DNA | 171 per nucleotide monomer | −0.07 ± 0.07 | 2.5% | negligible | e |
Values of ΔASA calculated as described in Methods.
Value of Γμ3/m3 is from Cannon et al., in preparation, and agrees within uncertainty with ref (17).
c) Folded and Unfolded States of Monomeric and Dimeric Globular Proteins
Criteria for selection of monomeric and dimeric proteins for the analysis of change in surface area and m-value were: high resolution native structures containing no disulfide crosslinks or heme groups, reversible and two-state unfolding in urea, spectroscopically-determined m-values in the range pH 5–8 and 0–40°C. The data set in Supporting Information includes all proteins analyzed by Myers et al. (14) and all more recent systems which meet these criteria. Surface areas of the folded states of proteins were calculated using the appropriate PDB file and unfolded states were modeled as extended chains in which side chains were rotated to avoid steric clash using InsightII (see Supporting Information). Various models have been used to quantify the ASA of the unfolded state. We and others have proposed that, in the absence of evidence for secondary structure or tertiary interactions, the extended polypeptide chain provides the most reasonable estimate of the ASA (14, 39, 42). Tripeptide models overestimate ASA (39, 42) and models that include secondary structure should only be used where evidence of secondary structure exists. In unfolding studies at high urea concentration, no stable secondary structure is detected by circular dichroism of the unfolded state.
RESULTS
Surface Area Analysis of LacI-SymL Interactions
The high resolution structure of a LacI dimer-SymL complex (40), together with NMR structural data on the DNA binding domain (8), provide the data to predict the amount and composition of the surface buried in complexation. These results are summarized in Table 1. Of the 6882 Å2 of total surface of LacI and SymL operator buried in complexation, 1526 Å2 is polar amide surface, and 632 Å2 is anionic oxygen surface. All anionic oxygen surface buried upon binding is from DNA phosphate oxygens buried in the protein-DNA interface. Since amide-like functional groups comprise only 2.5% of the ASA of duplex DNA, almost all of the change in polar amide surface (95%) arises from burial of carbonyl oxygen and nitrogen of amide groups of peptide backbone and of Q, N side chains of the repressor. Polar amide surface makes up only 13% of the surface buried in the protein-DNA binding interface, but constitutes 25% of the DBD-core interface and 45% of the surface buried in folding the hinge helices. Consequently less than one-third of the polar amide surface buried in the binding process (491 Å2/1526 Å2) is in the repressor-operator binding interface; the majority is buried in folding the two hinge helices (515 Å2) and forming protein-protein interfaces between the folded DNA binding domain and the core of lac repressor (520 Å2).
Table 1.
Changes in accessible surface area (ΔASA) in LacI - SymL complexation a.
| Process: | Total (Å2) | Polar amide (O, N) (Å2) (% in total) | Anionic oxygen (Å2) |
|---|---|---|---|
| Form LacI-SymL interface (docking 2 DBD on SymL site) | 3689 | 491 (13%) | 632 |
| Fold 2 hinge helices (residues 50-58) | 1144 | 515 (45%) | 0 |
| Form 2 DBD-core interfaces | 2049 | 520 (25%) | 0 |
| TOTAL | 6882 | 1526 | 632 |
Opposite Effects of Urea (Destabilizing) and Glycine Betaine (Stabilizing) on Binding of Lac Repressor to lac Operator DNA
Since the structural data predict that substantial amounts of amide and anionic oxygen surface are buried in forming the LacI-SymL complex, binding studies as a function of urea and glycine betaine (GB) concentration were performed to test the following hypotheses (18, 19): 1) urea is a quantitative thermodynamic probe of large-scale changes in the amount of water-accessible polar amide surface; and 2) GB can be used to detect burial or exposure of anionic (carboxylate, phosphate) biopolymer surface in biopolymer processes. Figures 1 and 2 show representative binding isotherms over the ranges of urea and GB concentrations investigated. Nitrocellulose filter binding data at 24 °C at each solute concentration are plotted as the fraction (θ) of total SymL operator DNA complexed with LacI as a function of the logarithm of the total molar concentration of repressor tetramer.
Figure 1. Effect of Urea Concentration on Specific Binding of Lac Repressor to Lac Operator DNA.


Representative binding isotherms determined by the nitrocellulose filter assay in binding buffer (BB) at 24 °C in the absence and presence of urea are plotted as the fractional occupancy (θ) of the SymL operator site by LacI protein as a function of the logarithm of the total (bound and free, uncorrected for activity) molar concentration of LacI tetramer.
A). Lower [Salt] Titrations (0.212 m K+). Isotherms at 6.9 pM DNA in the absence of urea (closed circles) and at 1.8 pM DNA in 0.796 m urea (open squares), in 1.59 m urea (crosses); and 2.39 m urea (closed squares). LacI activity is 0.39. B). Higher [Salt] Titrations (0.427 m K+). Isotherms at 1.0 pM DNA in the absence of urea (closed circles) and at 1.28 m urea (closed squares), and at 1.25 pM DNA at 0.427 m urea (crosses). LacI activity is 0.49. In both panels, the curves are nonlinear least square fits to a noncooperative model with two equivalent sites for operator DNA on a repressor tetramer (see Methods), assuming that only 1:1 LacI- operator complexes (TO) form under the conditions investigated. Table S1 summarizes the fitted values of the binding constants KTO.
Figure 2. Effect of Glycine Betaine Concentration on Specific Binding of Lac Repressor to Lac Operator DNA.

Representative binding isotherms determined by the nitrocellulose filter assay in binding buffer (BB) at 24 °C in the absence and presence of GB are plotted as the fractional occupancy (θ) of the SymL operator site by LacI protein as a function of the logarithm of the total molar concentration of LacI tetramer. Isotherms at 1.0 pM DNA in the absence of GB (0.427 m K+; closed circles) and in 2.06 m GB (0.411 m K+; closed squares), at 1.25 pM DNA in 0.63 m GB (0.422 m K+; open squares), and at 1.50 pM DNA in 1.25 m GB (0.418 m K+; crosses). LacI activity is 0.36. The curves are nonlinear least square fits to a noncooperative model with two equivalent sites for operator DNA on a repressor tetramer (see Methods), assuming that only 1:1 LacI operator complexes (TO) form under the conditions investigated. Table S1 summarizes the fitted values of the binding constants KTO.
For urea, Figure 1A compares binding isotherms at 0.212 m K+ for urea molalities of 0, 0.796, 1.59, and 2.39 m. Figure 1B compares binding isotherms at 0.427 m K+ for urea molalities of 0, 0.43 and 1.28 m. At both salt concentrations, the binding curve shifts to higher repressor concentrations with increasing urea concentration, demonstrating that urea shifts the binding equilibrium toward reactants.
For GB, Figure 2 compares isotherms at ~0.43 m K+ for GB molalities of 0, 0.634, 1.25 and 2.06 m. Figure 2 shows that the binding curve shifts to lower protein concentration with increasing GB concentration, in accordance with the previous finding that GB and other osmolytes increase the stability of the repressor-O1 operator complex (43). The shape of these isotherms, typical of noncooperative binding, is independent of solute and salt concentration. Fitted curves are nonlinear least squares fits to a noncooperative isotherm involving only 1:1 (TO) LacI-SymL operator complexes (cf. 25). No significant contribution from 1:2 (TO2) repressor-operator complexes is expected for the conditions of these experiments (25, 30).
Binding constants KTO obtained from these fits are tabulated together with results at these and other urea or GB molalities in Table S1 (in Supporting Information). KTO decreases with increasing urea concentration and increases with increasing GB concentration at constant K+ molality. At 0.427 m K+, where KTO is ~4× 10⁹ M−1 in the absence of perturbing solute (cf. Table S1), addition of 1.28 m urea reduces KTO by somewhat more than an order of magnitude (to ~3 × 10⁸ M−1), while addition of 1.25 m GB increases KTO by somewhat less than an order of magnitude (to ~3 × 10¹⁰ M−1). Reduction in the K+ concentration from 0.427 m to 0.212 m increases KTO more than two orders of magnitude (to ~6 × 10¹¹ M−1) in the absence of perturbing solute (cf. Table S1). This strong dependence of KTO on salt concentration above 0.2 molal (log-log [salt] derivative SKobs = −7 ± 1 near 0.3M salt; 30) arises primarily from formation of the specific interface with operator. (A smaller, variable contribution to SKobs is attributed to local wrapping of flanking nonoperator DNA on the repressor core (30).) Because both urea and GB at concentrations in the molal range significantly reduce the thermodynamic activity of KCl (18, 44) and because KTO depends so strongly on salt activity, it is necessary to correct the observed derivatives of KTO with respect to solute (urea, GB) concentration to constant salt activity, by the method developed in Appendix I and summarized below.
Solute Concentration Dependences of the LacI-SymL Binding Constant KTO
Binding constants KTO for the entire range of urea and GB concentrations investigated are summarized in Figure 3, which plots the natural logarithm of the ratio of KTO to a binding constant, , as a function of solute molality. ( is the binding constant in the absence of the solute (urea or GB) at the same KCl concentration.) The effect of urea concentration on lnKTO is linear within the uncertainty at low urea concentrations (< 1.6 m) at both 0.212 m and 0.427 m K+. Data at higher urea concentrations (obtained only at 0.212 m K+) reveals detectable downward curvature. The fit of all values of at both 0.212 m and 0.427 m K+ to a second order polynomial in murea (0 to 3.2 m urea) is shown in Figure 3:
| (3) |
Figure 3. Effects of Urea and GB Molality on the Repressor-Operator Binding Constant.
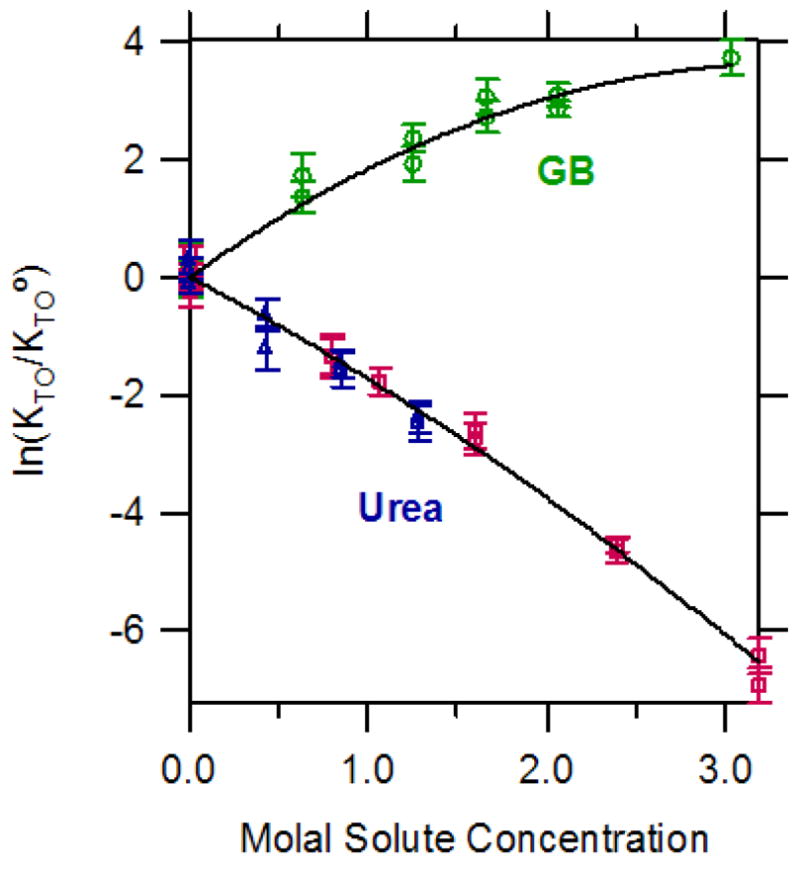
KTO. The quantity , the natural logarithm of the ratio of the repressor-operator binding constant to that in the absence of added solute, is plotted against solute (GB or urea) molality. Binding constants KTO and at the corresponding salt concentration are obtained from Table S1. For GB, all binding constants are at 0.427 m K+ (circles); for urea, binding data at 0.212 m K+ (squares) and at 0.427 m K+ (triangles) are plotted. Equations for the fitted curves are: for urea (combining data at both K+ molalities), ; for GB, .
The initial slope (∂ ln KTO/∂murea)murea→0 = −1.7± 0.2 is most directly interpretable in terms of the ASA buried upon binding repressor to operator (see Discussion, also 16, 45). The significant downward curvature (quadratic term) at higher molal concentrations of urea is opposite in direction to that expected if urea were only perturbing the intrinsic strength of the interaction and not affecting the structure of the DNA-binding domain of the unbound lac repressor. Possible origins of this effect are discussed below (see Discussion).
For GB, the plot of vs. mGB in Figure 3 is fitted as a quadratic function of mGB (shown below in eq 4). The initial slope is opposite in sign but comparable in magnitude to that obtained with urea. Although the effects of the two solutes on are in opposite directions, both solute plots exhibit the same direction of curvature at higher solute concentrations. Stronger downward curvature is exhibited in GB than in urea, and indeed KTO approaches a GB independent plateau value or maximum at high GB concentration; the predicted maximum from the fit (given below) is at ~3.5 m GB. The fit of all values of at 0.427 m K+ to a second order polynomial in mGB (0 to 3.03 molal GB) is shown in Figure 3:
| (4) |
As for urea, the initial slope (∂ ln KTO/∂mGB)mGB→0 = 2.1± 0.2 is most directly interpretable in terms of the ASA buried upon binding repressor to operator (see Discussion, also 16, 45). Possible origins of the strong curvature (quadratic term) at higher GB concentrations are discussed below (see Discussion Section). Both the direction and magnitude of this curvature are consistent with that observed in studies of protein thermal stability as a function of GB concentration (45, 46).
Calculation of the Solute Concentration Dependence of the Repressor-Operator Binding Constant at Constant Salt Activity and In the Limit of Low Solute Concentration
Effects of denaturants (urea, guanidinium chloride) on the standard free energy change for protein unfolding have traditionally been reported as “m-values” (47). We (16, 17, 48) applied a thermodynamic analysis to interpret these m-values in terms of differences in preferential interactions of denaturant with denatured and native states of the protein, using the solute partitioning model of preferential interaction coefficient (16). For such an analysis, the molal scale of solute concentrations is more fundamental. Hence we analyze the dependence of lnKobs = −ΔGo/RT for the process of interest (here repressor-operator binding) as a function of molal concentration of solute (urea or GB).
Protein-nucleic acid interactions are very strongly dependent upon the type and thermodynamic activity of salt. In the determinations of the effects of urea and GB on repressor-operator binding constants reported here, the total K+ molal concentration and individual anion molal concentrations (primarily Cl−, also phosphate and EDTA) were maintained constant in each series of experiments. Because the osmolalities of three component aqueous solutions of KCl and urea (or GB) are always less than the sum of the osmolalities of the individual two component solutions, the KCl activity in experiments at constant KCl molality decreases with increasing concentration of urea or GB. The strong dependence of the repressor-operator binding constant on salt activity makes it necessary to correct the experimental data from constant salt molality to constant salt activity to isolate the effect of urea or GB on the LacI-SymL binding constant. This is most conveniently done at the level of the derivative ∂ ln Kobs/ ∂m3, using experimental thermodynamic data obtained by VPO (vapor pressure osmometry) for the interaction of urea and GB with KCl. Appendix 1 provides the derivation of the relationship between the derivative (∂ ln Kobs/ ∂m3)m4 and the corresponding erivative at constant a4, where component 4 is the salt and component 3 is the perturbing solute (urea, GB). The result is
| (5) |
In eq 5, the quantity ΔOsm34 is the difference in osmolality between the three component solute (urea, GB)-salt solution and the sum of its constituent two-component solutions at the same molalities (m3 and m4). (Because the quantity RTΔOsm34/m3m4 is approximately equal to the derivative of chemical potential of urea or GB with respect to salt molality, it is expected to be relatively independent of m3 over the range of molalities of interest here, including the situation m3 → 0 (cf. Appendix 1).) Thermodynamic consequences of any interactions of urea or GB with glycerol or other components of the binding buffer are expected to be insignificant and are therefore neglected. For three component solutions containing KCl and either urea or GB, osmolality fitting functions to evaluate ΔOsm34 have been published (18).
In applications of eq 5 to the initial value of the derivative (∂ ln Kobs/ ∂ m3)m4,m3 →0, values of the electrolyte nonideality term (1+ ε±)m3=0 and of the salt derivative of the protein-DNA binding constant (SKobs) in the absence of perturbing solute were used. For lac repressor binding to plasmid operator DNA in the vicinity of 0.3 M salt, −SKobs = 7± 1 (30). For KCl solutions in the range 0.2–0.43 m the nonideality term (1+ ε ±)m3=0 =0.893 ± 0.001 (49). Table A1 in Appendix 1 provides numerical values for the second term on the right hand side of eq 5 for urea and GB at the KCl concentrations used in this study. Solute concentration derivatives (∂ lnKobs/∂ m3 a4,m3→0) at constant salt activity for both urea and GB are calculated using eq 5 and tabulated in Table 2. For the salt concentration range of our experiments (0.21–0.43 m KCl), the KCl correction terms for urea and GB have the same sign and similar magnitude. Thus for urea (GB) the derivative (∂ lnKobs/∂m3) a4,m3→0 is larger (smaller) in magnitude than (∂ ln Kobs/∂m3)m4,m3→0.
Table 2.
Calculation of (∂ln Kobs /∂m3 )m3→0,a4 from (∂ln Kobs/∂m3 ) m4, m3 →0
| (∂ln Kobs/∂m3)m4, m3→0 | Correction to constant KCl activity | (∂lnKobs/∂m3)a4,m3 →0 | |
|---|---|---|---|
| Urea effect | −1.7 ± 0.2 | −0.34 ± 0.09 a | −2.1 ± 0.2 |
| GB effect | 2.1 ± 0.2 | −0.37 ± 0.10 b | 1.8± 0.2 |
For KCl concentrations in range 0.212–0.427m.
For a KCl concentration of approximately 0.43m.
Analysis of initial slopes (∂ lnKobs/∂ m3)a4, m3→0 is not only convenient from the point of view of the correction to constant salt activity (eq 5), but also provides the most direct information regarding changes in ASA in the absence of solute. Possible origins of the changes in slope observed at higher concentrations of both urea and GB are discussed below.
ANALYSIS
The Intrinsic Interaction Coefficient for Urea and Polar Amide Surface
To obtain intrinsic interaction coefficients for urea and different types of biopolymer surface, we analyze the preferential interactions of urea with a wide range of biopolymer surfaces, differing in composition and in total surface area (18). Our approach is based on dissection of urea-biopolymer interactions and urea effects on well-defined biopolymer processes to obtain intrinsic interaction coefficients for the solute and various types of biopolymer surface. This contrasts with analyses that obtain analogous quantities (transfer free energies) from the effect of the solute on the solubility of model compounds (50). To date the two approaches have not been systematically compared. A limited comparison of free energies and enthalpies of transfer of two model peptides (di- and triglycine) from water to urea (51, 52) calculated from isopiestic distillation and solubility data revealed significant systematic differences that were attributed to the treatment of activity coefficients in the analysis of the solubility data.
For our dissection of observed urea-biopolymer interactions, quantitative information about the interactions of urea with the protein surface exposed in unfolding (which is typically relatively uncharged (< 5% charged ASA), largely nonpolar (65–75%), with 15–20% polar amide ASA), is obtained from the characterization of urea effects on the stability of globular proteins. Myers et al. (14) compiled urea m-values for the set of 45 globular proteins for which structural data were available, and found a linear relationship (with a small positive intercept) between the m-value and the ΔASA of unfolding. Correction for the effect of disulfide bonds on the ASA of the unfolded state eliminated the intercept and yielded a proportionality between the m-value and the total ΔASA.
In general the proteins in the Myers et al. (14) data set have stable folds, and exhibit midpoint unfolding concentrations of urea in excess of 4 M. Given the relatively high concentrations of urea used to denature proteins, the m-value only describes the initial slope if ΔGo is a linear function of [urea]. (Initial slopes characterizing solute dependence on molal and molar concentration scales are the same.) Evidence for the validity of the linear extrapolation method (LEM) for urea is provided by detailed studies of the urea-induced helix-coil transitions of a series of marginally-stable α-helical peptides at 273 K (15) and unfolding studies of marginally-stable proteins as functions of temperature and urea concentration (e.g., 48, 53). For these marginally-stable systems, effects of urea on stability are observable over the concentration range from 0 up to 4–6 M; in all cases the m-value is independent of urea concentration within experimental uncertainty, justifying the LEM. Theoretical justification for the validity of the LEM for urea is provided by the two-domain, solute partitioning model of the preferential interaction, which should be valid for noncoulombic interactions of solutes with biopolymers (16, 45). For solutes other than urea, especially in cases where the solute-concentration-dependence of bulk solute nonideality (i.e. in 2-component solution) is larger in magnitude than that observed for urea, the LEM may be less successful (45).
We selected from the Myers et al. (14) data set the 14 proteins which lack both disulfide crosslinks and heme groups, and added to this set an additional 26 proteins (with high resolution folded structures and lacking disulfides and hemes) for which urea m-values have been recently reported at or near neutral pH (pH 5–8; in this range, typically no significant effect of pH on the m-value is observed (54)). Determinations at temperatures other than 298 K were corrected to 298 K using the small temperature dependence of the m-value determined previously for lac HTH (48), weighted by the relative amounts of polar amide surface exposed in the two processes. In Figure 4A, these 40 m-values are plotted as a function of the total ΔASA of unfolding. (All protein m-values, conditions, PDB files, and ΔASA calculations are reported in Table S2 in Supporting Information.) An excellent correlation is observed; the intercept is zero within the uncertainty of the best-fit line, indicating proportionality of the m-value to ΔASAtotal. The error weighted average and standard deviation of the ratio m-value/ΔASAtotal for the 40 protein data set is 0.15 ± 0.03. This result is plotted as the line in Figure 4A. (For the disulfide-corrected, 45 protein set of Myers et al. (14), the proportionality constant is 0.14, within error of the current result.) The largest deviation from this proportionality of urea m-value to ΔASAtotal is observed for the largest protein in the data set, human glutathione transferase A1-1 (hGSTA1-1) (55). Unfolding of hGSTA1-1 is two-state (folded dimer → 2 unfolded monomer) and reversible. The surface exposed in unfolding hGSTA1-1 is only 13% amide (one of the two lowest values in the data set); for this protein the m-value/ΔASAtotal ratio is smaller than the average by almost 3 standard deviations.
Figure 4. ASA Analysis of Urea m-Values for Unfolding of Monomeric and Dimeric Globular Proteins.


A). Literature determinations of urea m-values (converted to 25°C) are plotted vs. calculated values of the total ΔASA of unfolding for 40 monomeric and dimeric proteins (cf. Table S2 in Supporting Information). The line plotted corresponds to the error-weighted average value of the quantity m-value/ΔASAtotal =0.15± 0.03.
B). The same set of urea m-values at 25°C as in Figure 4A are plotted vs. calculated values of the polar amide ΔASA of unfolding. The line plotted corresponds to the error-weighted average value of the quantity m-value/ΔASAamide = 0.83±0.18, from which an intrinsic urea-amide ASA interaction coefficient Γμ3/m3ASAamide = (1.4±0.3) × 10−3 m−1 Å−2 is calculated.
C). Distribution of values of the intrinsic urea-amide ASA interaction coefficient (equal to m-value/RTΔASAamide) for the set of 40 monomeric and dimeric proteins.
The m-value is related by fundamental three-component thermodynamics to the difference in urea preferential interaction coefficients for unfolded and folded states of the protein (16, 56–58). Assuming that interactions of urea with the protein surface which is solvent-accessible in both folded and unfolded forms are not affected by unfolding, the m-value is a direct measure of the preferential interaction coefficient Γμ3 characterizing the net interaction of urea with the entire protein surface exposed in unfolding. The ratio m-value/RTΔASAtotal is interpreted as the intrinsic preferential interaction coefficient Γμ3/m3ASAtotal (per unit of urea concentration and per unit area of protein surfaces exposed in unfolding) in the limit of low urea concentration (16). To determine whether the favorable preferential interaction with urea is specific for some subset of the surface exposed in unfolding (e.g. amide, nonpolar, etc.), we determined thermodynamic coefficients characterizing the interactions of urea with native DNA and protein (BSA) surfaces (17, 18; Cannon et al., in preparation) and analyzed literature data (15) for effects of urea on α-helix melting (16).
For α-helix melting, Table 3 shows that the ratio m-value/ΔASAtotal is more than three times larger than for protein unfolding at 25°C, and that the fraction of total surface exposed upon unfolding which is polar amide surface (backbone and side chain ASA attributable to amide N and O) is also more than three times larger for α-helix melting than for protein unfolding (0.52 vs. 0.17; 16). The per residue ΔASAtotal varies from 36 Å2 to 47 Å2 for various plausible models of the conformations of the K and E side chains in the helix (16, 18), which introduces substantial uncertainty in the ratio m-value/ΔASAtotal. However, the average amount of polar amide ASA exposed per residue of (AEAAKA)k α-helix unfolded is the same (20.6 ± 0.3 Å2), for all three structural models assumed for the α-helix.
We proposed (16, 18) that interaction coefficients of urea with protein and other biopolymer surfaces should be interpreted as primarily due to a favorable preferential interaction with polar amide surface. Since the m-value is independent of [urea], the intrinsic interaction coefficient for urea and polar amide surface exposed in unfolding proteins and α-helices at low [urea] Γμ3/m3ASAamide is equal to the ratio m-value/RTΔASAamide. Calculated from the α-helix unfolding m-value, the intrinsic interaction coefficient for urea and polar amide surface is (1.8 ± 0.1) × 10−3 m−1 Å−2. Figure 4B shows the corresponding analysis for the protein unfolding data set of Figure 4A; in Figure 4B, 25 °C m-values are plotted as a function of the amount of polar amidesurface exposed in unfolding. Comparison of Figure 4A and 4B shows that in general the m-values correlate equally well with either total ΔASA or polar amide ΔASA, which is the expected result because most of the proteins in the data set form a homologous series in which 17 ± 2% of the surface exposed in unfolding is polar amide surface. The line in Figure 4B represents the error-weighted average value of the intrinsic urea-amide interaction coefficient m-value/RTΔASAamide = (1.4 ± 0.3) × 10−3 m−1 Å−2 for all 40 proteins (cf. Supporting Information). The protein hGSTA1-1, which deviates by the largest amount from the average in Figure 4A, agrees with the average in Figure 4B.
The intrinsic interaction coefficient for urea and polar amide surface obtained from the protein unfolding data ((1.4 ± 0.3) × 10−3) is the same within uncertainty as that obtained from analysis of α-helix unfolding m-value (1.8 ± 0.1) × 10−3, which supports the hypothesis that a favorable interaction of urea with polar amide surface is the dominant factor contributing to urea denaturation of proteins and of α-helices. Figure 4C plots the distribution of the protein folding data set around this error-weighted average. It will be important to ascertain whether the breadth of this distribution indicates the existence of a secondary interaction of urea with other types of protein surface, or whether it arises from experimental factors (e.g., deviations from two-state, reversible transitions or differences in baseline assignments used to calculate m-values) or from the choice of structural models for the folded and unfolded states of these proteins in solution used for calculation of ΔASA.
Native biopolymer surfaces, such as those of BSA and duplex DNA, differ profoundly in composition from the surfaces exposed in the processes of unfolding proteins and melting α-helices. These native surfaces are much more highly charged and much less nonpolar than are the surfaces exposed in unfolding/melting. As shown in Table 3, the intrinsic interaction of urea with BSA surface (2.78 × 10⁴ Å2), which is 14.6% polar amide but 29% charged and 53% nonpolar, expressed per Å2 of polar amide surface, is the same within error as that obtained for the surfaces exposed in unfolding proteins and α-helices. No significant effect of the large percentage of charged surface on this ratio is detected. For duplex DNA, the surface of which is 44% charged (anionic) but only 2.5% polar amide, no significant preferential interaction with urea is observed, indicating that urea is not significantly accumulated nor excluded from anionic or other types of DNA surface. (Because we do not detect the predicted slight accumulation of urea at the 2.5% of the surface of duplex DNA which is amide-like, it is possible that there is a compensating slight exclusion from anionic or other DNA surface, which we are unable to dissect.)
Since protein unfolding comprises the most extensive data set in Table 3, we select the intrinsic urea-polar amide surface preferential interaction coefficient and uncertainty specified by these data for use in analysis of the effects of urea on binding of LacI to SymL. All other data in Table 3 are consistent with this result within the uncertainty. We therefore propose that, for any biopolymer process with equilibrium concentration quotient Kobs, the derivative (∂ lnKobs/∂ m3)a4,m3→ 0 at low urea concentration is, to a good approximation, proportional to the change in the amount of water accessible polar amide surface (ΔASAamide) in the process.
| (6) |
When the data of Table 3 are analyzed as a linear combination of contribution from polar amide, nonpolar and anionic surface (by the method of Appendix 2), fitted coefficients for nonpolar and anionic surface are an order of magnitude smaller than for polar amide surface, and comparable to their uncertainties; the coefficient for polar amide surface agrees within uncertainty with eq 6 above.
The Intrinsic Interaction Coefficient for Glycine Betaine and Anionic Surface
GB is strongly excluded from the surfaces of native BSA and DNA, and modestly excluded from native hen egg white lysozyme (19). GB modestly increases the thermal stability of RNase and lysozyme (46), and more significantly stabilizes the lac HTH (19). One interpretation of the stabilizing effects of GB is that it is modestly excluded from the surface exposed in unfolding these proteins (19). Unpublished experiments from our laboratory show that GB at concentrations up to 2M has no significant effect on the stability of an (AEAAKA)6 α-helix and therefore is neither excluded from nor accumulated at the surface exposed in melting this α-helix (Cannon, Heitkamp et al, unpublished). We also find that GB is significantly excluded from the dicarboxylic acid salt potassium glutamate (Cannon, unpublished), although it is slightly accumulated in the vicinity of potassium chloride (18), indicating that the exclusion is probably attributed to the glutamate anion.
From these data, we are able to refine our previous analysis (19, 59) to conclude that GB is detectably excluded only from anionic surface (phosphate, carboxylate) and that it exhibits no detectable preferential interaction with amide and nonpolar surface. The observed exclusion from anionic surface may be explained by the fact that GB, unlike water, has no hydrogen bond donor groups and so no ability to hydrogen bond to anionic groups of proteins or nucleic acids. Analysis of the published data for interactions of GB with BSA and duplex DNA as an interaction only with anionic surface yields an intrinsic interaction coefficient (per unit molality of GB and per unit anionic surface) of − 4.0 × 10⁻³ m−1 Å−2, as previously reported (19). In addition to this exclusion from anionic surface, GB has been observed to interact favorably with (i.e., accumulated at) some aromatic surfaces, forming a cation-π complex in the co-crystal structure of its transporter protein (60), and to selectively destabilizing GC (but not AT) DNA at molar concentrations, presumably by a weak favorable interaction with G or C bases in the single-stranded state (18, 61). A weak cation-π interaction of GB with tyrosines on the surface of the folded HTH which are buried in the protein-DNA interface could explain the greater-than-expected stabilization of the lac HTH against thermal unfolding by GB, as discussed below.
For biopolymer processes where the interaction of GB with aromatic surface is not significant, the semilogarithmic derivative (∂ lnKobs/∂ m3)a4,m3→0 at low GB concentration is expected to be proportional to the change in the amount of water accessible anionic surface (ΔASAanionic).
| (7) |
We estimated an uncertainty in this value of ~ 20% based on the standard deviation of the much larger data set sed to establish the corresponding proportionality for urea and polar amide surface (cf. eq 6).
DISCUSSION
Use of urea to quantify burial of polar amide surface in repressor-operator binding: Contributions from the interface and from coupled folding
Previously we used heat capacity changes upon binding to quantify changes in nonpolar and polar water-accessible surface area in protein-ligand and protein-protein interactions (62); this analysis has successfully predicted the occurrence and often the amount of coupled folding in these protein associations (4). However, other large-scale temperature-dependent coupled processes also can contribute to the heat capacity change in reactions involving biopolymers (e.g., 63–66). These coupled equilibria (e. g. protonation, changes in base stacking, salt bridge disruption) are not generally related to overall structural changes, necessitating the development of more direct probes of coupled folding. Here we propose that the study of the urea concentration dependence of the binding constant provides one such method.
The initial slope describing the urea dependence of the logarithm of the LacI-SymL binding constant at low urea molality and at constant KCl activity is (cf. Table 2)
| (8) |
Interpretation of the initial effect of urea on the binding constant of the LacI-SymL interaction (eq 8) using the intrinsic urea-polar amide interaction coefficient (eq 6) predicts that (1.5 ± 0.3) × 103 Å2 of polar amide surface is buried upon specific binding of a SymL operator to the lac repressor tetramer. This thermodynamics-based structural prediction greatly exceeds the amount of amide surface buried in the rigid body LacI-SymL interface (491 Å2, see Table 1 and Figure 5). However, this apparent discrepancy ((1.0 ± 0.3) × 103 Å2) is fully explained by inclusion of the coupled conformational changes inferred from the structure. The DNA binding domains (DBD), composed of helix-turn-helix (HTH) residues 1-49 and flexible tethers (“hinges”) connecting the HTH to core repressor (residues 50-58), are not observed in the crystal structure of the intact (DBD-containing) free repressor (12). Hence in the free (unbound) form of repressor the DBD are not assembled on the repressor core, whereas they are visualized in the structure of the complex in an ordered and docked state (See Figure 5). Indeed solution NMR experiments reveal that the hinge residues are unstructured in the free state and fold upon binding to the SymL operator (8, 10).
Figure 5. Structural Model Showing Lac Repressor Surfaces Buried in Binding Operator DNA.
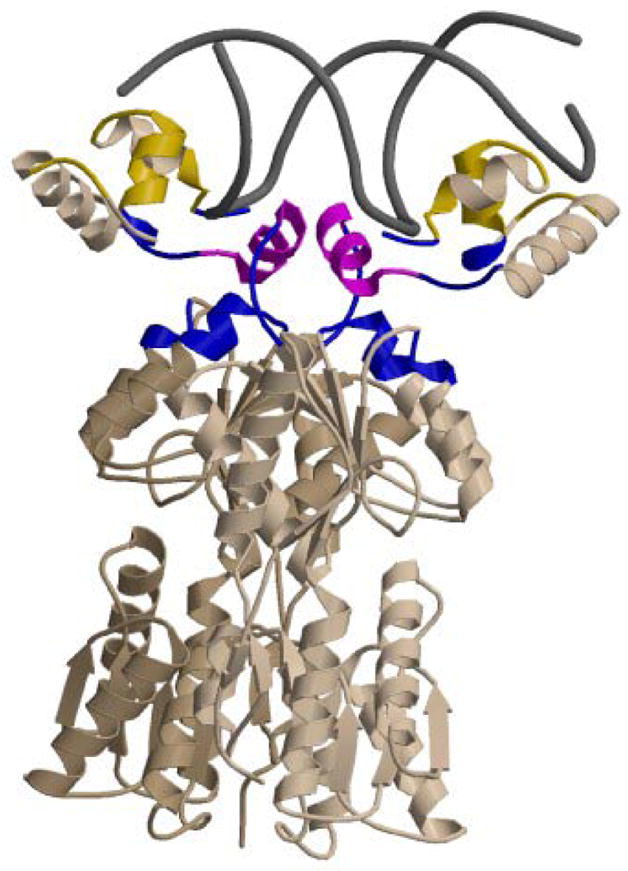
Binding of LacI to SymL involves the formation of the protein-DNA interface, folding of the hinge helices and docking of the DNA binding domains on the core domains of repressor. In this cartoon, residues buried in forming the rigid body interface are shown in yellow, residues buried in folding the hinge helices are red, and residues buried in the core-DBD interface are blue. This model is based on PDB file 1EFA (40), and was created using MolScript (76) and Raster3D (77).
Coupled folding of the two hinge helices is predicted (see Table 1) to bury 515 Å2 of polar amide surface (258 Å2 for folding of each hinge helix). As shown in Figure 5, the folded hinge helices not only participate in the interface with SymL operator DNA, but also participate in an interface between the LacI DBD and the LacI core in the operator complex (40). Docking of the pairs of DNA-bound hinge helices and HTH domains on the repressor core buries 2 × 260 Å2 = 520 Å2 of polar amide surface. Therefore the total amount of polar amide surface deduced to be buried in coupled folding of the hinge helices and in forming an interface between the folded headpieces/hinge helices and core is 1035 Å2 of polar amide surface. This value calculated from structural data is the same as that obtained by urea analysis within uncertainty.
The structural data of Table 1 reveal why urea is a sensitive probe of the existence and amount of folding that is coupled to binding in protein interactions. Only 1144 Å2 of total surface are buried in folding the two 9-residue hinge helices, but 45% of this is polar amide surface (515 Å2). Therefore the contribution of folding 18 residues and burying a total of only 1144 Å2 of surface to the observed effect of urea on the binding constant is just as large as the contribution from the burial of 2049 Å2 of surface in the interface between the folded DBD and core repressor (which is only 25% polar amide), and from the burial of 3689 Å2 of surface in the repressor-operator (protein-DNA) interface (which is only 13% polar amide surface because of the lack of these functional groups on the accessible surface of duplex DNA).
If the hinge helices are completely unfolded in the free state of repressor and completely folded and docked in the complex with SymL, and if no other coupled processes contribute to the thermodynamics, the heat capacity change predicted (4) from the ASA data in Table 1 and Figure 5 is approximately −0.80 kcal K−1. By contrast, the experimental value is approximately −1.5 kcal K−1. Calorimetric studies with a crosslinked dimer of the DNA binding domain (residues 1-62) are in progress in an attempt to determine the other factor(s) contributing to the heat capacity change of LacI-SymL binding.
It is instructive to compare the structural prediction of the polar amide ASA analysis of the urea effect with that which would be obtained using the original Myers et al. (14) expression in terms of total ASA, applicable only to analysis of unfolding data for the homologous series of globular proteins. Analysis of the urea dependence of the repressor-operator binding constant (eq 8), using the original protein folding expression (m-value/ΔASAtotal = 0.14 (14)) yields a predicted ΔASAtotal = 8.9× 10³ Å2, which exceeds the structural value by 74% (cf. Table 1: 5.1× 10³ Å2 of repressor ASA buried in complexation). Even if the ASA of DNA buried in complexation were included, which is not justifiable given the observation of no significant preferential interaction of urea with duplex DNA (18; see Table 3), the protein-folding correlation overpredicts ΔASAtotal by 29%. The over-prediction occurs because the m-value/ΔASAtotal ratio obtained from analysis of globular protein folding data is only applicable to processes which expose or bury surface with the same polar amide percentage (17%) as that characteristic of folding globular proteins. However, the percentage of total surface buried in LacI-SymL complexation which is polar amide surface is 22% (including DNA surface) or 30% (including only repressor surface).
Interpreting the Urea Concentration Dependence of dlnKobs/dm3 for Repressor-Operator Binding
Figure 3 and eq 3 indicate that the magnitude of the derivative dlnKobs/dm3 increases with increasing urea concentration in the range examined (up to 3.19 molal). This urea concentration dependence of dlnKobs/dm3 is in the opposite direction from that expected from the solute partitioning model, in which three factors make contributions to the concentration dependence of dlnKobs/dm3: 1) urea nonideality (1+ ε3); 2) attenuation of the urea local-bulk partition coefficient (45), and 3) the effect of replacement of local water by urea when it accumulates at biopolymer surfaces (16). These three factors, predicted to be of approximately equal significance, together are expected to reduce the magnitude of dlnKobs/dm3 by approximately 25% at 1.59 molal urea and 43% at 3.19 molal urea. However, we observe that the magnitude of dlnKobs/dm3 increases by approximately 18% at 1.59 molal urea and 35% at 3.19 molal urea.
A plausible origin of these effects is urea-driven unfolding of either the HTH or the core of lac repressor. At 298 K and salt conditions which differ from those investigated here, the core of lac repressor unfolds in a very narrow transition at approximately 3 M urea (34, 67). At 298 K, the HTH unfolds in a very broad transition starting in the absence of urea at low salt (25 mM K2HPO4; 48) and near 1 M urea at 0.2 M K2HPO4 (67), which is probably a more stabilizing salt than our binding buffer. Therefore urea-induced unfolding of the DNA-binding HTH appears to be the most likely explanation of the direction and magnitude of curvature in Figure 3. Calculations of the curvature predicted as a result of a broad unfolding transition for the HTH are consistent with that observed (data not shown).
Use of glycine betaine to quantify burial of DNA phosphate surface in repressor-operator binding
The initial slope describing the GB dependence of the logarithm of the LacI-SymL binding constant at low GB molality and at constant KCl activity is (cf. Table 2)
| (9) |
Comparison of eq 9 with eq 7 for the repressor-operator interaction yields the following structural prediction from the thermodynamic analysis: ΔASAanionic = − (4.5 ± 1.0) × 102 Å2. By this analysis, approximately 450 Å2 of anionic surface are predicted to be buried upon binding one SymL operator DNA to one pair of headpieces on a LacI tetramer. This prediction is ~ 70(± 16)% of the amount of anionic surface which we calculated as buried in the LacI-SymL (TO) interface (632 Å2, obtained by doubling the amount of anionic ASA buried in the more highly resolved half site).
One possible explanation of the discrepancy between the structural value and the GB-based prediction for the ΔASA of anionic surface, which, if correct, will limit the utility of GB as a quantitative probe for changes in exposure of anionic surface in biopolymer processes, involves the same proposal as that discussed above to rationalize the greater-than-expected stabilization of the folded state of the lac HTH by GB. Interaction of the cationic end of GB with the aligned tyrosines in the DNA binding site of the folded HTH would not only stabilize the folded state against unfolding but also compete with DNA binding, and hence reduce the otherwise stabilizing effect of GB on a process which buries anionic surface. A second possible explanation, developed in Appendix 2, is that residual water in the interface of the complex, not detected in the crystallization, reduce the magnitude of the GB effect. Even with the uncertainty regarding this effect, it appears that GB can be used as a semiquantitative probe of changes in exposure of anionic surface in processes involving proteins and double stranded DNA. For example, the rate-determining conformation change in open complex formation by E.coli RNA polymerase (Eσ70) at the λ PR promoter is significantly disfavored by GB, consistent with exposure of anionic surface in this step (68). Since DNA phosphates presumably are buried in this process, the GB result (68) may indicate exposure of carboxylates on RNA polymerase in this step. One possible candidate, shown to be exposed in open complex formation (69) is the negatively charged N terminal domain of σ70, exposure of which would unmask the active site. Since GB is inferred to interact with guanine and/or cytosine bases in single-stranded DNA (18), perhaps also by a cation-π interaction involving stacked bases, it will probably not be a suitable probe of processes involving single-stranded DNA. If GB were also excluded from amide surface, as originally proposed (19, 50), the discrepancy between structural and thermodynamic analyses of the change in “GB-affected” surface area would be even greater.
Interpreting the Glycine Betaine Concentration Dependence of dlnKobs/dm3 for Repressor-Operator Binding
Figure 3 and eq 4 indicate that the magnitude of the derivative dlnKobs/dm3 decreases with increasing GB concentration in the range examined (up to 3.03 m). This GB concentration dependence of dlnKobs/dm3 is consistent with an attenuation model (45), in which the GB concentration dependence of its nonideality in the local domain is expected to be attenuated relative to that of the bulk domain due to GB-protein surface interaction in the local domain. The same amount of attenuation as that deduced for the GB effect on lac HTH unfolding (45) can be used to interpret the curvature of dlnKobs/dm3 in our LacI binding study. (Details of the calculation are given in Supporting Information.) Using the GB attenuation model (45), is expressed as a 4th power polynomial in m3. Fitting experimental values of to this polynomial yields the value of (∂ lnKobs/∂m3)a4,m3→0 =1.6 ± 0.2 which is the same within uncertainty as determined above (see eq 9) from analyzing the initial slope (∂ ln Kobs/∂m3)m4,m3→0 of the quadratic fitting of vs. m3.
CONCLUSION
This study provides the basis for, and an example of the use of, urea as a quantitative probe of coupled folding and other large scale coupled conformational changes in protein-DNA interactions and other protein associations. Urea selectively detects changes in exposure of polar amide surface, and consequently is a very sensitive probe of α-helix formation (or disruption) and other local folding or unfolding processes. Urea is also a sensitive probe of formation (or disruption) of protein-protein interfaces coupled to DNA binding, and is relatively insensitive to the formation of the protein-duplex DNA interface because of the virtual absence of water-accessible amide-like surface on the DNA double helix. Urea should be very useful to determine the order and the magnitude of coupled conformational changes that occur in a multistep protein-DNA binding process, such as formation of an open promoter complex, by observing urea-concentration-dependent effects on the rate and equilibrium constants of the individual steps of the mechanism. Studies of urea effects on open complex formation by RNA polymerase are in progress.
Supplementary Material
In Supporting Information we tabulate the observed values of KTO at the concentrations of urea, GB, and KCl investigated here, as well as the corrected values of KTO in GB experiments in which KCl and glycerol molality varied slightly with GB molality. Individual values of surface area changes and corresponding m-values for the set of monomeric and dimeric proteins summarized in Table 3 are also reported. In addition, the details of the thermodynamic analysis using a solute partitioning model are presented. This analysis is used to interpret the curvature in ln Kobs as a function of GB concentration. The Supporting Information is available free of charge via the Internet at http://pubs.acs.org.
Acknowledgments
We thank Dr. Charles Anderson, Jonathan Cannon, and Melissa Anderson for discussions of preferential interactions of these solutes and for their comments on the manuscript, and thank Sara Heitkamp and Jonathan Cannon for the use of their unpublished data on the preferential interactions of GB and urea with biopolymer surfaces. We are grateful to Dr. Linda Jen-Jacobson and the reviewers for their valuable comments and suggestions for revision.
Support of this research by NIH grant GM 23467 is gratefully acknowledged.
Abbreviations
- ASA
water-accessible surface area
- ASAamide
the contribution to ASA from the polar atoms (N, O) of amide groups
- GB
glycine betaine (N,N,N-trimethyl glycine)
- LacI
lac repressor
- SymL
symmetric lac operator, a palindrome of the left (upstream)-half site of the primary O1 operator
- m-value
the slope of plot of ΔGo of protein unfolding versus the molar concentration of chemical denaturant or osmolyte
- AEAAKA
Ala-Glu-Ala-Ala-Lys-Ala
- DBD
DNA binding domain (residues 1-62) of LacI
- LEM
linear extrapolation method of analysis of urea unfolding data
APPENDIX 1
Conversion of (∂ln Kobs/∂m3)m4 to (∂ ln Kobs/∂m3)a4
Here we obtain eq 5 in the text, which relates the experimentally-determined derivative (∂ ln Kobs/∂m3)m4 at constant temperature, pressure and molality of a 1-1 salt (4) to the derivative (∂ ln Kobs/∂m3)a4 at constant salt activity a4 and thereby eliminates the effect on ln Kobs of changes in salt activity brought about by changing solute (urea or GB) concentration at constant salt molality. This analysis is accomplished using standard manipulations of partial derivatives. The basic mathematical relationship between (∂ ln Kobs/∂m3)m4 and (∂ ln Kobs/∂m3)a4 in an excess of solute components 3 and 4 (relative to biopolymer participants (70)) is
| (A1) |
The partial derivatives in the additive correction term in eq A1 are evaluated using experimental data:
| (A2) |
| (A3) |
| (A4) |
| (A5) |
Euler reciprocity is used in the second equality of equation A3. In equation A4, ΔOsm34 ≡ Osm(m3,m4) − Osm(m3) − Osm(m4) where Osm(m3) and Osm(m4) are osmolalities of two component solutions at the same molality as that of these solutes in the three component solution with osmolality Osm(m3,m4). The approximate relationship between μ34 and ΔOsm34, sufficiently accurate for this purpose, was originally presented by Robinson and Stokes (71) and was recently derived by Anderson and Record (72). In equation A5, ε± symbolizes the derivative ∂ lnγ±/∂ ln m4 of the mean ionic activity coefficient of the 1-1 salt with respect to its concentration.
Combining eqns A2-5 in eq A1 yields:
| (A6) |
In the limiting case where m3 approaches zero, the log-log salt derivative SKobs and the activity coefficient derivative ε± may be approximated by their values in the absence of the perturbing solute (component 3). The quantityΔOsm34/m3m4 = μ34/RT does not vanish as the urea concentration is reduced because it represents the intrinsic effect of salt concentration on the chemical potential of urea. For lac repressor binding to plasmid operator DNA, SKobs = −7.0 ± 1.0 in the vicinity of 0.3m KCl (30). For KCl solutions in the range 0.2–0.43m, (1+ ε±) m3=0 =0.893 ± 0.001 (49).
APPENDIX 2
Analysis of the Solute Concentration Dependence of ln Kobs using the Solute Partitioning Model: Initial Slope Method
Hong (23, thesis chapter 4 Appendix 1) generalized the basic thermodynamic relationship that expresses a concentration effect of a nonelectrolyte solute (3) on the observed equilibrium constant Kobs (or free energy change ) for a biopolymer process from a system containing one perturbing solute (58, 73) to the case where two perturbing solutes (e.g., GB and KCl) are present:
| (A7) |
where Γμ3 is a solute-biopolymer preferential interaction coefficient, ΔΓμ3 is the stoichiometrically weighted difference in preferential interaction coefficients between products and reactants, and ε3 ≡ (∂ ln γ3/∂ ln m3)T,P,a4. Major approximations in eq A7 are discussed by Hong (23). In the limit m3 → 0, but maintaining the excess of solute over any biopolymer reactant or product (denoted by numerical number 2) (m3 ≫m2), there is no significant difference between the bulk and the total solute concentration (74), and the initial slope of ln Kobs vs. m is given by
| (A8) |
For the interaction of a nonelectrolyte solute with a biopolymer, in the solute partitioning model (also called the local-bulk or two domain model) (16, 75), Γμ3/ m3 is expressed in terms of molecular parameters:
| (A9) |
In the first part of eq A9, B3 and B1 are the numbers of solute and water molecules in the local domain at the surface of a biopolymer and . In the second part of eq A9, the local-bulk solute partition coefficient Kp is defined as , the hydration of the biopolymer per unit area in the absence of solute , and S1,3 is the cumulative exchange stoichiometry (the number of water molecules displaced from the local domain divided by the number of solute molecules accumulated) (16, 75). As m3 → 0, using the superscript “o” to denote this limit,
| (A10) |
For the binding of a protein to a nucleic acid where the creation of the binding interface(s) is characterized by reductions in ASA of different types of biopolymer surface and where some water molecules (and, in principle, some solute molecules) are retained in these interface(s), eq A8 and eq A10 yield
| (A11) |
In eq A11, B3,I and B1,I are the numbers of solute and water molecules retained in the interface of the complex. Eq A11 assumes that contributions to ΔΓμ3 from interactions of solute with different types of biopolymer surface are additive (16–19). In eq A11, fi is the fraction of total surface of the ith type and ΔASAi is the change in the amount of water accessible biopolymer surface of this type in the process. The sum in eq A11 is over all types of biopolymer surface (i) for which ASAi changes; types of surface considered at the current level of resolution include anionic, polar amide, other polar, cationic, and nonpolar (18, 19). For binding processes, these ΔASAi are typically negative (as a result of forming the binding interfaces), although coupled conformational changes may expose some biopolymer surface (e.g., coupled unfolding). Each ΔASAi in eq A11 should be calculated without regard for any buried water (or solute) within the interface (no such water is present in relevant interfaces of the lac repressor-operator complex in 1 EFA). Then the term represents the contribution to (∂ lnKobs/∂ m3) a4,m3→ 0 from the ith type of surface for the situation where its interactions with water and solute are eliminated in formation of the complex.
For urea, the quantity is significantly different from zero only for interactions with polar amide surface (18). Interactions with cationic, anionic and nonpolar surface are an order of magnitude smaller and comparable to their uncertainties. The observation that GB has no significant effect on α-helix stability (Cannon, Heitkamp et al, unpublished), together with the data analyzed previously (19) indicates that is most significant for GB interaction with anionic surface, although interactions with other types of biopolymer surface may also contribute (see Discussion).
The term B1,I (and B3,I if relevant) in eq A11 accounts for the effect of any water (or solute) retained in the interface. No water is detected in the binding interface in crystal and NMR structures of repressor-operator complexes, though the 2.6 Å resolution of the crystal structure can not unambiguously allow one to conclude that water is totally absent from the interface. For every 10 waters remaining in the interface of the complex, the predicted value of the derivative (∂ lnKobs/∂ m3)a4,m3→0 (for any solute) is reduced by the amount 10/55.5 = 0.18 from that calculated by considering the contributions of the different types of dehydrated surface in eq A11. Therefore, if the presence of 40 residual water molecules in the interface of the complex were the explanation for the deviation between predicted and observed effects of GB (Δ(∂lnKobs/∂m3) = 2.5–1.8 =0.7), 40 water molecules should also contribute to the effect of urea on Kobs according to eq A11. If 40 water molecules were retained in the interfaces of the repressor-operator complex, the contribution to ∂lnKobs/∂murea ascribed to burial of polar amide surface would be changed from −2.1 to −1.4, a 33% reduction in the magnitude of the thermodynamic prediction for polar amide ΔASA, thereby introducing a 33% discrepancy between structural and thermodynamic predictions. Since such a discrepancy is well outside of experimental uncertainty, we interpret it to mean that substantially less than 40 water molecules are present in the interfaces of the repressor-operator complex, and that the discrepancy in the GB result is largely due to other factors, as discussed in the text.
Table A1
| KCl molality (m4) | SKobs for LacI-SymL | ΔOsm34/m3 m4 at m3→0 | 2 (1 + ε±)m3=0 | ||
|---|---|---|---|---|---|
| Urea: | |||||
| 0.212 | −7.0 | −0.09 ± 0.02 | 1.788 | −0.35 ± 0.09 | |
| 0.427 | −6.3 | −0.09 ± 0.01 | 1.785 | −0.33 ± 0.09 | |
| GB: | |||||
| 0.212 | −7.0 | −0.12 ± 0.01 | 1.788 | −0.43 ± 0.08 | |
| 0.404 | −6.3 | −0.10 ± 0.02 | 1.785 | −0.34 ± 0.09 | |
| 0.427 | −6.3 | −0.12 ± 0.02 | 1.785 | −0.42 ± 0.08 |
References
- 1.Dunker AK, Brown CJ, Lawson JD, Iakoucheva LM, Obradovic Z. Intrinsic disorder and protein function. Biochemistry. 2002;41:6573–82. doi: 10.1021/bi012159+. [DOI] [PubMed] [Google Scholar]
- 2.Ward JJ, Sodhi JS, McGuffin LJ, Buxton BF, Jones DT. Prediction and functional analysis of native disorder in proteins from the three kingdoms of life. J Mol Biol. 2004;337:635–45. doi: 10.1016/j.jmb.2004.02.002. [DOI] [PubMed] [Google Scholar]
- 3.Dyson HJ, Wright PE. Intrinsically unstructured proteins and their functions. Nat Rev Mol Cell Biol. 2005;6:197–208. doi: 10.1038/nrm1589. [DOI] [PubMed] [Google Scholar]
- 4.Spolar RS, Record MT. Coupling of Local Folding to Site-Specific Binding of Proteins to DNA. Science. 1994;263:777–784. doi: 10.1126/science.8303294. [DOI] [PubMed] [Google Scholar]
- 5.Whitson PA, Olson JS, Matthews KS. Thermodynamic analysis of the lactose repressor-operator DNA interaction. Biochemistry. 1986;25:3852–8. doi: 10.1021/bi00361a017. [DOI] [PubMed] [Google Scholar]
- 6.Ha JH, Spolar RS, Record MT., Jr Role of the hydrophobic effect in stability of site-specific protein-DNA complexes. J Mol Biol. 1989;209:801–16. doi: 10.1016/0022-2836(89)90608-6. [DOI] [PubMed] [Google Scholar]
- 7.Frank DE, Saecker RM, Bond JP, Capp MW, Tsodikov OV, Melcher SE, Levandoski MM, Record MT. Thermodynamics of the interactions of lac repressor with variants of the symmetric lac operator: Effects of converting a consensus site to a non-specific site. Journal of Molecular Biology. 1997;267:1186–1206. doi: 10.1006/jmbi.1997.0920. [DOI] [PubMed] [Google Scholar]
- 8.Spronk CA, Bonvin AM, Radha PK, Melacini G, Boelens R, Kaptein R. The solution structure of Lac repressor headpiece 62 complexed to a symmetrical lac operator. Structure with Folding & Design. 1999;7:1483–92. doi: 10.1016/s0969-2126(00)88339-2. [DOI] [PubMed] [Google Scholar]
- 9.Kalodimos CG, Folkers GE, Boelens R, Kaptein R. Strong DNA binding by covalently linked dimeric Lac headpiece: evidence for the crucial role of the hinge helices. Proceedings of the National Academy of Sciences of the United States of America. 2001;98:6039–44. doi: 10.1073/pnas.101129898. [DOI] [PMC free article] [PubMed] [Google Scholar]
- 10.Kalodimos CG, Bonvin AMJJ, Salinas RK, Wechselberger R, Boelens R, Kaptein R. Plasticity in protein-DNA recognition: lac repressor interacts with its natural operator O1 through alternative conformations of its DNA-binding domain. Embo Journal. 2002;21:2866–2876. doi: 10.1093/emboj/cdf318. [DOI] [PMC free article] [PubMed] [Google Scholar]
- 11.Kalodimos CG, Biris N, Bonvin AM, Levandoski MM, Guennuegues M, Boelens R, Kaptein R. Structure and flexibility adaptation in nonspecific and specific protein-DNA complexes. Science. 2004;305:386–9. doi: 10.1126/science.1097064. [DOI] [PubMed] [Google Scholar]
- 12.Lewis M, Chang G, Horton NC, Kercher MA, Pace HC, Schumacher MA, Brennan RG, Lu P. Crystal structure of the lactose operon repressor and its complexes with DNA and inducer. Science. 1996;271:1247–54. doi: 10.1126/science.271.5253.1247. [DOI] [PubMed] [Google Scholar]
- 13.Spronk CA, Slijper M, van Boom JH, Kaptein R, Boelens R. Formation of the hinge helix in the lac repressor is induced upon binding to the lac operator. Nature Structural Biology. 1996;3:916–9. doi: 10.1038/nsb1196-916. [DOI] [PubMed] [Google Scholar]
- 14.Myers JK, Pace CN, Scholtz JM. Denaturant m values and heat capacity changes: relation to changes in accessible surface areas of protein unfolding. Protein Science. 1995;4:2138–48. doi: 10.1002/pro.5560041020. [DOI] [PMC free article] [PubMed] [Google Scholar]
- 15.Scholtz JM, Barrick D, York EJ, Stewart JM, Baldwin RL. Urea Unfolding of Peptide Helices as a Model for Interpreting Protein Unfolding. Proceedings of the National Academy of Sciences of the United States of America. 1995;92:185–189. doi: 10.1073/pnas.92.1.185. [DOI] [PMC free article] [PubMed] [Google Scholar]
- 16.Courtenay ES, Capp MW, Saecker RM, Record MT. Thermodynamic analysis of interactions between denaturants and protein surface exposed on unfolding: Interpretation of urea and guanidinium chloride m-values and their correlation with changes in accessible surface area (ASA) using preferential interaction coefficients and the local-bulk domain model. Proteins-Structure Function and Genetics. 2000b:72–85. doi: 10.1002/1097-0134(2000)41:4+<72::aid-prot70>3.0.co;2-7. [DOI] [PubMed] [Google Scholar]
- 17.Courtenay ES, Capp MW, Record MT. Thermodynamics of interactions of urea and guanidinium salts with protein surface: Relationship between solute effects on protein processes and changes in water-accessible surface area. Protein Science. 2001;10:2485–2497. doi: 10.1110/ps.ps.20801. [DOI] [PMC free article] [PubMed] [Google Scholar]
- 18.Hong J, Capp MW, Anderson CF, Saecker RM, Felitsky DJ, Anderson MW, Record MT. Preferential Interactions of Glycine Betaine and of Urea with DNA: Implications for DNA Hydration and for Effects of These Solutes on DNA Stability. Biochemistry. 2004;43:14744–58. doi: 10.1021/bi049096q. [DOI] [PubMed] [Google Scholar]
- 19.Felitsky DJ, Cannon JG, Capp MW, Hong J, Van Wynsberghe AW, Anderson CF, Record MT., Jr The exclusion of glycine betaine from anionic biopolymer surface: why glycine betaine is an effective osmoprotectant but also a compatible solute. Biochemistry. 2004b;43:14732–43. doi: 10.1021/bi049115w. [DOI] [PubMed] [Google Scholar]
- 20.Laiken SL, Gross CA, Von Hippel PH. Equilibrium and kinetic studies of Escherichia coli lac repressor-inducer interactions. J Mol Biol. 1972;66:143–155. doi: 10.1016/s0022-2836(72)80012-3. [DOI] [PubMed] [Google Scholar]
- 21.Rosenberg JM, Khallai OB, Kopka ML, Dickerson RE, Riggs AD. Lac repressor purification without inactivation of DNA binding activity. Nucleic Acids Res. 1977;4:567–572. doi: 10.1093/nar/4.3.567. [DOI] [PMC free article] [PubMed] [Google Scholar]
- 22.Levandoski MM. PhD Disertation. University of Wisconsin-Madison; Madison: 1995. [Google Scholar]
- 23.Hong J. PhD Disertation. University of Wisconsin-Madison; Madison: 2004. [Google Scholar]
- 24.Butler AP, Revzin A, von Hippel PH. Molecular parameters characterizing the interaction of Escherichia coli lac repressor with non-operator DNA and inducer. Biochemistry. 1977;16:4757–4768. doi: 10.1021/bi00641a001. [DOI] [PubMed] [Google Scholar]
- 25.Levandoski MM, Tsodikov OV, Frank DE, Melcher SE, Saecker RM, Record MT. Cooperative and anticooperative effects in binding of the first and second plasmid O-sym operators to a Lacl tetramer: Evidence for contributions of non-operator DNA binding by wrapping and looping. Journal of Molecular Biology. 1996;260:697–717. doi: 10.1006/jmbi.1996.0431. [DOI] [PubMed] [Google Scholar]
- 26.Simons TDA, von Wilcken-Bergmann B, Muller-Hill B. Possible ideal lac operator: Escherichia coli lac operator-like sequences from eukaryotic genomes lack the central G X C pair. Proc Natl Acad Sci U S A. 1984;81:1624–1628. doi: 10.1073/pnas.81.6.1624. [DOI] [PMC free article] [PubMed] [Google Scholar]
- 27.Sambrook J, Fritsch EF, Maniatis T. Molecular Cloning. 2. Cold Spring Harbor Laboratory Press; Cold Spring Harbor, New York: 1989. [Google Scholar]
- 28.Law SM, Bellomy GR, Schlax PJ, Record MT., Jr In vivo thermodynamic analysis of repression with and without looping in lac constructs. Estimates of free and local lac repressor concentrations and of physical properties of a region of supercoiled plasmid DNA in vivo. J Mol Biol. 1993;230:161–73. doi: 10.1006/jmbi.1993.1133. [DOI] [PubMed] [Google Scholar]
- 29.Riggs AD, Suzuki H, Bourgeois S. Lac repressor-operator interaction. I Equilibrium studies. J Mol Biol. 1970;48:67–83. doi: 10.1016/0022-2836(70)90219-6. [DOI] [PubMed] [Google Scholar]
- 30.Tsodikov OV, Saecker RM, Melcher SE, Levandoski MM, Frank DE, Capp MW, Record MT. Wrapping of flanking non-operator DNA in lac repressor-operator complexes: implications for DNA looping. Journal of Molecular Biology. 1999;294:639–655. doi: 10.1006/jmbi.1999.3283. [DOI] [PubMed] [Google Scholar]
- 31.Winter RB, Berg OG, von Hippel PH. Diffusion-driven mechanisms of protein translocation on nucleic acids. 3 The Escherichia coli lac repressor--operator interaction: kinetic measurements and conclusions. Biochemistry. 1981;20:6961–77. doi: 10.1021/bi00527a030. [DOI] [PubMed] [Google Scholar]
- 32.Barkley MD. Salt dependence of the kinetics of the lac repressor-operator interaction: role of nonoperator deoxyribonucleic acid in the association reaction. Biochemistry. 1981;20:3833–42. doi: 10.1021/bi00516a026. [DOI] [PubMed] [Google Scholar]
- 33.Barry JK, Matthews KS. Substitutions at histidine 74 and aspartate 278 alter ligand binding and allostery in lactose repressor protein. Biochemistry. 1999;38:3579–90. doi: 10.1021/bi982577n. [DOI] [PubMed] [Google Scholar]
- 34.Barry JK, Matthews KS. Thermodynamic analysis of unfolding and dissociation in lactose repressor protein. Biochemistry. 1999b;38:6520–8. doi: 10.1021/bi9900727. [DOI] [PubMed] [Google Scholar]
- 35.Wong I, Chao KL, Bujalowski W, Lohman TM. DNA-induced dimerization of the Escherichia coli rep helicase. Allosteric effects of single-stranded and duplex DNA. J Biol Chem. 1992;267:7596–610. [PubMed] [Google Scholar]
- 36.Johnson ML, Frasier SG. Non-linear least-square analysis. Methods Enzymol. 1985;117:301–342. [Google Scholar]
- 37.Bevington PR, Robinson DK. Data Reduction and Error Analysis for the Physical Sciences. 2. WCB McGraw-Hill; Boston: 1992. [Google Scholar]
- 38.Richmond TJ. Solvent Accessible Surface-Area and Excluded Volume in Proteins - Analytical Equations for Overlapping Spheres and Implications for the Hydrophobic Effect. Journal of Molecular Biology. 1984;178:63–89. doi: 10.1016/0022-2836(84)90231-6. [DOI] [PubMed] [Google Scholar]
- 39.Livingstone JR, Spolar RS, Record MT. Contribution to the Thermodynamics of Protein Folding from the Reduction in Water-Accessible Nonpolar Surface-Area. Biochemistry. 1991;30:4237–4244. doi: 10.1021/bi00231a019. [DOI] [PubMed] [Google Scholar]
- 40.Bell CE, Lewis M. A closer view of the conformation of the Lac repressor bound to operator. Nat Struct Biol. 2000;7:209–14. doi: 10.1038/73317. [DOI] [PubMed] [Google Scholar]
- 41.Berman HM, Westbrook J, Feng Z, Gilliland G, Bhat TN, Weissig H, Shindyalov IN, Bourne PE. The Protein Data Bank. Nucleic Acids Res. 2000;28:235–42. doi: 10.1093/nar/28.1.235. [DOI] [PMC free article] [PubMed] [Google Scholar]
- 42.Creamer TP, Srinivasan R, Rose GD. Modeling unfolded states of proteins and peptides.2 Backbone solvent accessibility. Biochemistry. 1997;36:2832–2835. doi: 10.1021/bi962819o. [DOI] [PubMed] [Google Scholar]
- 43.Fried MG, Stickle DF, Smirnakis KV, Adams C, MacDonald D, Lu P. Role of hydration in the binding of lac repressor to DNA. J Biol Chem. 2002;277:50676–82. doi: 10.1074/jbc.M208540200. [DOI] [PubMed] [Google Scholar]
- 44.Hong J, Capp MW, Anderson CF, Record MT. Preferential interactions in aqueous solutions of urea and KCl. Biophys Chem. 2003;105:517–32. doi: 10.1016/s0301-4622(03)00112-1. [DOI] [PubMed] [Google Scholar]
- 45.Felitsky DJ, Record MT. Application of the local-bulk partitioning and competitive binding models to interpret preferential interactions of glycine betaine and urea with protein surface. Biochemistry. 2004a;43:9276–9288. doi: 10.1021/bi049862t. [DOI] [PubMed] [Google Scholar]
- 46.Santoro MM, Liu YF, Khan SMA, Hou LX, Bolen DW. Increased Thermal-Stability of Proteins in the Presence of Naturally-Occurring Osmolytes. Biochemistry. 1992;31:5278–5283. doi: 10.1021/bi00138a006. [DOI] [PubMed] [Google Scholar]
- 47.Greene RF, Pace CN. Urea and guanidine hydrochloride denaturation of ribonuclease, lysozyme, alpha-chymotrypsin, and beta-lactoglobulin. Journal of Biological Chemistry. 1974;249:5388–93. [PubMed] [Google Scholar]
- 48.Felitsky DJ, Record MT., Jr Thermal and urea-induced unfolding of the marginally stable lac repressor DNA-binding domain: a model system for analysis of solute effects on protein processes. Biochemistry. 2003;42:2202–17. doi: 10.1021/bi0270992. [DOI] [PubMed] [Google Scholar]
- 49.Archer DG. Thermodynamic properties of the KCl+H2O system. Journal of Physical and Chemical Reference Data. 1999;28:1–17. [Google Scholar]
- 50.Auton M, Bolen DW. Additive transfer free energies of the peptide backbone unit that are independent of the model compound and the choice of concentration scale. Biochemistry. 2004;43:1329–42. doi: 10.1021/bi035908r. [DOI] [PubMed] [Google Scholar]
- 51.Rafflenbeul L, Pang WM, Schonert H, Haberle K. Thermodynamics of hydrophobic interaction in the systems water + glycine + urea and water + alanine + urea at 25 degrees C. Z Naturforsch [C] 1973;28:533–54. [PubMed] [Google Scholar]
- 52.Schonert H, Stroth L. Thermodynamic Interaction Between Urea and the Peptide Group in Aqueous Solutions at 25C. Biopolymers. 1981;20:817–831. [Google Scholar]
- 53.Naik MT, Huang TH. Conformational stability and thermodynamic characterization of the lipoic acid bearing domain of human mitochondrial branched chain alpha-ketoacid dehydrogenase. Protein Sci. 2004;13:2483–92. doi: 10.1110/ps.04783104. [DOI] [PMC free article] [PubMed] [Google Scholar]
- 54.Khurana R, Hate AT, Nath U, Udgaonkar JB. pH dependence of the stability of barstar to chemical and thermal denaturation. Protein Sci. 1995;4:1133–44. doi: 10.1002/pro.5560040612. [DOI] [PMC free article] [PubMed] [Google Scholar]
- 55.Wallace LA, Sluis-Cremer N, Dirr HW. Equilibrium and kinetic unfolding properties of dimeric human glutathione transferase A1-1. Biochemistry. 1998;37:5320–8. doi: 10.1021/bi972936z. [DOI] [PubMed] [Google Scholar]
- 56.Schellman JA. The Thermodynamics of Solvent Exchange. Biopolymers. 1994;34:1015–1026. doi: 10.1002/bip.360340805. [DOI] [PubMed] [Google Scholar]
- 57.Timasheff SN. Control of protein stability and reactions by weakly interacting cosolvents: The simplicity of the complicated. Advances in Protein Chemistry. 1998;51:355–432. doi: 10.1016/s0065-3233(08)60656-7. [DOI] [PubMed] [Google Scholar]
- 58.Wyman J., Jr Linked Functions and Reciprocal Effects in Hemoglobin: A Second Look. Adv Protein Chem. 1964;19:223–86. doi: 10.1016/s0065-3233(08)60190-4. [DOI] [PubMed] [Google Scholar]
- 59.Felitsky DJ, Cannon JG, Capp MW, Hong J, Van Wynsberghe AW, Anderson CF, Record MT., Jr The exclusion of glycine betaine from anionic biopolymer surface: why glycine betaine is an effective osmoprotectant but also a compatible solute. Biochemistry. 2004;43:14732–43. doi: 10.1021/bi049115w. [DOI] [PubMed] [Google Scholar]
- 60.Schiefner A, Breed J, Bosser L, Kneip S, Gade J, Holtmann G, Diederichs K, Welte W, Bremer E. Cation-pi interactions as determinants for binding of the compatible solutes glycine betaine and proline betaine by the periplasmic ligand-binding protein ProX from Escherichia coli. J Biol Chem. 2004;279:5588–96. doi: 10.1074/jbc.M309771200. [DOI] [PubMed] [Google Scholar]
- 61.Rees WA, Yager TD, Korte J, von Hippel PH. Betaine can eliminate the base pair composition dependence of DNA melting. Biochemistry. 1993;32:137–44. doi: 10.1021/bi00052a019. [DOI] [PubMed] [Google Scholar]
- 62.Spolar RS, Livingstone JR, Record MT. Use of Liquid-Hydrocarbon and Amide Transfer Data to Estimate Contributions to Thermodynamic Functions of Protein Folding from the Removal of Nonpolar and Polar Surface from Water. Biochemistry. 1992;31:3947–3955. doi: 10.1021/bi00131a009. [DOI] [PubMed] [Google Scholar]
- 63.Kozlov AG, Lohman TM. Large contributions of coupled protonation equilibria to the observed enthalpy and heat capacity changes for ssDNA binding to Escherichia coli SSB protein. Proteins Suppl. 2000;4:8–22. doi: 10.1002/1097-0134(2000)41:4+<8::aid-prot20>3.0.co;2-h. [DOI] [PubMed] [Google Scholar]
- 64.Eftink MR, Anusiem AC, Biltonen RL. Enthalpy-entropy compensation and heat capacity changes for protein-ligand interactions: general thermodynamic models and data for the binding of nucleotides to ribonuclease A. Biochemistry. 1983;22:3884–96. doi: 10.1021/bi00285a025. [DOI] [PubMed] [Google Scholar]
- 65.Bergqvist S, Williams MA, O'Brien R, Ladbury JE. Heat capacity effects of water molecules and ions at a protein-DNA interface. J Mol Biol. 2004;336:829–42. doi: 10.1016/j.jmb.2003.12.061. [DOI] [PubMed] [Google Scholar]
- 66.Holbrook JA, Tsodikov OV, Saecker RM, Record MT. Specific and non-specific interactions of integration host factor with DNA: Thermodynamic evidence for disruption of multiple IHF surface salt-bridges coupled to DNA binding. Journal of Molecular Biology. 2001;310:379–401. doi: 10.1006/jmbi.2001.4768. [DOI] [PubMed] [Google Scholar]
- 67.Schnarr M, Maurizot JC. Unfolding of lac repressor and its proteolytic fragment by urea: headpieces stabilize the core within lac repressor. Biochemistry. 1981;20:6164–9. doi: 10.1021/bi00524a039. [DOI] [PubMed] [Google Scholar]
- 68.Kontur WS, Saecker RM, Davis CA, Capp MW, Thomas M, Record J. Solute probes of conformational changes in open complex formation by E. coli RNA polymerase at the λPR promoter: evidence for unmasking of the active site in the isomerization step and for large-scale coupled folding in the subsequent conversion to RPo. Biochemistry. 2005 doi: 10.1021/bi051835v. [DOI] [PMC free article] [PubMed] [Google Scholar]
- 69.Mekler V, Kortkhonjia E, Mukhopadhyay J, Knight J, Revyakin A, Kapanidis AN, Niu W, Ebright YW, Levy R, Ebright RH. Structural organization of bacterial RNA polymerase holoenzyme and the RNA polymerase-promoter open complex. Cell. 2002;108:599–614. doi: 10.1016/s0092-8674(02)00667-0. [DOI] [PubMed] [Google Scholar]
- 70.Anderson CF, Record MT. Salt Dependence of Oligoion Polyion Binding - a Thermodynamic Description Based on Preferential Interaction Coefficients. Journal of Physical Chemistry. 1993;97:7116–7126. [Google Scholar]
- 71.Robinson RA, Stokes RH. Activity coefficients in aqueous solutions of sucrose, mannitol and their mixtures at 25 degrees. Journal of Physical Chemistry. 1961;65:1954–1958. [Google Scholar]
- 72.Anderson CF, Record MT., Jr Gibbs-Duhem-based relationships among derivatives expressing the concentration dependences of selected chemical potentials for a multicomponent system. Biophys Chem. 2004;112:165–75. doi: 10.1016/j.bpc.2004.07.016. [DOI] [PubMed] [Google Scholar]
- 73.Record MT, Zhang WT, Anderson CF. Analysis of effects of salts and uncharged solutes on protein and nucleic acid equilibria and processes: A practical guide to recognizing and interpreting polyelectrolyte effects, Hofmeister effects, and osmotic effects of salts. Advances in Protein Chemistry. 1998;51:281–353. doi: 10.1016/s0065-3233(08)60655-5. [DOI] [PubMed] [Google Scholar]
- 74.Courtenay ES, Capp MW, Anderson CF, Record MT. Vapor pressure osmometry studies of osmolyte-protein interactions: Implications for the action of osmoprotectants in vivo and for the interpretation of “osmotic stress” experiments in vitro. Biochemistry. 2000a;39:4455–4471. doi: 10.1021/bi992887l. [DOI] [PubMed] [Google Scholar]
- 75.Record MT, Anderson CF. Interpretation of Preferential Interaction Coefficients of Nonelectrolytes and of Electrolyte Ions in Terms of a Two-Domain Model. Biophysical Journal. 1995;68:786–794. doi: 10.1016/S0006-3495(95)80254-7. [DOI] [PMC free article] [PubMed] [Google Scholar]
- 76.Kraulis PJ. MOLSCRIPT: A Program to Produce Both Detailed and Schematic Plots of Protein Structures. Journal of Applied Crystallography. 1991;24:946–950. [Google Scholar]
- 77.Merritt EA, Bacon DJ. Raster3D: Photorealistic Molecular Graphics. Methods in Enzymology. 1997;277:505–524. doi: 10.1016/s0076-6879(97)77028-9. [DOI] [PubMed] [Google Scholar]
Associated Data
This section collects any data citations, data availability statements, or supplementary materials included in this article.
Supplementary Materials
In Supporting Information we tabulate the observed values of KTO at the concentrations of urea, GB, and KCl investigated here, as well as the corrected values of KTO in GB experiments in which KCl and glycerol molality varied slightly with GB molality. Individual values of surface area changes and corresponding m-values for the set of monomeric and dimeric proteins summarized in Table 3 are also reported. In addition, the details of the thermodynamic analysis using a solute partitioning model are presented. This analysis is used to interpret the curvature in ln Kobs as a function of GB concentration. The Supporting Information is available free of charge via the Internet at http://pubs.acs.org.