Abstract
Nanofluidic channels can be used to enhance surface binding reactions, since the target molecules are closely confined to the surfaces that are coated with specific binding partners. Moreover, diffusion-limited binding can be significantly enhanced if the molecules are steered into the nanochannels via either pressure-driven or electrokinetic flow. By monitoring the nanochannel impedance, which is sensitive to surface binding, low analyte concentrations have been detected electrically in nanofluidic channels within response times of 1–2 hours. This represents a ~54 fold reduction in the response time using convective flow compared to diffusion-limited binding. At high flow velocities the presented method of reaction kinetics enhancement is potentially limited by force-induced dissociations of the receptor-ligand bonds. Optimization of this scheme could be useful for label-free, electrical detection of biomolecule binding reactions within nanochannels on a chip.
Keywords: NANOFLUIDICS, BINDING KINETICS, ENHANCED MASS TRANSPORT, CONVECTION, ELECTRICAL BIOSENSOR, IMPEDANCE SPECTROSCOPY, FUNCTIONALIZATION, STREPTAVIDIN-BIOTIN
One limiting factor for low-abundance analyte detection by immunoassay is the existence of surface diffusion layers, which limits the binding kinetics. In typical ELISA (Enzyme Linked ImmunoSorbent Assays) or bead-based immunoassays, target molecules need to be transported (primarily by diffusion) to the surface-bound antibodies for a binding reaction to occur. The distance for this diffusive transport is roughly corresponding to the average distance between the two target molecules in the sample solution, which can be as large as ~10 µm at lower concentrations (~pM). Diffusive transport at that length scale is relatively slow and inefficient, therefore leading to analyte depletion near the binding surface. This can significantly limit the speed of assays, requiring long incubation times to reach binding equilibrium.1
One way to deal with this problem would be shortening this distance, by confining both target molecules and the antibodies within a nanofluidic channel. Karnik et al.2 have studied streptavidin-biotin binding in nanochannels, demonstrating the dominance of size and charge effects at high and low ionic strengths, respectively. Largest conductance changes after streptavidin immobilization to biotinylated surfaces were observed at low ionic strength, and the conductance increase was associated with an increase in the surface charge due to the additional net charge of streptavidin. While the work of Karnik et al. clearly demonstrates the possibility of electrical detection of chemical binding in nanochannels, the reported reactions were largely diffusion-limited, at relatively high concentrations of ~19 µM (1 mg/ml).
We demonstrate that diffusion-limited reactions can be overcome by performing the detection of analytes in nanochannels with an applied convective flow through them to enhance mass transport. This results in fast reaction kinetics in nanofluidic channels and thus a reduction in the response time to detect a specific target molecule even at low analyte concentrations. Compared to the diffusional transport limit, the response time is decreased by a factor of ~54 by using pressure-driven flow through nanochannels. Surface diffusion layer are circumvented because of the small height of the nanochannels, such that the diffusion of molecules towards the walls is very efficient and analyte molecules almost always have to hit the walls (and get bound to the binding partners) during their translocation through nanometer-sized channels. This is even applicable at very high axial flow velocities in nanochannels, mainly because our ratio of nanochannel length to height is big, in such a way that the axial convection time is in most instances longer than the radial diffusion time. To overcome nonspecific binding of proteins, we coat the channel surfaces with an end-functionalized protein-resistant monolayer, bearing high potentiality for localized selective surface modifications in micro total analysis systems.3 The presented biosensor on a chip is operated electrically, and such devices generally hold promise in medicine, point-of-care diagnostics, and drug discovery.4
Nanochannels for electrical sensing of biomolecules were fabricated in Pyrex using fusion bonding for their encapsulation. Two microchannels were bulk-micromachined in Pyrex, and underetching was reduced by means of a polysilicon mask. Then, 100-nm-thick platinum electrodes with a 10-nm-thin adhesion layer of titanium were patterned at the bottom of the microchannels using a standard lift-off technique. The two microchannels were connected by etching the nanochannels. Buffered oxide etch (7:1), used in nanochannel etching, allowed precise channel depth control since it has an etch-rate of 24 nm/min in glass at room temperature.5 For the glass-glass fusion bonding of the wafer containing the micro- and nanochannels to the Pyrex wafer with ultrasonically pre-drilled holes (SENSOR Prep Services, Inc., Elburn, IL), both wafers were cleaned with a Piranha process followed by surface activation in a heated ammonium hydroxide bath for 30 min. Thereafter, both wafers were assembled to form a spontaneous bonding between them, and they were subsequently annealed at 550°C overnight.5 Afterwards, the wafers were diced into chips such that they could be placed into a chip holder with integrated o-rings and spring-loaded contacts, allowing convenient fluidic and electrical connections.
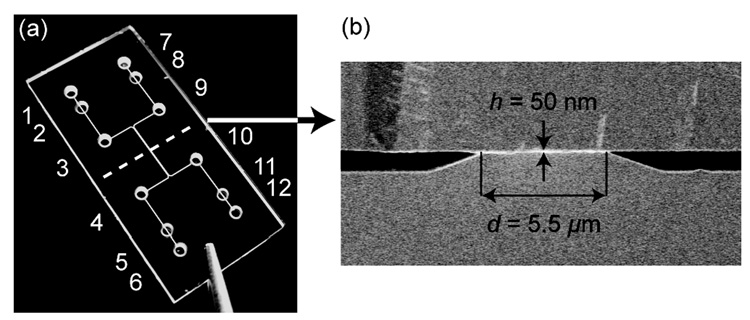
Figure 1a shows the nanochannel chip where holes 1–6 are assigned to the left microchannel, and holes 7–12 to the right microchannel. Holes 3, 9 and 4, 10 serve for fluidic access and waste of each microchannel, respectively, and electrical contact can be made through the pads in holes 1, 7 or 6, 12. To control the pressure in the chip and prevent liquid flow into the electrical contact sites, holes 2, 5, 8, and 11 were sealed with nonconductive glue. Different chip configurations were fabricated with 1, 2, 5, and 10 nanochannels joining the two microchannels. Each nanochannel has the following dimensions: height h = 50 nm, width w = 50 µm, and length d = 5.5 µm. The microchannels are 850 nm high and 50 µm wide.
Figure 1. Design of the device, consisting of two microchannels joined by nanochannels.
(a) Photograph of the 12 × 25 mm chip showing the two microchannels and access holes. The cross-sectional view along the dotted line is presented in (b), a scanning electron microscope image showing two microchannels with electrodes at their bottom, which are connected by nanochannels with height h = 50 nm and length d = 5.5 µm.
The conductance of the nanochannels was measured with impedance spectroscopy, performed with the precision LCR meter E4980A (Agilent Technologies, Inc., Englewood, CO) in the range of 20 Hz – 2 MHz with a peak-to-peak voltage of 50 mV. The instrument was controlled by a Matlab or LabView interface program. As described previously,6 the measured signal at a given frequency, which is ~500 Hz for the investigated nanochannels and electrolyte solutions, corresponds to the resistance of the nanochannel junction between the two microchannels. This is because the electrodes are situated closely to both ends of the nanochannels, such that the resistance of the nanochannel would be dominant over other resistive components like the microchannel solution resistance, for example. This setup is different from previously reported experiments where nanogaps were used to detect biomolecules through changes in the dielectric constant of the gap, using impedance measurements over the height of the nanogap.7, 8
For electrical detection of immobilized proteins in nanochannels, streptavidin-biotin was chosen as the model receptor-ligand pair. To perform such bindings in nanochannels, surfaces were pre-coated with the commercially available polymer PLL(20)-g[3.5]-PEG(2)/PEG(3.4)-Biotin (50%) (SurfaceSolutionS, Zurich, Switzerland) at 0.1 mg/ml, subsequently referred to PLL-g-PEGbiotin. This polymer is end-functionalized with biotin and therefore reacts selectively with streptavidin (Molecular Probes, Inc., Eugene, OR).9 Control measurements were performed by modifying surfaces with a layer which is highly effective in reducing the adsorption of proteins,10 PLL(20)-g[3.5]-PEG(2) (SurfaceSolutionS, Zurich, Switzerland) at 0.1 mg/ml, denoted PLL-g-PEG in this work. These polymers have been developed for biomedical applications because they spontaneously adsorb from aqueous solutions to oxide surfaces due to the positively charged poly(l-lysine) group at neutral pH,11 they are protein-resistant due to the poly(ethylene glycol) group forming a comblike structure, and they can be end-functionalized to react selectively with a target molecule. All solutions and experiments are based on a 10 mM HEPES buffer solution (Sigma-Aldrich, St. Louis, MO), adjusted to pH 7.4 with NaOH (Sigma-Aldrich, St. Louis MO), which has an equivalent ionic strength of ~5.6 mM 12 and a Debye length λD = 4.1 nm. At this ionic strength the PLL-g-PEG/PEGbiotin layer is sufficiently thick to shield electrical double layer forces since the monolayer thickness of ~12 nm13, 14 exceeds the Debye length.15 The chips have been stocked in the buffer solution for at least 48 h before use.
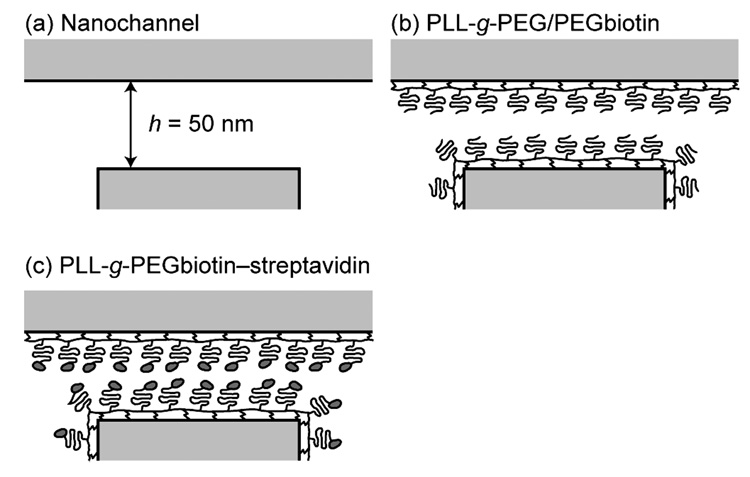
The procedure for nanochannel surface coating is described in the following. By applying a vacuum at the fluidic waste reservoirs, the chip was flushed with buffer solution for 10 min, leading to a repeatability error of ~3%, measured on the same chip after un-/coupling to the chip holder and electrolyte refilling. Then PLL-g-PEG/PEGbiotin was driven into the channels and incubated for 1 h, resulting in the formation of a monolayer [Figure 2(b)], followed by a 30 min rinsing step with buffer solution to remove excess polymer. To assure that the polymer adsorbed on the electrodes does not change the electrical signal, PLL-g-PEG/PEGbiotin has been desorbed from the electrode surfaces by applying 1.8 V between the microfabricated electrodes and the reservoirs for 30 min, which does not induce polymer loss from the silicon oxide regions.16 Subsequently, the channels were rinsed twice with buffer solution, for 30 min and 1 h.
Figure 2. Schematic drawing of sequential surface modifications for streptavidin sensing.
(a) 50-nm-high nanochannel in Pyrex before surface modification. (b) Channel after coating with PLL-g-PEG/PEGbiotin, which monolayer has a height of ~12 nm.13, 14 (c) Final assembly after the streptavidin-biotin reaction, which binding can be sensed by a conductance change of the nanochannel.
For the binding experiment in nanochannels with/ without flow, initially the micro- and nanochannels were filled with the streptavidin solution (various concentrations), and then it was either incubated for 1 h without any induced flow (streptavidin should diffuse into nanochannels for binding), or it was subject to a continuous fluid flow through the nanochannels (streptavidin is convectively driven into nanochannels for binding) [Figure 2(c)]. Since streptavidin has an individual molecular size of about 5 nm (ref 17), the final polymer layer (after streptavidin binding to PEGbiotin) would decrease the effective nanochannel height to ~16 nm. The channels were then rinsed with buffer solution for 30 min and the conductance of the nanochannel was measured. All subsequently reported conductance values were measured in buffer solution only, after rinsing. Between experiments, the channels were cleaned for 1 h with 1 M sodium chloride and 1 wt % SDS, removing PLL-g-PEG/PEGbiotin layers,3 which has been verified in our nanofluidic channels by measuring their conductance before and after cleaning.
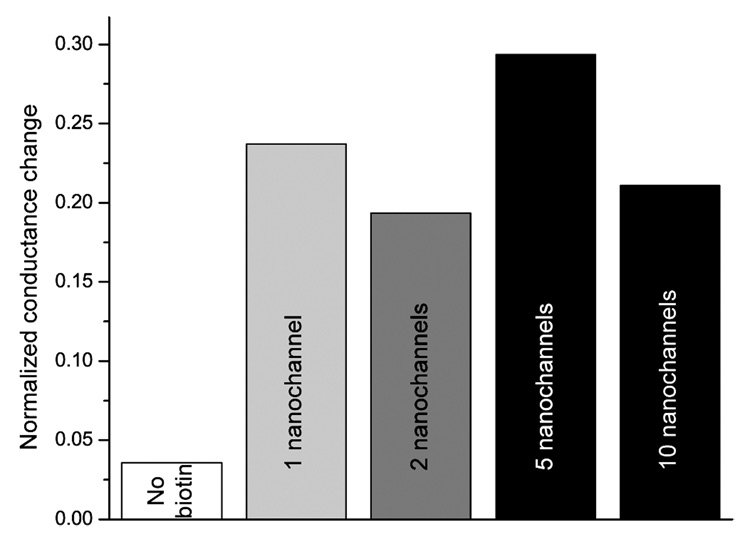
Different chips with 1, 2, 5, and 10 nanochannels have been investigated at high streptavidin concentration of 10 µM after 1 h incubation, presented in Figure 3. At this streptavidin concentration and incubation time, streptavidin binding to the nanochannel wall would be saturated. The normalized conductance is the difference between the conductance after and before streptavidin binding, divided by the conductance before binding, and a positive value therefore reflects a conductance increase. The measurements show that the normalized conductance change varies between 19% and 29%, which is attributed to differences in the surface charge density of the nanochannels but not the number of nanochannels. This is due to variations in the native surface charge of SiO2, leading to differences in monolayer and hence streptavidin densities.15 The surface of these channels was modified with PLL-g-PEGbiotin except for the control measurement in which nanochannels were coated with a protein resistant PLL-g-PEG monolayer, leading to a normalized conductance change of 3.6%. This value is slightly higher than the repeatability error limit of ~3%, confirming a negligible amount nonspecific protein adsorption.
Figure 3.
Difference between the conductance after and before streptavidin binding, divided by the conductance before binding of 10 µM streptavidin using 1 h incubation. The signal change is independent on the numbers of nanochannels. For the control measurement the channels were coated with PLL-g-PEG (no biotin), whereas all other chips were pretreated with PLL-g-PEGbiotin.
After the channel coating with PLL-g-PEG/PEGbiotin the normalized conductance of the nanochannels decreased by ~50%, corroborating that the nanochannel height h decreased from 50 nm to ~25 nm due to the ~12 nm thick polymer monolayers. PEG coating is uncharged,11 therefore leading to a neutral nanochannels which conductance is entirely described by the geometry of the nanometer-sized openings. A further binding reaction between PLL-g-PEGbiotin and streptavidin would reduce the effective height of the nanochannel down to ~16 nm. Since streptavidin has a net charge of about −2e at pH 7.4 (ref 18), a more negatively charged nanochannel does results after binding. Thus, one would observe a higher nanochannel conductance after streptavidin binding, because the conductance is dominated by the surface charge density.19 Using the model of ref 19 with a maximal surface coverage γ0 = 2.4 × 10¹⁶ streptavidin molecules/m2 (ref 20), a normalized conductance change of ~15% is calculated, close to the measured average value of 24% after 1 h incubation.
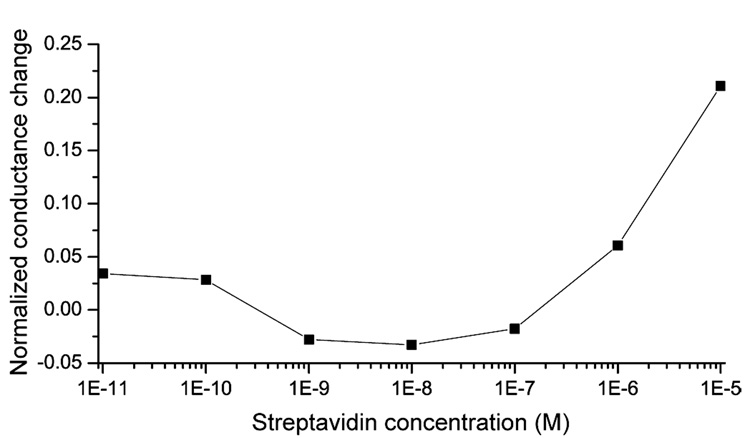
To determine the lowest detectable concentration of biomolecules using a 1 h diffusion-limited reaction, the normalized conductance change was investigated as a function of the streptavidin concentration (Figure 4). With this procedure the lowest detectable streptavidin concentration in nanochannels is estimated to be 0.4 µM. At lower biomolecule concentrations, detected nanochannel conductance changes were within the repeatability error of ~3%. The poor detectability at lower streptavidin concentrations can be attributed to the fact that binding equilibrium has not been reached within the used 1 h incubation time as discussed subsequently.
Figure 4.
Normalized conductance change of the nanochannels as a function of the streptavidin concentration. After 1 h incubation of streptavidin solution, concentrations down to ~0.4 µM can be measured whereas lower streptavidin concentrations were within the repeatability error limit because binding equilibrium has not been reached yet. The connecting lines are for guidance only.
To understand the reason why lowest streptavidin concentrations have not been detected in Figure 4, the process of diffusion-limited patterning of nanochannels has to be considered which has been described by Karnik et al.21 They have calculated that under diffusion the coating time tdiff of a nanochannel with a length d is
| (1) |
where P is the perimeter of the nanochannel cross-"Ption, D is the diffusion constant of the analyte (6 × 10⁻¹¹ m2/s for streptavidin), A is the cross-section of the nanochannel, and c is the streptavidin concentration. According to eq (1), the coating time is proportional to d2, and inversely proportional to the analyte concentration c. This time is calculated to be as long as tdiff ≈ 54 h for 1 nM streptavidin solution in our nanochannels, and assuming γ0 = 2.4 × 10¹⁶ m−2 as described above. Another relevant timescale for binding would be the time for a streptavidin molecule in the microchannel to find the nanochannel inlet (transport at the micro-nanochannel interface). This transition from microchannel to nanochannel can be affected by the formation of analyte depletion zone near the nanochannel inlet,1 as well as steric hindrance of biomolecules at the micro-nanochannel junction.22 However, delays caused by these two effects would be much shorter in general, and therefore can be ignored in this experiment.
The response time can be significantly improved by using pressure-driven or electro-osmotic flow through the nanochannels, instead of relying on diffusion. For this situation the flux is given by ϕ = Avc, where v is the velocity, and under the assumption of quasi-steady state, the rate of consumption of the nanochannel is Pγ0(dx/dt), which has to be equal to the flux of streptavidin.21 Consequently, the coating time in flow is calculated to be
| (2) |
Under active flow the response time is now proportional to d, rather than d2 in the diffusion-limited binding regime. Moreover, tflow can be further reduced by increasing the flow velocity v through the nanochannel. The only limitation to this mode of reaction kinetics enhancement would come from the limit where the average analyte transit time through the nanochannel (d/v) becomes comparable to the radial diffusion time within the nanochannel ((h/2)2/2D). In other words, analytes will pass the nanochannel without ever diffusing to the surface of the nanochannel in this limit. In our experiment, this limit corresponds to vl ≈ 3.9 m/s, mainly because of the small height h of the nanochannel.
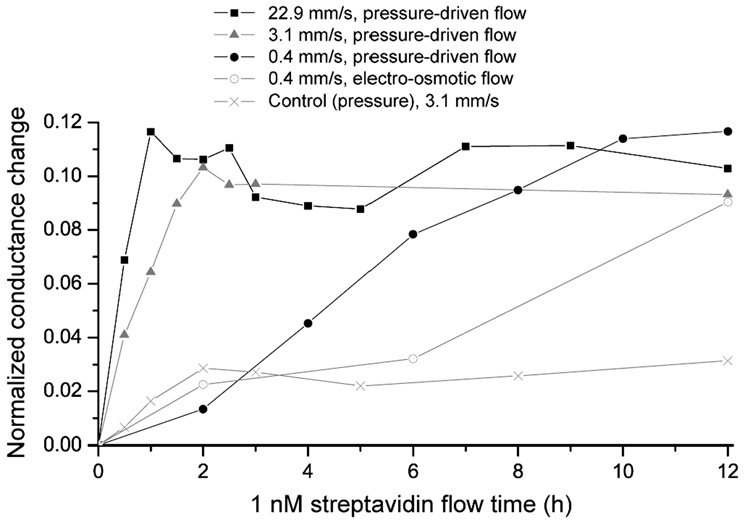
We have measured reductions in the response time of the nanochannel biosensor in Figure 5 for different flow types and velocities, shown as the normalized conductance change of a 1 nM streptavidin solution as a function of time. For a flow velocity of ~0.4 mm/s, maximal normalized conductance changes are only obtained after ~12 h, and this time is reduced to ~2 h by imposing v ≈ 3.1 mm/s. Further increasing this velocity to ~22.9 mm/s reduces the response time to ~1 h. These flow velocities have been generated with the syringe pump PHD 2000 Infuse/Withdraw (Harvard Apparatus, Holliston, MA), and the magnitude has been verified with particle image velocimetry measurements in situ, near the nanochannel. The flow velocity was measured to increase with experimentation time, which is speculated to be due to pressure build-up in the used Tygon® tubing (Cole-Parmer, Vernon Hills, IL), reaching reported values after some tens of minutes. The highest generated flow velocity of ~22.9 mm/s is limited by the maximal force of the syringe pump, but velocities up to vl ≈ 3.9 m/s could theoretically be used as estimated above by equating time scales of imposed axial flow and radial diffusional transport. Electro-osmotic flow, as a mean to induce flow through the nanochannel, has only been investigated up to ~0.4 mm/s under an electric field of 160 V/cm (ref 23), because significantly higher applied voltages would have led to bubble generation on the electrodes in the microchannels. The control measurement was done with a 1 nM streptavidin solution, a flow velocity of 3.1mm/s, and PLL-g-PEG coated channels, which does not lead to streptavidin binding but reduces nonspecific protein adsorption almost completely.
Figure 5.
Decrease of the response time of 1 nM streptavidin from ~12 h to ~1 h by increasing the flow velocity through the nanochannel, presented by the normalized conductance change versus streptavidin flow time. The control measurement was made with a 1 nM streptavidin solution and a protein-resistant channel coating under pressure-driven flow. The connecting lines are for guidance only.
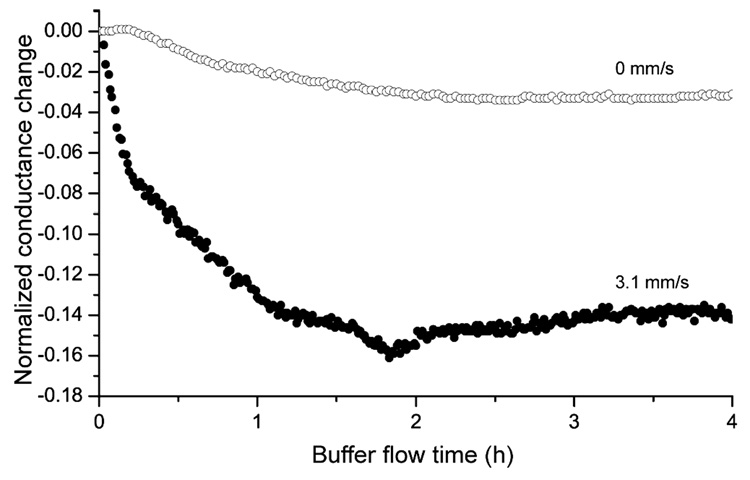
The calculated response time for 0.4 mm/s is 11.5 h (eq 2), which approximately corresponds to the measured 12 h. However, theoretical response times for 3.1 mm/s and 22.9 mm/s are 1.5 h and 0.2 h, respectively, shorter than the measured values of ~2 h and ~1 h. To understand these differences, a reference experiment was performed in which nanochannels were coated with PLL-g-PEGbiotin and incubated in a 10 µM streptavidin solution for 1 h. Subsequently, the nanochannels were flushed with buffer solution only at a flow velocity of ~3.1 mm/s (and zero flow velocity for control) as shown in Figure 6. It has been observed that the normalized conductance change decreased to ~14% after ~2 h, reaching equilibrium. This conductance decrease is associated with a reduced number of streptavidin molecules in the nanochannels, because high forces could lead to a dissection of the streptavidin-biotin bond24, 25 despite of its dissociation constant of 4 × 10⁻¹⁴ M (ref 26). Force-induced breaking of streptavidin-biotin binding has been measured on the pN level. Based on the hydrodynamic drag force given by Stoke’s law, bond-breaking is possible in our experiment, because the shear force acting on the target molecule is in the pN range at this flow velocity and size of the streptavidin molecule (approximately 5 nm in diameter). Since PLL-g-PEG has also been investigated as a lubrication layer up to velocities of some m/s (ref 27), a detachment of the entire polymer from the surface is less likely.
Figure 6.
Normalized conductance change as a function of buffer flow time at a velocity of ~3.1 mm/s (and 0 mm/s as control measurement). Before the experiment the nanochannels were coated with PLL-g-PEGbiotin and incubated in 10 µM streptavidin solution for 1 h. Applying high buffer flow velocities lead to a signal decrease and equilibrium after ~2 h, showing that the majority of the streptavidin-biotin interactions do not withstand high shear forces.
The results of Figure 5 and 6 suggest that there exists an optimum flow velocity, one that reduces the response time but which is not too high to induce bond cleavage. This flow velocity can be calculated by Stoke’s law as described above for a force below rupture of the receptor-ligand interaction. However, Figure 6 emphasizes that target molecules can also be detected if bond association and dissociation occurs at high flow velocity, although at a reduced conductance signal, which allows a further decrease in the response time of immunoassays at low target concentrations. We believe that the saturation of the normalized conductance change after ~2 h (Figure 6) is due to analyte replenishment as described in more detail below. Another potential advantage of high flow velocities could be reduced weak (and therefore possibly non-specific) binding, expected to break at high shear forces in nanochannels.
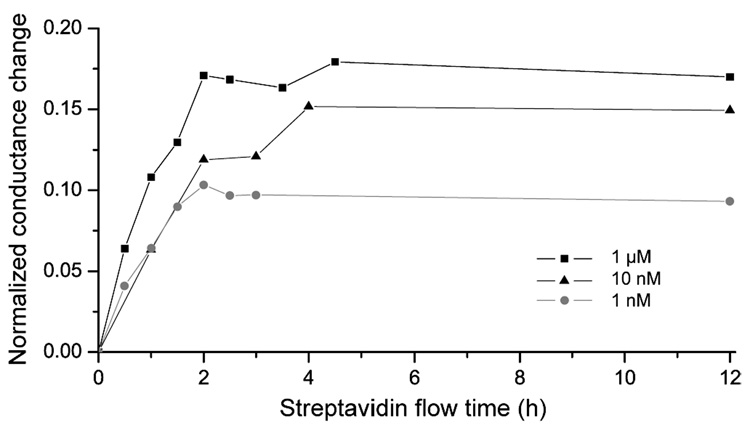
In standard incubation experiments (diffusion-limited binding), the same saturation signal is obtained for all analyte concentrations, but after different times. Fundamentally different reaction kinetics result in nanochannels with an induced flow as shown in Figure 7, where the streptavidin flow time as a function of the normalized conductance change is presented for different streptavidin concentrations at a flow velocity of ~3.1 mm/s. In nanofluidic channels the saturation signal changes with the analyte concentration, and saturations are observed after ~2 h for all streptavidin concentrations. We believe that the saturation signal represents an equilibrium between streptavidin-biotin bond association and dissociation,28 and hypothesize that the change in the saturation value is due to analyte replenishment which decreases with dilution. This determines the detection limit of this nanochannel-flow biosensor, because only analyte concentrations above the repeatability error can be measured. Since streptavidin-biotin bond breakage only leads to a constant conductance change after ~2 h at v ≈ 3.1 mm/s (Figure 6), this process does limit the response time, leading to about equal times to reach saturation for different analyte concentrations.
Figure 7.
Reaction kinetics in nanochannels with an induced flow, measured by the normalized conductance change versus analyte flow time for different streptavidin concentrations. The flow velocity of ~3.1 mm/s was equal for all measurements. Dissimilar to standard incubation experiments, in nanochannels the saturation signal changes with the analyte concentration and is reached after equal times of ~2 h. The connecting lines are for guidance only.
In conclusion, we have demonstrated that fast reaction kinetics can be achieved in nanochannels with a convective flow through them, because there is no limiting diffusion layer as in standard incubation experiments. Low analyte concentrations have been detected electrically with impedance spectroscopy and channel surfaces were coated with an end-functionalized protein-resistant monolayer, appealing for widespread applications of this biosensor. It has been observed that high shear forces due to the applied flow result in dissection of the streptavidin-biotin bond, determining the response time and the detection limit. Normalized conductance changes between 11–24% were measured, and we feel confident that these values can be increased with receptor-bearing beads binding to ligand-coated nanochannel surfaces, if the ratio of bead-diameter to nanochannel height is big. Upon immobilization of beads to the walls, the geometrical cross-section of the nanochannel will decrease, which can be electrically measured at high ionic strength. It has to be considered that bigger beads induce a higher shear force to the receptor-ligand bond at a given flow velocity, and an optimum between bead-size, detection limit, flow velocity, and response time has to be determined. We believe that such optimizations of this impedance biosensor will allow the detection of antigen-antibody bindings in nanofluidic channels.
Acknowledgements
We thank Pan Mao, Hongchul Jang, and MIT Microsystems Technology Laboratories for support during the fabrication process, and we appreciate the help of Pan Mao for performing scanning electron microscopy images of the channels. We acknowledge financial support from DuPont-MIT Alliance and NIH (EB005743).
REFERENCES
- 1.Nair PR, Alam MA. Appl. Phys. Lett. 2006;88:233120.1. [Google Scholar]
- 2.Karnik R, Castelio K, Fan R, Yang P, Majumdar A. Nano Lett. 2005;5:1638. doi: 10.1021/nl050966e. [DOI] [PubMed] [Google Scholar]
- 3.Marie R, Beech JP, Voros J, Tegenfeldt JO, Hook F. Langmuir. 2006;22:10103. doi: 10.1021/la060198m. [DOI] [PubMed] [Google Scholar]
- 4.Daniels, Jonathan S, Pourmand N. Electroanal. 2007;19:1239. doi: 10.1002/elan.200603855. [DOI] [PMC free article] [PubMed] [Google Scholar]
- 5.Mao P, Han J. Lab Chip. 2005;5:837. doi: 10.1039/b502809d. [DOI] [PubMed] [Google Scholar]
- 6.Schoch RB, van Lintel H, Renaud P. Phys. Fluids. 2005;17:100604.1. [Google Scholar]
- 7.Yi M, Jeong K-H, Lee LP. Biosens. Bioelectron. 2005;20:1320. doi: 10.1016/j.bios.2004.05.003. [DOI] [PubMed] [Google Scholar]
- 8.Im H, Huang X-J, Gu B, Choi Y-K. Nature Nanotech. 2007;2:430. doi: 10.1038/nnano.2007.180. [DOI] [PubMed] [Google Scholar]
- 9.Huang NP, Voros J, De Paul SM, Textor M, Spencer ND. Langmuir. 2002;18:220. [Google Scholar]
- 10.Pasche S, De Paul SM, Voros J, Spencer ND, Textor M. Langmuir. 2003;19:9216. [Google Scholar]
- 11.Kenausis GL, Voros J, Elbert DL, Huang NP, Hofer R, Ruiz-Taylor L, Textor M, Hubbell JA, Spencer ND. J. Phys. Chem. 2000;104:3298. [Google Scholar]
- 12.Lide DR. CRC Handbook of Chemistry and Physics. 87th ed. Boca Raton, FL: Taylor and Francis; 2007. [Google Scholar]
- 13.Pasche S, Textor M, Meagher L, Spencer ND, Griesser HJ. Langmuir. 2005;21:6508. doi: 10.1021/la050386x. [DOI] [PubMed] [Google Scholar]
- 14.Drobek T, Spencer ND, Heuberger M. Macromolecules. 2005;38:5254. [Google Scholar]
- 15.Pasche S, Voros J, Griesser HJ, Spencer ND, Textor M. J. Phys. Chem. B. 2005;109:17545. doi: 10.1021/jp050431+. [DOI] [PubMed] [Google Scholar]
- 16.Tang CS, Schmutz P, Petronis S, Textor M, Keller B, Voros J. Biotechnol. Bioeng. 2005;91:285. doi: 10.1002/bit.20395. [DOI] [PubMed] [Google Scholar]
- 17.Hendrickson WA, Pahler A, Smith JL, Satow Y, Merritt EA, Phizackerley RP. Proc. Natl. Acad. Sci. U. S. A. 1989;86:2190. doi: 10.1073/pnas.86.7.2190. [DOI] [PMC free article] [PubMed] [Google Scholar]
- 18.Sivasankar S, Subramaniam S, Leckband D. PNAS. 1998;95:12961. doi: 10.1073/pnas.95.22.12961. [DOI] [PMC free article] [PubMed] [Google Scholar]
- 19.Schoch RB, Renaud P. Appl. Phys. Lett. 2005;86:253111.1. [Google Scholar]
- 20.Jung LS, Nelson KE, Stayton PS, Campbell CT. Langmuir. 2000;16:9421. [Google Scholar]
- 21.Karnik R, Castelino K, Duan C, Majumdar A. Nano Lett. 2006;6:1735. doi: 10.1021/nl061159y. [DOI] [PubMed] [Google Scholar]
- 22.Fu J, Yoo J, Han J. Phys. Rev. Lett. 2006;97:018103. doi: 10.1103/PhysRevLett.97.018103. [DOI] [PMC free article] [PubMed] [Google Scholar]
- 23.Fu J, Schoch RB, Stevens AL, Tannenbaum SR, Han J. Nature Nanotech. 2007;2:121. doi: 10.1038/nnano.2006.206. [DOI] [PMC free article] [PubMed] [Google Scholar]
- 24.Pierres A, Touchard D, Benoliel AM, Bongrand P. Biophys. J. 2002;82:3214. doi: 10.1016/S0006-3495(02)75664-6. [DOI] [PMC free article] [PubMed] [Google Scholar]
- 25.Pincet F, Husson J. Biophys. J. 2005;89:4374. doi: 10.1529/biophysj.105.067769. [DOI] [PMC free article] [PubMed] [Google Scholar]
- 26.Green NM. Methods Enzymol. 1990;184:51. doi: 10.1016/0076-6879(90)84259-j. [DOI] [PubMed] [Google Scholar]
- 27.Muller M, Lee S, Spikes HA, Spencer ND. Tribology Letters. 2003;15:395. [Google Scholar]
- 28.Leboeuf D, Henry N. Langmuir. 2006;22:127. doi: 10.1021/la0518501. [DOI] [PubMed] [Google Scholar]


