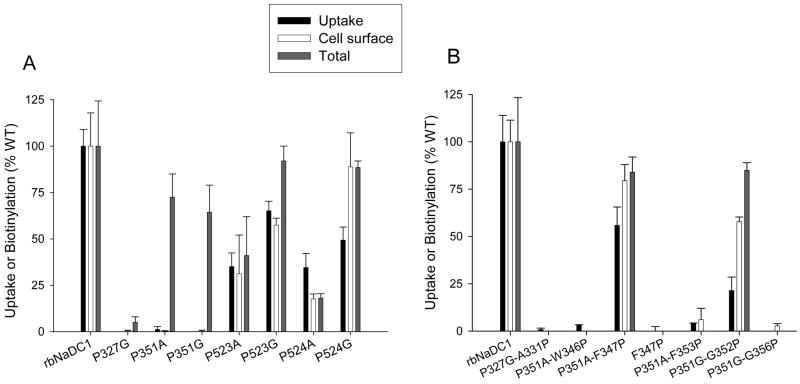
Figure 3.
Activity and expression of single (A) and double (B) mutants of rbNaDC1. The activity, cell surface and total protein expression of the mutants are shown as a percentage of wild-type rbNaDC1 (WT) as control. Transport activity of 100 μM 3H-succinate was measured with 30 minutes incubation in sodium containing buffer. Transport results for the mutants are means ± range or SEM (n = 2 or 3). Protein expression was determined by quantitating the intensities of NaDC1 protein bands from Western blots (such as Figure 2) using Image 1D analysis software. Bars represent mean ± range or SEM (n = 2 to 4 blots). Error bars on the wild-type groups represent the variation between experiments expressed as a percentage of the mean from each panel, n=11 (activity, Panel A) or 18 (activity, B), n=4–6 (blots, A and B). Background uptakes in vector-transfected cells were: (A) 0.8 ± 0.06 and (B) 1.4 ± 0.07 pmol/min-well. Background-corrected rates in wildtype NaDC1 were: (A) 3.2 ± 0.3 or (B) 7.7 ± 1.0 pmol/min-well.

