

Abstract
Background
Dietary monounsaturated fat (MUFA) and complex carbohydrates have different effects on triglyceride-rich lipoprotein (TRL) metabolism.
Objective
We hypothesized that apolipoprotein (apo) E and apo C-III might be involved in these dietary effects because of their crucial role in TRL metabolism.
Design
Twelve adults consumed, for 3 wk each, 2 isocaloric diets: first a carbohydrate-rich diet (48% complex carbohydrate, 8% MUFAs) and then a MUFA-rich diet (31% complex carbohydrate, 24% MUFAs) 12 mo later. The dietary composition of other macronutrients in the 2 diets was similar. Body weight was kept constant. Postprandial apo B kinetic studies using stable-isotope tracers were performed after each dietary intervention. Multiple VLDL, intermediate-density lipoprotein (IDL), and LDL fractions were prepared on the basis of apo E and apo C-III contents.
Results
The MUFA diet increased by ≈4−6-fold, the secretion of VLDLs and IDLs containing both apo E and apo C-III (E+CIII+)(P < 0.05). These are TRLs that mostly cleared from the circulation and are minor precursors of LDL. The MUFA diet also decreased by 60% (P < 0.05) the secretion of the TRLs without apo E or apo C-III (major precursors of LDL in plasma) and decreased their flux to LDLs. Total LDL flux did not change because the MUFA diet increased the flux to LDL from E−CIII+ TRLs, a process that requires the removal of apo C-III. In addition, the MUFA diet significantly increased the TRL fractional catabolic rate by 50% and doubled the percentage of TRLs that were cleared rather than being converted to LDLs.
Conclusion
MUFA intake activates synthetic and rapid catabolic pathways for TRL metabolism that involve apo E and apo C-III and suppresses the metabolism of more slowly metabolized VLDLs and IDLs, which do not contain these apolipoproteins.
INTRODUCTION
Dietary guidelines recommend reductions in dietary saturated fat intake to prevent or treat cardiovascular diseases (1, 2). Either carbohydrate or monounsaturated fat (MUFA) may be replacements for saturated fat and could lower LDL cholesterol by nearly the same amount (3). Carbohydrate intake generally increases plasma triglycerides and VLDL apolipoprotein (apo) B when it replaces fat in the diet, saturated or unsaturated (3). The mechanisms for the differences in effects of carbohydrate and fat on apo B lipoproteins are incompletely understood. Some kinetic studies have shown that carbohydrates can stimulate the liver production of triglyceride (4-6) and triglyceride-rich lipoprotein (TRL) apo B (7-9), whereas other studies did not find these effects on triglyceride (9, 10) or TRL apo B (6, 10, 11). Some studies found that carbohydrate, replacing fat, reduced the fractional catabolic rate (FCR) of VLDL apo B (6, 7, 11, 12), whereas others did not (8-10, 13).
The metabolism of TRL depends a great deal on the content of apolipoproteins E and C-III. Apo E, found in a portion of VLDLs and intermediate-density lipoproteins (IDLs) (14, 15), assists in the clearance of apo B lipoproteins by binding to cell surface receptors (16, 17) and proteoglycans (18). Overexpression of apo E in apo C-III transgenic mice corrects apo C-III–induced hypertriglyceridemia (19). On the other hand, apo C-III, present in the majority of VLDLs and IDLs (14, 15, 20), retards the clearance of VLDLs by interfering with the binding of apo B-100 (21) or apo E to hepatic receptors (22, 23) and causes hypertriglyceridemia in animal models (19). Previously, using immunoaffinity chromatography techniques to separate apo B lipoproteins according to their apo E and apo C-III content, we discovered that apo B lipoproteins with different apo E and apo C-III compositions have distinctive metabolic patterns in vivo in humans (24). Our results suggest that possession of apo E is key to channeling TRLs toward direct removal from the circulation instead of proceeding by lipolysis to LDL formation.
The main purpose of the present study was to determine the mechanisms by which replacing dietary complex carbohydrate with MUFAs affects apo B lipoprotein kinetics. We hypothesized that major metabolic effects are likely to be mediated through apo E and apo C-III because of their crucial roles in regulating apo B lipoprotein metabolism.
SUBJECTS AND METHODS
Subjects
Twelve participants (n = 7 men and 5 women) were recruited into the study. The subjects had a mean (± SD) age of 53 ± 10 y, body mass index (in kg/m2)of28 ± 5, fasting triglyceride concentration of 140 ± 87 mg/dL, LDL-cholesterol concentration of 128 ± 23 mg/dL, and HDL-cholesterol concentration of 51 ± 26 mg/dL. Exclusion criteria included secondary hyperlipidemia; APO E2/E2, E4/E4, and E2/E4 genotypes; and the use of medications that affect lipid metabolism. The study was approved by the Human Subjects Committees at Harvard School of Public Health and Brigham and Women's Hospital. All participants gave informed consent.
Dietary protocol
The subjects were provided a whole-food based diet rich in complex carbohydrate (CHO diet) for 3 wk. About 12 mo later, they were provided a diet rich in MUFAs (MUFA diet) for 3 wk. Macronutrient composition of the 2 diets is listed in Table 1. Contributions to total energy intake from protein, saturated fat, polyunsaturated fat and simple carbohydrate are the same between the 2 diets. The CHO diet included foods such as cereal products, vegetables, legumes, and nuts to provide energy from complex carbohydrates. On the other hand, the MUFA diet menu substituted complex carbohydrate with olive oil and fewer of these carbohydrate-rich foods to provide energy intake from MUFAs. The diets were formulated by the metabolic kitchen of the General Clinical Research Center at Brigham and Women's Hospital (Boston, MA). The ESHA nutrient database was used to design the diet, and the nutrient composition was validated by chemical determination (Covance, Madison, WI). Compared with the CHO diet, The MUFA diet had fewer calories from complex carbohydrate (31%) than did the CHO diet (48%); the MUFA content was increased from 8% to 24% in the MUFA diet.
Table 1.
Nutrient composition of the study diets
| MUFA diet1 | CHO diet2 | |
|---|---|---|
| Fat (%) | 37 | 20 |
| Saturated fat | 8 | 7 |
| Monounsaturated fat | 24 | 8 |
| Polyunsaturated fat | 5 | 5 |
| Carbohydrate (%)3 | 48 | 65 |
| Complex carbohydrate | 31 | 48 |
| Simple carbohydrate | 17 | 17 |
| Protein (%) | 15 | 15 |
| Cholesterol (mg) | 250 | 250 |
| Fiber (g) | 20 | 20 |
Diet high in monounsaturated fat.
Diet high in complex carbohydrate.
Complex carbohydrate refers to polysaccharides (starch), such as those in cereal products, vegetables, legumes, and nuts. Simple carbohydrate refers to monosaccharides or disaccharides, such as those in fruit, beverages, and desserts.
Every weekday, the complete diets for the next 24 h or for the weekend were provided to the participants as outpatients, and they were required to eat one meal each weekday on-site, either lunch or dinner. Adherence to the diets was confirmed by daily interview. The subjects were asked not to consume alcoholic beverages or any other source of calories. Dietary energy levels were adjusted to reports of hunger or satiety and to trends in body weight that were measured every other day. Body weight stayed constant during the study period.
Tracer infusion
Tracer kinetic studies were performed immediately after 3 wk of the controlled diets. The participants received a priming dose of 4.2 μmol/kg [D3]L-Leucine (Tracer Technologies, Cambridge, MA), followed by a constant infusion of [D3]L-leucine at 4.8 μmol·kg−1·/h−1 for 14 h. A bolus injection of 1.2 mg/kg [D5] L-phenylalanine leucine was also administered at the same time. We used 2 tracer techniques, mainly to reduce measurement errors. Our modeling results from this study, and previous ones (24) showed that both tracers, when modeled independently, gave similar parameter estimates. However, the combination of data from both tracers in the same model substantially lowered the CVs of the parameter estimates. Blood samples were collected every 30 min in the first 2 h after the infusion and hourly thereafter for a total of 14 h. To sustain a steady postprandial state, small hourly meals were consumed during the infusion protocol. The MUFA and CHO diets were divided into 12 portions to obtain the hourly intake level. Hourly food intake started 3 h before the tracer was administered. This type of protocol of frequent small meals has been used successfully by us and others (25, 26).
Sequential immunoaffinity chromatography
Plasma samples were first incubated with an anti-apo E immunoaffinity column made from an affinity purified polyclonal antibody against human apo E (Academy-Biomedical, Houston, TX). The unbound fraction (E−) and the bound fraction (E+) were then incubated with anti-apo C-III columns. This sequential immunoaffinity column procedure separated plasma into 4 immuno-fractions: those with both apo E and apo C-III (E+CIII+), those with apo E but not apo C-III (E+CIII−), those with apo C-III but not apo E (E−CIII+), and those without apo E or apo C-III (E−CIII−). Column efficiency is ≥98% for both apo E and apo C-III. Validation studies were performed to evaluate the effects of freezing and storage of plasma, and they were found not to affect the subsequent immunoaffinity columns (15, 24).
Ultracentrifugation
The 4 immuno-fractions were then centrifuged at 25 000 rpm on a Ti 25 rotor in an L8−70 M instrument (Beckman, Brea, CA) to isolate light VLDLs [Svedberg units of flotation (Sf)60∼400], dense VLDLs (Sf:20∼60), IDLs (1.006∼1.025 g/mL), light LDLs (1.025∼1.032), and dense LDLs (1.032∼1.050) by a modification of the Lindgren method (27). A density of 1.050 g/mL was selected as the cutoff for LDL to avoid contamination by Lp(a), which is concentrated at densities between ≈1.050 and ≈1.080 g/mL (28).
Determination of lipids and apolipoproteins
Triglyceride and cholesterol concentrations were determined enzymatically with an Infinity kit (Thermo Electron, Melbourne, Australia). Concentrations of apo E, apo C-III, and apo B were determined by using sandwich enzyme-linked immunosorbent assay (ELISA) affinity-purified antibodies (Academy-Biomedical). Intraassay CVs for lipid and apolipoprotein measurements were <5%, and interassay CVs were <10% (15, 24).
Measurement of apo B tracer enrichment and pool size
Apo B was precipitated from the lipoproteins with isopropanol, a norleucine internal standard was added, and the mixture was converted to volatile heptafluorobutyric acid derivatives as previously described (24, 29). Under the dietary conditions of the study, there is a negligible contribution of apo B-48 to the precipitated apo B in the VLDL (<5%) and LDL (<1%) fractions. Tracer enrichment was measured on a 6890 gas chromatograph/5973 mass spectrometer (Hewlett-Packard, Palo Alto, CA) using negative chemical ionization and selective ion monitoring. Apo B mass was measured by comparing the ratio between the area under the leucine curve and the area under the norleucine curve with a standard curve of various leucine/norleucine ratios (30, 31). Plasma total apo B concentrations were measured by ELISA and applied equally among the individual lipoprotein fractions to correct their apo B masses for loss. In all subjects, plasma apo B concentrations stayed constant during the infusion protocol, with <10% variation. Plasma volume (L) was assumed to be 4.4% of body weight (kg).
Model development and kinetic analysis
A multicompartment model was constructed to find the best fit to the observed data by using SAAM II software (SAAM Institute, Seattle WA). A diagram of the final model is shown in Figure 1. In this model, a plasma amino acid forcing function was followed by an intracellular delay compartment, and the time required for the synthesis and secretion of apo B was accounted for.
FIGURE 1.

Structure of the multicompartmental model. Plasma apo B lipoproteins were separated into 18 compartments (oval shapes) by sequential anti-apo E and anti-apo C-III immunoaffinity chromatography and then by ultracentrifugation. Plasma tracer forcing function supplies a delay compartment responsible for the production and secretion of apo B. Each plasma apo B compartment represents a physically isolated lipoprotein fraction. See Subjects and Methods for details of model development and validation.
Plasma apo B lipoproteins were represented by 18 compartments separated in density by ultracentrifugation and in apolipoprotein content by immunoaffinity chromatography. Concentrations of light and dense LDLs with apo E but not apo C-III were generally below detection limits, and these subfractions were not studied.
We allowed direct secretion into each plasma compartment as well as direct clearance from the circulation. Metabolism of plasma apo B lipoproteins includes conversion of larger particles to smaller ones. Modeling results suggested that for apo B lipoproteins with the same apo E and apo C-III composition, stepwise delipidation fit best to the data (eg, E+CIII+ VLDL → E+CIII+ IDL → E+CIII+ light LDL). In addition, we also tested conversion pathways among lipoproteins with different apo E and apo C-III compositions and found that some were required to best fit the data. For example, conversion from E−CIII+ light VLDLs to E−CIII− dense VLDLs represents such a pathway and indicates that, during lipolysis, some E−CIII+ light VLDLs lose all of their apo C-III content and are converted to dense VLDLs without apo C-III. When evaluating these potential conversion pathways between apo B lipoproteins with different apo E and apo C-III compositions, we first compared the enrichment curves of the originating and destination compartments to eliminate pathways that prohibit a precursor-product relation (Figure 2). Next, qualified pathways were added to the existing model one by one and were fitted to the data. Pathways for which rate constants were zero or negligible were eliminated. Average particle size and triglyceride content were also taken into consideration when evaluating such a pathway.
FIGURE 2.

Mean (± SEM) tracer/tracee ratios of [D3]leucine in VLDL and IDL (A) and in LDL (B) subfractions in response to the diet high in complex carbohydrate (CHO diet) and in response to the diet high in monounsaturated fat (MUFA diet) in 12 subjects. E+CIII+ (●) indicates apo B lipoproteins with both apo E and apo C-III; E-CIII+ (▲) indicates apo B lipoproteins with apo C-III but no apo E; E+CIII− (■) indicates apo B lipoproteins with apo E but no apo C-III; and E−CIII− (◆) indicates apo B lipoproteins with no apo E or apo C-III. Light VLDL (Svedberg units of flotation: 60∼400), dense VLDL (Sf:20∼60), IDL (1.006∼1.025 g/mL), light LDL (1.025∼1.032 g/mL), dense LDL (1.032∼1.050 g/mL).
After the model structure was established by the mean tracer and tracee data of all subjects, each participant's data were fitted individually to obtain the parameter values. For each individual, both [D5] L-phenylalanine and [D3]L-leucine tracer data were included in the same model, and the data were solved simultaneously by making the rate constants equal for leucine and phenylalanine experiments. Thus, for each participant a single set of rate constants was produced. This model was able to generate excellent fits to tracer and tracee data for both tracers. Fitting of apo B mass data were also excellent (not shown). The CVs for most parameter estimates were <25%, and for the major pathways usually <15%.
Statistical analysis
Data were analyzed by using SAS (version 9.1; SAS Institute, Cary, NC), and the results are presented as means ± SDs unless specified otherwise. A paired t test was used for within-person, between-diet comparisons. A P value ≤0.05 is considered statistically significant. All P values given were 2 sided.
RESULTS
MUFA diet selectively increases VLDL- and IDL-containing apo E and apo C-III
Apo B plasma pool sizes separated according to lipoprotein density and apolipoprotein composition are shown in Figure 3. Concentrations of light VLDLs, dense VLDLs, IDLs, and light LDLs containing both apo E and apo C-III (E+CIII+) were 60−75% higher with the MUFA diet than with the CHO diet (P < 0.05 for all). On the other hand, concentrations of VLDLs and IDLs without apo E or apo C-III (E−CIII−), especially dense VLDLs, were lower with the MUFA diet than with the CHO diet. Concentrations of light VLDLs containing apo C-III but not apo E(E−CIII+) were lower with the MUFA diet than with the CHO diet (P < 0.05). Finally, the vast majority of LDL particles did not contain either apo E or apo C-III (E−CIII−), and their pool sizes were similar for the 2 diets. Total plasma apo B masses were also similar between the MUFA and CHO diets during the study period (x̄ ± SD: MUFA diet, 2347 ± 167; CHO diet, 2171 ± 268 mg; P = 0.50).
FIGURE 3.

Mean (± SD) apo B lipoprotein pool sizes in response to the diet high in monounsaturated fat (MUFA diet) and in response to the diet high in complex carbohydrate (CHO diet) in 12 subjects. *Significantly different from the CHO diet, P < 0.05 (paired t test).
MUFA diet selectively increases secretion into plasma of VLDLs and IDLs containing apo E and apo C-III
Direct secretion rates of apo B lipoproteins into plasma are shown in Figure 4. Although total apo B secretion rates were similar with the 2 diets (CHO diet: 9.8 ± 1.0 mg·d−1·kg−1; MUFA diet: 10.9 ± 0.4 mg·d−1·kg−1; NS), the MUFA diet increased >4-fold the secretion rates of light and dense VLDLs with both apo E and apo C-III: light VLDLs (0.27 ± 0.05 and 1.50 ± 0.13 mg·d−1·kg−1 with the CHO and MUFA diets, respectively) and dense VLDLs (0.37 ± 0.06 and 1.44 ± 0.22 mg·d−1·kg−1 with the CHO and MUFA diets, respectively; P < 0.05 for both). Thus, the percentage of VLDL secreted with apo E and apo C-III increased from 12 ± 3% to 43 ± 6% when MUFA replaced carbohydrate (P < 0.05). On the other hand, the secretion rate of light and dense VLDLs without apo E or apo C-III was lower (P < 0.05) with the MUFA diet (18 ± 3% of total VLDL secretion) than with the CHO diet (44 ± 8% of total VLDL secretion). The secretion of VLDL containing apo C-III but not apo E was not affected by dietary changes (CHO diet: 42 ± 10%; MUFA diet: 37 ± 11%; NS). The MUFA diet affected the secretion of IDL in a manner similar to the way it affected VLDL, with a significantly higher secretion of IDL E+CIII+ and a lower secretion of IDL E−CIII− (Figure 4). In contrast, there were no significant dietary effects on LDL secretion rates. Finally, the model-predicted intracellular assembly time before secretion for apo B lipoproteins was also similar between the 2 diets (MUFA diet: 22 ± 10 min; CHO diet: 17 ± 6 min; NS).
FIGURE 4.

Mean (± SD) direct secretion rates into plasma (n = 12) of light VLDL, dense VLDL, IDL, and LDL apo B lipoproteins according to their apo C-III and apo E content in response to the diet high in complex carbohydrate (CHO diet) and in response to the diet high in monounsaturated fat (MUFA diet) in 12 subjects. Secretion of E+CIII− represented <1% of total apo B lipoproteins with both diets and thus was not included. *Significantly different from the CHO diet, P < 0.05 (paired t test).
MUFA diet increases VLDL fractional catabolic rates
The MUFA diet increased the FCR of light VLDL types with apo E or apo C-III, ie, E+CIII−, E-CIII+ and E+CIII+ (Figure 5). The MUFA diet also increased the FCR of dense VLDL E+CIII−. Furthermore, the MUFA diet increased the FCR of total VLDLs (all 8 VLDL types combined into a single pool): 6.0 ± 1.1 and 4.0 ± 0.6 pools/d with the MUFA and CHO diets, respectively (P < 0.05). In addition, similar to our previous findings (24), apo C-III containing lipoproteins, including both E−CIII+ and E+CIII+, generally had a higher FCR than did lipoproteins without apo E or apo C-III. This was true for both types of diets and was observed in light VLDL, IDL, and LDL fractions.
FIGURE 5.

Mean (± SD) fractional catabolic rate (FCR) of apo B lipoproteins according to apo E and apo C-III contents in response to the diet high in complex carbohydrate (CHO diet) and in response to the diet high in monounsaturated fat (MUFA diet) in 12 subjects. *Significantly different from the MUFA diet, P < 0.05 (paired t test). †Significantly different from the corresponding E−CIII− fraction within each density fraction, P < 0.05 (pairwise multiple comparison, Dunnett's test).
Apo E content determines the direction of apo B flux
Our results suggest that once apo B lipoproteins entered the circulation, their pattern of metabolism was largely determined by their apo E and apo C-III contents. This was observed with both diets. The rate constants and flux distribution of plasma apo B lipoproteins with both diets are shown in Figure 6. Flux distribution data (percentages in parentheses in Figure 6) showed that VLDLs and IDLs without apo E or apo C-III were almost exclusively converted to LDLs through lipolysis in a stepwise manner. Less than 2% of E−CIII− VLDLs and IDLs were removed from the circulation. Similarly, few apo B lipoproteins with apo C-III but not apo E underwent direct removal, and the vast majority of E−CIII+ VLDLs were converted to LDLs either with or without apo C-III. With both diets, >50% of E−CIII+ VLDLs lost their apo C-III content during lipolysis and were converted to E−CIII− IDLs and LDLs. In contrast, VLDLs and IDLs containing apo E had a distinctively different pattern that favored direct clearance. For example, 92% and 83% of light VLDLs containing apo E but not apo C-III were removed from circulation with the MUFA and CHO diets, respectively, and thus were more than half of light VLDL E+CIII+ (MUFA diet: 55%; CHO diet: 64%). During lipolysis, small amounts of E+CIII+ VLDLs lost their apo E or apo C-III content, or both, and were converted to E+CIII− or E-CIII+ LDL. However, compared with direct clearance, these were relatively minor pathways for E+CIII+ VLDL.
FIGURE 6.
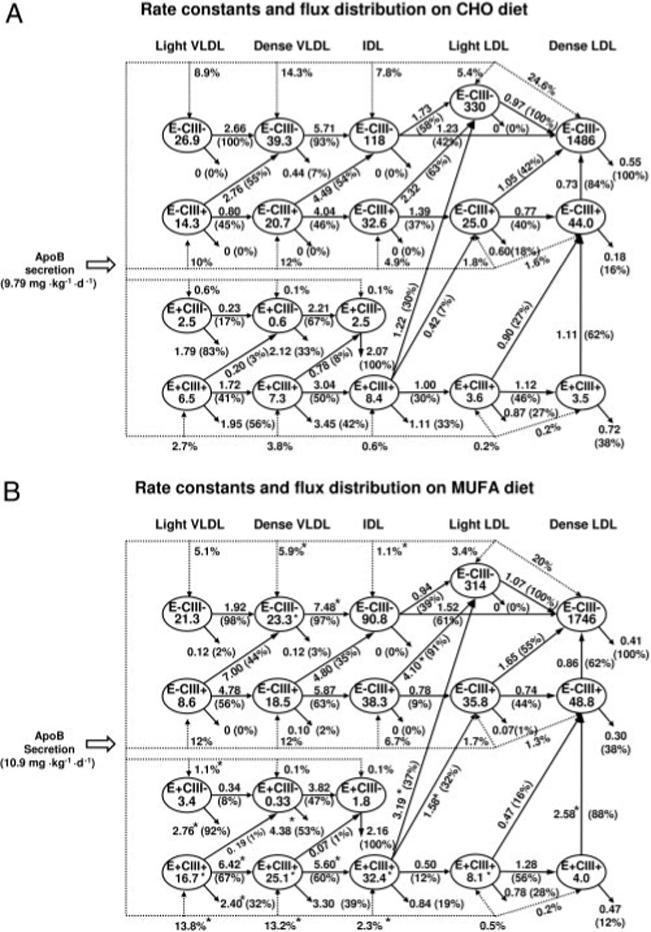
Average rate constants and flux distribution of apo B lipoproteins in response to the diet high in complex carbohydrate (CHO diet; A) and in response to the diet high in monounsaturated fat (MUFA diet; B) in 12 subjects. Ovals represent apo B lipoprotein fractions separated by apo C-III and apo E contents and by density; the numbers inside the ovals indicate the plasma pool sizes (mg). The dotted lines represent the direct secretion into plasma of each lipoprotein type, and the numbers next to the dotted lines indicate the percentages of total apo B secretion into each fraction. The solid arrows connecting the 2 plasma lipoprotein compartments represent the lipolytic conversion from the originating compartment to the receiving compartment. Arrows exiting a compartment without going into another compartment represent direct removal pathways. Numbers next to these conversion or removal pathways indicate the average rate constant (pools/d) of each pathway, and percentages inside parentheses indicate the mean relative proportion of apo B flux rates out of each originating compartment (n = 12). *Significant difference between the CHO and the MUFA diets, P < 0.05 (paired t test).
MUFA diet shifts flux of TRL apo B from conversion to LDL to direct clearance
The MUFA diet increased the direct clearance of total light VLDL to 19% (0.60 ± 0.13 mg·d−1·kg−1) from 9.2% (0.20 ± 0.06 mg·d−1·kg−1) during the CHO diet (P < 0.05). This was also true for dense VLDLs (MUFA diet: 17.2%; CHO diet: 8.4%; P < 0.05) and for IDLs (MUFA diet: 5.7%; CHO diet: 3.1%; P = 0.07). Thus, the percentage of VLDL and IDL flux undergoing direct clearance during the MUFA diet was more than twice that during the CHO diet. The percentage changes in flux rates when carbohydrate was replaced with MUFAs are summarized in Figure 7. Secretion of apo B into E+CIII+ VLDLs and IDLs increased with the MUFA diet, resulting in increased direct clearance. On the other hand, the secretion of E−CIII− VLDLs and IDLs decreased with the MUFA diet, resulting in decreased conversion of E−CIII− TRL to E−CIII− LDL.
FIGURE 7.

Mean percentage changes in apo B lipoprotein flux rates and pool sizes in response to the diet high in complex carbohydrate (CHO diet) and in response to the diet high in monounsaturated fat (MUFA diet) in 12 subjects. The dotted arrows indicate pathways with lower values in response to the MUFA diet, and the solid arrows indicate pathways with higher values in response to the MUFA diet. *Significant difference between the CHO and the MUFA diets, P < 0.05 (paired t test).
MUFA diet affects LDL production through VLDL and IDL lipolysis
Plasma LDLs come from 2 sources: direct secretion of LDLs and lipolysis of circulating plasma VLDLs and IDLs. The contributions to LDL production from both pathways are shown in Figure 8. Lipolysis of VLDLs and IDLs contributed to the production of about two-thirds of E−CIII− LDLs with both diets (Figure 8; upper left panel), whereas the contribution from direct secretion to E−CIII− LDL production made up the rest. Although total LDL production rates were similar with the 2 diets, contributions from each lipolysis pathway were different. For example, ≈17% of E−CIII− LDLs were products of lipolysis from VLDLs and IDLs of the same type (E−CIII−) with the MUFA diet compared with 36% with the CHO diet (P < 0.05). On the other hand, lipolysis of E−CIII+ VLDLs and IDLs contributed 41% of production of E−CIII− LDL with the MUFA diet compared with 27% with the CHO diet (P < 0.05). Finally, lipolysis of E+CIII+ VLDLs and IDLs contributed 8.5% of E−CIII− LDLs with the MUFA diet compared with 1% with the CHO diet (P < 0.05). Lipolytic conversion also contributed to the production of the majority of E−CIII+ LDL (Figure 8; upper right panel). Because of the significantly increased secretion of E+CIII+ VLDLs and IDLs, lipolytic conversion from E+CIII+ TRL to E−CIII+ LDL was significantly higher with the MUFA diet than with the CHO diet. There was also a similar trend for the production of E+CIII+ LDLs from E+CIII+ TRL (P = 0.10) (Figure 8; bottom left panel).
FIGURE 8.

Mean (± SD) production rates of E−CIII−, E-CIII+, and E+CIII+ apo B LDLs from direct secretion (direct SR) and various lipolytic conversion pathways from triglyceride-rich lipoproteins (TRLs, including light VLDL, dense VLDL, and IDL) in response to the diet high in complex carbohydrate (CHO diet) and in response to the diet high in monounsaturated fat (MUFA diet) in 12 subjects. *Significantly different from the CHO diet, P < 0.05 (paired t test).
MUFA diet lowers apo C-III and apo E content per particle in VLDL and IDL
Concentrations of apo E and apo C-III associated with VLDL particles were significantly higher with the MUFA diet: VLDL apo E (CHO diet: 0.87 ± 0.4 mg/dL; MUFA diet: 1.69 ± 0.5 mg/dL), VLDL apo C-III (CHO diet: 3.32 ± 1.4 mg/dL; MUFA diet: 5.63 ± 2.3 mg/dL; both P < 0.05). On the other hand, apo E and apo C-III in HDLs were significantly lower with the MUFA diet (data not shown), so that plasma total apo E and apo CIII contents were not affected. Increased apo E and apo CIII concentrations in VLDLs with the MUFA diet reflected increased apo B concentrations of VLDLs and IDLs that contain apo E, apo C-III, or both (Figure 3) and were not a result of increased apo E and apo C-III content per particle. In fact, the number of apo E and apo C-III molecules per particle (apo B) in VLDLs and IDLs decreased with the MUFA diet (Figure 9). On the other hand, concentrations of apo E and apo C-III associated with LDL were similar between the 2 diets (data not shown). Concentrations of VLDL triglyceride, cholesterol, and apo B were also similar between the 2 diets, as were the molar ratios of triglyceride and cholesterol per apo B.
FIGURE 9.

Mean (± SD) molar ratios of apo E and apo C-III per VLDL and IDL in response to the diet high in complex carbohydrate (CHO diet) and in response to the diet high in monounsaturated fat (MUFA diet) in 12 subjects. *Significantly different from the CHO diet, P < 0.05 (paired t test).
Plasma lipids and apolipoproteins
Fasting plasma lipid and apolipoprotein concentrations measured at the end of each dietary intervention were generally similar between the 2 diets: total apo B (CHO diet: 85 ± 18 mg/dL; MUFA diet: 80 ± 19 mg/dL), total triglyceride (CHO diet: 144 ± 27; MUFA diet:140 ± 39 mg/dL), total cholesterol (CHO diet: 148 ± 21; MUFA diet:168 ± 24 mg/dL), HDL cholesterol (CHO diet: 55 ± 19; MUFA diet: 60 ± 15 mg/dL), total apo E (MUFA diet: 7.1 ± 2.0; MUFA diet: 6.9 ± 2.2 mg/dL), and apo C-III (CHO diet: 16.2 ± 5.0; MUFA diet:14.7 ± 6.2 mg/dL) (all NS).
DISCUSSION
In this study we examined the metabolic effects of replacing 17% of total daily energy intake from complex carbohydrate with MUFAs. Both diets are low in saturated fat, high in fiber, and utilize mainly low glycemic foods and should be considered healthy versions of both diet types. In this context, replacing complex carbohydrate with MUFA significantly changed key aspects of apo B lipoprotein metabolism that involve apo E and apo C-III. MUFAs selectively stimulate the secretion of TRLs containing apo E and suppress the secretion of those without apo E or apo C-III. As a result, MUFAs shorten the overall residence time in circulation of VLDL particles and doubles the direct clearance of TRLs from the circulation. The production and clearance rates of LDL are not significantly altered.
The results of the present study lend further support to our previous observations that apo E and apo C-III are crucial regulators of apo B lipoprotein metabolism (24). Our previous study was conducted in the fasting state after 3 wk of the same MUFA-rich diet used in the present study, which was conducted in the postprandial state. We showed that apo E is key to direct clearance. The majority of apo B lipoproteins containing apo E undergo direct removal and have a low tendency for LDL formation. On the other hand, apo C-III antagonizes this function of apo E, diverting particles to lipolysis and LDL formation instead. Particles with both apo C-III and apo E experience have a lower clearance than do particles with apo E but not apo C-III; particles with apo C-III but not apo E have minimal direct clearance and are metabolized quickly to LDLs. In addition, TRLs without apo E or apo C-III exhibit slow lipolysis and almost no clearance and are metabolized into LDLs. The present study confirms these findings for both a high-carbohydrate diet and a high-MUFA diet and extends them to the postprandial state and further shows that dietary intervention acts within the same fundamental structure of apo B lipoprotein metabolism dominated by apo E and apo C-III.
Data from this study suggest that controlling apo E and apo C-III composition of VLDL during secretion may be a means of regulating plasma apo B lipoprotein metabolism. The results of both our previous study and the present study suggest that the liver and perhaps the small intestine are capable of secreting VLDL with various apo E and apo C-III compositions (24). Because of the crucial functions of apo E and apo C-III in regulating plasma apo B lipoprotein metabolism, variations in the secretion pattern also significantly affect the flux of TRLs in circulation, as expected. Our results suggest that substituting dietary complex carbohydrate with MUFAs changes the secretion pattern of apo B lipoproteins. MUFA intake dramatically increased the secretion of TRLs with both apo E and apo C-III and halved the secretion of TRLs without apo E or apo C-III, leading to increased TRL clearance.
The underlying intracellular mechanisms responsible for these changes are unknown. The size and lipid composition of TRLs do not seem to be affected by the exchange of carbohydrate for MUFAs. The increase in VLDL apo E and apo C-III concentrations was mainly due to increased numbers of apo E or apo C-III containing VLDLs and was not due to an increase in the apo E or apo C-III content per particle. In fact, apo E and apo C-III contents decreased in some TRLs. Therefore, it appears that apo E and apo C-III are distributed to more apo B lipoproteins during the secretion process when an MUFA-rich diet is consumed.
These changes in TRL metabolism involving apo E and apo C-III may have direct consequences in vascular biology in addition to their effects on lipoprotein metabolism. Our recent work showed that apo C-III found in VLDLs or LDLs can increase monocyte adhesion to human endothelial cells in a vascular cell adhesion molecule-1– dependent manner (32, 33). Apo C-III also activates nuclear transcription factor κB, protein kinase C, proinflammatory transcription factors, and signaling molecules in both monocytes and endothelial cells (34). Thus, the accumulation of light VLDLs containing apo C-III but not apo E during a high-carbohydrate diet may increase the risk of proinflammatory mechanisms and atherogenesis. On the other hand, it is unclear whether an increase in VLDLs with both apo C-III and apo E during an MUFA diet confers any additional risk of cardiovascular disease, because this type of VLDL has a high tendency for direct clearance and short residence time in circulation.
The effects of carbohydrate feeding were examined in some earlier kinetic studies. Nestel et al (12) first studied the effects of sucrose feeding (55% of total energy intake) in healthy subjects and found reduced VLDL apo B FCRs and no changes in VLDL apo B secretion rates. Similar results were observed by Melish et al (6) and Ginsberg et al (11), who studied the replacement of a high-fat liquid formula with a high-carbohydrate (80% of energy) dextrin formula. On the other hand, Stacpoole et al (8) reported that high glucose feeding (90% of total energy intake) did not change the FCR of VLDL apo B (8); total apo B secretion rates were also not affected, but there was a shift in the secretion pattern from small VLDL to large VLDL particles. Several groups also studied the effects of carbohydrate feeding using diets based on whole foods (7, 9, 10, 13), and most of these studies found no significant changes in VLDL apo B secretion rates or FCRs (9, 10, 13). However, Huff and Nestle (7) observed a significant increase in plasma VLDL concentrations with a high-carbohydrate diet, because of both a decreased clearance and increased production of VLDLs. Because of major differences in the composition of the diets, study duration, and tracer labeling techniques among these studies, some inconsistencies in results were not unexpected. Our finding that substituting dietary MUFA with carbohydrate does not significantly alter total apo B or VLDL apo B secretion rates but decreases overall VLDL apo B FCRs agrees with most, but not all, previous kinetics studies.
The fact that both diets in the present study provided recommended levels of saturated fat, protein, cholesterol, fiber, fruit, vegetables, and minerals has important implications in the interpretation of the results. We did not test our hypothesis against an unhealthy high-saturated-fat control diet; thus, our findings strictly pertain to 2 alternative healthy dietary patterns: one rich in carbohydrate (65% of total energy) and poor in fat (20% of total energy) and the other rich in MUFAs (20% of energy). It is unknown whether the observed changes to apo B lipoprotein kinetics are specific to MUFAs. It has been reported that dietary fat saturation could affect LDL apo B kinetics in humans (13, 35) and in guinea pigs (36, 37). It remains to be investigated whether replacing dietary carbohydrate with polyunsaturated fat or saturated fat could affect apo E− and apo C-III− dominated apo B lipoprotein metabolism in a manner similar to that of MUFAs.
In addition, this study used an isocaloric feeding protocol, and dietary energy levels were adjusted to reports of hunger or satiety and to trends in body weight. As a result, body weights were held constant throughout the study. Therefore, our study compared the direct effects of macronutrient substitution on apo B metabolism without the confounding effects of weight loss.
One limitation of this study was that, for logistical reasons, we did not use a randomized crossover study design. The carbohydrate diet was consumed by the participants 12 mo, on average, before the MUFA diet. We thus cannot rule out the possibility of a bias due to issue order effects. Because of the relative short duration between dietary protocols, we do not expect age to be a confounder of our results. In fact, we measured body weight as well as blood lipid and lipoprotein concentrations before the start of each dietary protocol and found them to be similar. It also remains to be investigated whether our conclusions regarding the crucial functions of apo E and apo C-III in regulating apo B-100 metabolism also apply to apo B-48 lipoproteins.
In summary, this study showed that replacing dietary complex carbohydrate with MUFAs activates synthetic and rapid catabolic pathways for TRL metabolism that are mediated through apo E and apo C-III and suppresses the secretion of more slowly metabolized types of VLDLs and IDLs that do not contain these apolipoproteins. The critical involvement of apo E and apo C-III may aid in understanding the mechanisms responsible for the well-known effects of MUFAs and complex carbohydrates on plasma lipids and lipoproteins.
Acknowledgments
We are grateful to the volunteers who participated in the study and to Tae Kim, Janis Swain, Helen Judge Ellis, and the nurses of the General Clinical Research Center at Brigham and Women's Hospital (Boston, MA).
The authors' responsibilities were as follows—CZ: conducted the kinetic modeling of the data, performed the statistical analysis, and wrote the manuscript; CK: recruited the patients and conducted the dietary protocol and biochemical analyses; JF: oversaw the biochemical analyses; KI: contributed to the kinetic modeling; and FMS: designed the study, supervised the tracer kinetic experiments and data analysis, and critically revised the manuscript. All authors contributed to the review of the manuscript. None of the authors had a personal or financial conflict of interest.
Footnotes
Supported by grants R01-HL-34980, R01-HL-56210, and RR02635 from the National Heart, Lung and Blood Institute, National Institutes of Health, Bethesda, MD.
REFERENCES
- 1.Lichtenstein AH, Appel LJ, Brands M, et al. Diet and lifestyle recommendations revision 2006: a scientific statement from the American Heart Association Nutrition Committee. Circulation. 2006;114:82–96. doi: 10.1161/CIRCULATIONAHA.106.176158. [DOI] [PubMed] [Google Scholar]
- 2.Institute of Medicine . Dietary reference intakes for energy, carbohydrate, fiber, fat, fatty acids, cholesterol, protein, and amino acids. National Academy Press; Washington, DC: 2002. [DOI] [PubMed] [Google Scholar]
- 3.Mensink RP, Zock PL, Kester AD, Katan MB. Effects of dietary fatty acids and carbohydrates on the ratio of serum total to HDL cholesterol and on serum lipids and apolipoproteins: a meta-analysis of 60 controlled trials. Am J Clin Nutr. 2003;77:1146–55. doi: 10.1093/ajcn/77.5.1146. [DOI] [PubMed] [Google Scholar]
- 4.Quarfordt SH, Frank A, Shames DM, Berman M, Steinberg D. Very low density lipoprotein triglyceride transport in type IV hyperlipoproteinemia and the effects of carbohydrate-rich diets. J Clin Invest. 1970;49:2281–97. doi: 10.1172/JCI106448. [DOI] [PMC free article] [PubMed] [Google Scholar]
- 5.Reaven GM, Hill DB, Gross RC, Farquhar JW. Kinetics of triglyceride turnover of very low density lipoproteins of human plasma. J Clin Invest. 1965;44:1826–33. doi: 10.1172/JCI105290. [DOI] [PMC free article] [PubMed] [Google Scholar]
- 6.Melish J, Le NA, Ginsberg H, Steinberg D, Brown WV. Dissociation of apoprotein B and triglyceride production in very-low-density lipoproteins. Am J Physiol. 1980;239:E354–62. doi: 10.1152/ajpendo.1980.239.5.E354. [DOI] [PubMed] [Google Scholar]
- 7.Huff MW, Nestel PJ. Metabolism of apolipoproteins CII, CIII1, CIII2 and VLDL-B in human subjects consuming high carbohydrate diets. Metabolism. 1982;31:493–8. doi: 10.1016/0026-0495(82)90240-2. [DOI] [PubMed] [Google Scholar]
- 8.Stacpoole PW, von Bergmann K, Kilgore LL, Zech LA, Fisher WR. Nutritional regulation of cholesterol synthesis and apolipoprotein B kinetics: studies in patients with familial hypercholesterolemia and normal subjects treated with a high carbohydrate, low fat diet. J Lipid Res. 1991;32:1837–48. [PubMed] [Google Scholar]
- 9.Parks EJ, Krauss RM, Christiansen MP, Neese RA, Hellerstein MK. Effects of a low-fat, high-carbohydrate diet on VLDL-triglyceride assembly, production, and clearance. J Clin Invest. 1999;104:1087–96. doi: 10.1172/JCI6572. [DOI] [PMC free article] [PubMed] [Google Scholar]
- 10.Abbott WG, Swinburn B, Ruotolo G, et al. Effect of a high-carbohydrate, low-saturated-fat diet on apolipoprotein B and triglyceride metabolism in Pima Indians. J Clin Invest. 1990;86:642–50. doi: 10.1172/JCI114756. [DOI] [PMC free article] [PubMed] [Google Scholar]
- 11.Ginsberg HN, Le NA, Melish J, Steinberg D, Brown WV. Effect of a high carbohydrate diet on apoprotein-B catabolism in man. Metabolism. 1981;30:347–53. doi: 10.1016/0026-0495(81)90114-1. [DOI] [PubMed] [Google Scholar]
- 12.Nestel PJ, Reardon M, Fidge NH. Sucrose-induced changes in VLDL-and LDL-B apoprotein removal rates. Metabolism. 1979;28:531–5. doi: 10.1016/0026-0495(79)90193-8. [DOI] [PubMed] [Google Scholar]
- 13.Cortese C, Levy Y, Janus ED, et al. Modes of action of lipid-lowering diets in man: studies of apolipoprotein B kinetics in relation to fat consumption and dietary fatty acid composition. Eur J Clin Invest. 1983;13:79–85. doi: 10.1111/j.1365-2362.1983.tb00068.x. [DOI] [PubMed] [Google Scholar]
- 14.Alaupovic P. Significance of apolipoproteins for structure, function, and classification of plasma lipoproteins. Methods Enzymol. 1996;263:32–60. doi: 10.1016/s0076-6879(96)63004-3. [DOI] [PubMed] [Google Scholar]
- 15.Campos H, Perlov D, Khoo C, Sacks FM. Distinct patterns of lipoproteins with apoB defined by presence of apoE or apo C-III in hypercholesterolemia and hypertriglyceridemia. J Lipid Res. 2001;42:1239–49. [PubMed] [Google Scholar]
- 16.Kowal RC, Herz J, Weisgraber KH, Mahley RW, Brown MS, Goldstein JL. Opposing effects of apolipoproteins E and C on lipoprotein binding to low density lipoprotein receptor-related protein. J Biol Chem. 1990;265:10771–9. [PubMed] [Google Scholar]
- 17.Mahley RW, Rall SC., Jr Apolipoprotein E. far more than a lipid transport protein. Annu Rev Genomics Hum Genet. 2000;1:507–37. doi: 10.1146/annurev.genom.1.1.507. [DOI] [PubMed] [Google Scholar]
- 18.Ji ZS, Fazio S, Lee YL, Mahley RW. Secretion-capture role for apolipoprotein E in remnant lipoprotein metabolism involving cell surface heparan sulfate proteoglycans. J Biol Chem. 1994;269:2764–72. [PubMed] [Google Scholar]
- 19.de Silva HV, Lauer SJ, Wang J, et al. Overexpression of human apolipoprotein C-III in transgenic mice results in an accumulation of apolipoprotein B48 remnants that is corrected by excess apolipoprotein E. J Biol Chem. 1994;269:2324–35. [PubMed] [Google Scholar]
- 20.Khoo C, Campos H, Judge H, Sacks FM. Effects of estrogenic oral contraceptives on the lipoprotein B particle system defined by apolipoproteins E and C-III content. J Lipid Res. 1999;40:202–12. [PubMed] [Google Scholar]
- 21.Clavey V, Lestavel-Delattre S, Copin C, Bard JM, Fruchart JC. Modulation of lipoprotein B binding to the LDL receptor by exogenous lipids and apolipoproteins CI, CII, CIII, and E. Arterioscler Thromb Vasc Biol. 1995;15:963–71. doi: 10.1161/01.atv.15.7.963. [DOI] [PubMed] [Google Scholar]
- 22.Windler EE, Kovanen PT, Chao YS, Brown MS, Havel RJ, Goldstein JL. The estradiol-stimulated lipoprotein receptor of rat liver. A binding site that membrane mediates the uptake of rat lipoproteins containing apo-proteins B and E. J Biol Chem. 1980;255:10464–71. [PubMed] [Google Scholar]
- 23.Sehayek E, Eisenberg S. Mechanisms of inhibition by apolipoprotein C of apolipoprotein E-dependent cellular metabolism of human triglyceride-rich lipoproteins through the low density lipoprotein receptor pathway. J Biol Chem. 1991;266:18259–67. [PubMed] [Google Scholar]
- 24.Zheng C, Khoo C, Ikewaki K, Sacks FM. Rapid turnover of apolipoprotein C-III-containing triglyceride-rich lipoproteins contributing to the formation of LDL subfractions. J Lipid Res. 2007;48:1190–203. doi: 10.1194/jlr.P600011-JLR200. [DOI] [PubMed] [Google Scholar]
- 25.Lichtenstein AH, Hachey DL, Millar JS, et al. Measurement of human apolipoprotein B-48 and B-100 kinetics in triglyceride-rich lipoproteins using [5,5,5-2H3]leucine. J Lipid Res. 1992;33:907–14. [PubMed] [Google Scholar]
- 26.Zheng C, Ikewaki K, Walsh BW, Sacks FM. Metabolism of apoB lipoproteins of intestinal and hepatic origin during constant feeding of small amounts of fat. J Lipid Res. 2006;47:1771–9. doi: 10.1194/jlr.M500528-JLR200. [DOI] [PMC free article] [PubMed] [Google Scholar]
- 27.Lindgren FT, Jensen LC, Hatch FT. The isolation and quantitative analysis of serum lipoproteins. In: Nelson GJ, editor. Blood lipids and lipoproteins: quantitation, composition, and metabolism. Wiley-Interscience; New York, NY: 1972. pp. 181–274. [Google Scholar]
- 28.Ehnholm C, Garoff H, Simons K, Aro H. Purification and quantitation of the human plasma lipoprotein carrying the Lp(a) antigen. Biochim Biophys Acta. 1971;236:431–9. doi: 10.1016/0005-2795(71)90223-6. [DOI] [PubMed] [Google Scholar]
- 29.Tomiyasu K, Walsh BW, Ikewaki K, Judge H, Sacks FM. Differential metabolism of human VLDL according to content of ApoE and ApoCIII. Arterioscler Thromb Vasc Biol. 2001;21:1494–500. doi: 10.1161/hq0901.094489. [DOI] [PubMed] [Google Scholar]
- 30.Su W, Campos H, Judge H, Walsh BW, Sacks FM. Metabolism of Apo(a) and ApoB100 of lipoprotein(a) in women: effect of postmenopausal estrogen replacement. J Clin Endocrinol Metab. 1998;83:3267–76. doi: 10.1210/jcem.83.9.5116. [DOI] [PubMed] [Google Scholar]
- 31.Maugeais C, Ouguerram K, Frenais R, et al. Effect of low-density lipoprotein apheresis on kinetics of apolipoprotein B in heterozygous familial hypercholesterolemia. J Clin Endocrinol Metab. 2001;86:1679–86. doi: 10.1210/jcem.86.4.7428. [DOI] [PubMed] [Google Scholar]
- 32.Kawakami A, Aikawa M, Libby P, Alcaide P, Luscinskas FW, Sacks FM. Apolipoprotein CIII in apolipoprotein B lipoproteins enhances the adhesion of human monocytic cells to endothelial cells. Circulation. 2006;113:691–700. doi: 10.1161/CIRCULATIONAHA.105.591743. [DOI] [PubMed] [Google Scholar]
- 33.Kawakami A, Aikawa M, Alcaide P, Luscinskas FW, Libby P, Sacks FM. Apolipoprotein CIII induces expression of vascular cell adhesion molecule-1 in vascular endothelial cells and increases adhesion of monocytic cells. Circulation. 2006;114:681–7. doi: 10.1161/CIRCULATIONAHA.106.622514. [DOI] [PubMed] [Google Scholar]
- 34.Kawakami A, Aikawa M, Nitta N, Yoshida M, Libby P, Sacks FM. Apolipoprotein CIII-induced THP-1 cell adhesion to endothelial cells involves pertussis toxin-sensitive G protein- and protein kinase C alpha-mediated nuclear factor-kappaB activation. Arterioscler Thromb Vasc Biol. 2007;27:219–25. doi: 10.1161/01.ATV.0000249620.68705.0d. [DOI] [PubMed] [Google Scholar]
- 35.Turner JD, Le NA, Brown WV. Effect of changing dietary fat saturation on low-density lipoprotein metabolism in man. Am J Physiol. 1981;241:E57–63. doi: 10.1152/ajpendo.1981.241.1.E57. [DOI] [PubMed] [Google Scholar]
- 36.Abdel-Fattah G, Fernandez ML, McNamara DJ. Regulation of very low density lipoprotein apo B metabolism by dietary fat saturation and chain length in the guinea pig. Lipids. 1998;33:23–31. doi: 10.1007/s11745-998-0176-z. [DOI] [PubMed] [Google Scholar]
- 37.Fernandez ML, Lin EC, McNamara DJ. Regulation of guinea pig plasma low density lipoprotein kinetics by dietary fat saturation. J Lipid Res. 1992;33:97–109. [PubMed] [Google Scholar]