Abstract
Prepulse inhibition (PPI) refers to a reduction in the amplitude of the startle eye-blink reflex to a strong sensory stimulus, the pulse, when it is preceded shortly by a weak stimulus, the prepulse. PPI is a measure of sensorimotor gating which serves to prevent the interruption of early attentional processing and it is impaired in schizophrenia-spectrum patients. In healthy individuals, PPI is more robust when attending to than ignoring a prepulse. Animal and human work demonstrate frontal-striatal-thalamic (FST) circuitry modulates PPI. This study used functional magnetic resonance imaging (fMRI) to investigate FST-circuitry during an attention-to-prepulse paradigm in 26 unmedicated schizophrenia-spectrum patients (13 schizotypal personality disorder (SPD), 13 schizophrenia) and 13 healthy controls. During 3T-fMRI acquisition and separately measured psychophysiological assessment of PPI, participants heard an intermixed series of high- and low-pitched tones serving as prepulses to an acoustic-startle stimulus. Event-related BOLD-response amplitude curves in FST regions traced on co-registered anatomical MRI were examined. Controls showed greater activation during attended than ignored PPI conditions in all FST regions--dorsolateral prefrontal cortex (Brodmann areas 46,9), striatum (caudate, putamen), and the thalamic mediodorsal nucleus (MDN). In contrast, schizophrenia patients failed to show differential BOLD responses in FST-circuitry during attended and ignored prepulses, whereas SPD patients showed greater-than-normal activation during ignored prepulses. Among the three diagnostic groups, lower left caudate BOLD activation during the attended PPI condition was associated with more deficient sensorimotor gating as measured by PPI. Schizophrenia-spectrum patients exhibit inefficient utilization of FST-circuitry during attentional modulation of PPI. Schizophrenia patients have reduced recruitment of FST-circuitry during task-relevant stimuli, whereas SPD patients allocate excessive resources during task-irrelevant stimuli. Dysfunctional FST activation, particularly in the caudate may underlie PPI abnormalities in schizophrenia-spectrum patients.
Keywords: dorsolateral prefrontal cortex, caudate nucleus, putamen, thalamus, mediodorsal nucleus, fMRI, schizophrenia, schizotypal personality disorder, startle, prepulse inhibition, attention, sensorimotor gating
Introduction
Abnormalities in sensory gating or the ability to gate out irrelevant sensory information from the environment are frequently reported in patients with schizophrenia (American-Psychiatric-Association 1994, p. 280). Prepulse inhibition (PPI) is a reliable psychophysiological index of sensorimotor gating which provides a well-validated animal model for testing the potency of antipsychotics, as well as, a useful framework for examining deficits in the early stages of information processing among schizophrenia-spectrum patients (Kumari and Sharma 2002). In humans, PPI is defined as the reduction of the amplitude of the startle eye-blink reflex when a non-startling prestimulus (the prepulse) precedes a startling stimulus (the pulse) by a brief interval (30–300 ms), compared with the amplitude elicited by the startle stimulus alone, see reviews by (Blumenthal 1999; Filion et al 1998). This inhibition in the amplitude of the startle response is thought to be due to a momentary inhibitory sensorimotor gating process elicited by the prepulse that serves to protect the earliest stages of processing of the prepulse (Graham 1975). PPI is maximal when the interval between the prepulse and the pulse stimulus is approximately 120 ms (Blumenthal 1999).
Schizophrenia and schizotypal personality disorder (SPD) patients show abnormal inhibition of the startle eyeblink response during a passive, uninstructed PPI paradigm which has been interpreted as a deficit in early automatic attentional processing (Braff et al 1978, 1992; Cadenhead et al 1993, 2000; Grillon et al 1992; Kumari et al 1999; Swerdlow et al 2006). In addition to studies examining passive PPI, several studies have shown that active attentional modulation of PPI is also impaired in schizophrenia and SPD patients (Dawson et al 1993, 2000; Hazlett et al 1998, 2003, 2007, in press). In these attention-to-prepulse studies, the participants are typically instructed to attend to one type of prepulse (e.g., high-pitch tone) and simply ignore another prepulse (e.g., low-pitch tone). Active attention PPI studies have reported that healthy individuals show greater PPI at the 120 ms probe position following an attended prepulse than an ignored prepulse. In contrast, schizophrenia and SPD patients failed to show differential PPI during attended and ignored prepulses. These results are consistent with the concept that schizophrenia-spectrum patients are impaired in the allocation of controlled attentional processes to an important, task-relevant stimulus (Callaway and Naghdi 1982).
There is evidence from animal studies that PPI is modulated by cortico-striato-thalamic-pallido-pontine circuitry, for reviews see (Koch and Schnitzler 1997; Swerdlow et al 2001) and theories of the pathology of schizophrenia have implicated dysfunction in this circuitry (Bunney 1990; Carlsson and Carlsson 1990; Swerdlow and Koob 1987). Our previous [18F]-deoxyglucose positron emission tomography (PET) finding that among healthy individuals, greater PPI is significantly correlated with higher relative glucose metabolism in dorsolateral prefrontal cortex (DLPFC) regions (Hazlett and Buchsbaum 2001; Hazlett et al 1998) is consistent with animal models of the circuitry modulating PPI. In contrast, unmedicated schizophrenia patients showed this relationship in a much smaller portion of prefrontal cortex (Hazlett and Buchsbaum 2001; Hazlett et al 1998). Recent work using functional magnetic resonance imaging (fMRI) in healthy individuals found increased blood oxygen-level dependent (BOLD) response in prefrontal cortex, thalamus, mediodorsal nucleus (MDN), and striatum during PPI modulation (Hazlett et al 2001; Kumari et al 2003, 2007a) and decreased activation in schizophrenia patients (Kumari et al 2003, 2007a).
Previous fMRI work in schizophrenia examining frontal-striatal-thalamic (FST) circuitry during startle modulation, e.g., (Kumari et al 2003) is somewhat difficult to interpret given the confound of antipsychotic medication. A recent fMRI study examining schizophrenia patients on typical versus atypical neuroleptics (doctor’s choice) showed that patients taking atypical neuroleptics had better PPI and more FST activation than those taking typical neuroleptics (Kumari et al 2007a). The present study examines whether the BOLD response in FST circuitry during PPI modulation differs from normal in a sample of unmedicated schizophrenia and SPD patients. Understanding brain dysfunction underlying deficient PPI modulation in schizophrenia-spectrum patients may yield insights into disease pathophysiology and help target regions for psychopharmacological treatment. Although prior neuroimaging studies have investigated the neurobiology underlying PPI deficits in schizophrenia, this is the first to include SPD patients and examine the event-related time course of FST activation. An important aim of the present study was to examine the degree to which SPD resembles schizophrenia in terms of abnormal BOLD activation and its time course in FST regions during an active attention PPI paradigm.
Similar to schizophrenia, SPD is characterized by difficulties with social interactions and language, as well as, paranoid, odd behavior, ideas of reference and magical thinking. However, since individuals with SPD are not frankly psychotic, they have not generally required neuroleptic medication or recurrent hospitalization which avoids the confounds of medication and chronicity. Nevertheless, SPD is related to schizophrenia in terms of genetics (Kendler et al 1993; Kety et al 1967) and shared biological markers (Cadenhead et al 2000; Dickey et al 2002; Siever and Davis 2004).
Functional imaging studies of schizophrenia-spectrum patients suggest that there may be abnormalities in frontal activation in both schizophrenia and SPD but that SPD patients can recruit alternative, compensatory regions to accomplish cognitive tasks requiring frontal lobe activation (Buchsbaum et al 2002). In the thalamus, we have reported decreased relative glucose metabolism in the medial dorsal nucleus bilaterally in schizophrenia patients, but not in SPD compared with healthy controls during a serial-verbal learning task (Hazlett et al 1999). However, shape analysis showed that the SPD group had significantly fewer pixels in the region of the right MDN than did controls suggesting size reduction. During the same task, SPD patients showed increased relative glucose metabolism in the ventral putamen. This finding is consistent with decreased dopaminergic activity in the ventral putamen since dopamine is inhibitory in this region. In contrast, schizophrenia patients showed decreased relative glucose metabolism compared with healthy controls in this region (Shihabuddin et al 2001). More recently, significant size reduction and shape differences of the caudate nucleus in SPD have been reported (Levitt et al 2002, 2004). Taken together, these findings support the idea that impairment in the schizophrenia spectrum may be associated with abnormalities in FST circuitry.
The main aim of the present fMRI study was to examine the event-related time course of the BOLD response during attended and ignored prepulses in unmedicated schizophrenia-spectrum patients (SPD and schizophrenia) and healthy individuals. Based on animal models of the modulation of PPI (reviewed by Swerdlow et al 2001) and related neuroimaging work in humans (Hazlett et al 1998, 2001; Kumari et al 2003, 2007a), we hypothesized that compared with healthy controls schizophrenia patients would show less differential BOLD activation in FST regions during the attend minus ignore PPI condition. We also hypothesized that SPD patients would show less marked abnormalities than the schizophrenia patients. We expected BOLD response abnormalities in SPD might involve fewer brain areas modulating PPI and affected in schizophrenia, or that the BOLD response might be enhanced in some brain areas compared with healthy controls, possibly serving to protect the SPD patients from the most severe deficits of schizophrenia. In addition to our hypothesis-driven region of interest approach, we conducted a more conventional and exploratory whole-brain analysis. Lastly, for a subgroup of participants, we calculated correlation coefficients between FST BOLD activation during the attended PPI condition and psychophysiological measurement of PPI which was obtained in a separate session within a week of the fMRI scan. Across the three groups, we predicted that lower FST activation would be associated with poorer PPI.
Methods
Participants
Thirteen unmedicated schizophrenia patients (5 never medicated, 8 previously medicated but off all psychoactive medication for a minimum of two weeks and long-acting antipsychotics for six weeks prior to their scan), 13 SPD patients (12 never-medicated, one received antipsychotic medication on one occasion ten years prior to this study), and 13 healthy controls comprised the final sample for this study. The groups did not significantly differ in age or sex distribution (Table 1). Data from an additional eight participants (3 controls, 3 SPD and 2 schizophrenia patients) were excluded from analysis due to technical problems with their fMRI scans (e.g., poor image quality, movement artifact, could not complete the scanning procedure). Healthy controls and SPD patients were recruited from advertisements in local newspapers while schizophrenia patients were recruited through referrals from the outpatient psychiatric clinic or inpatient psychiatric unit at the Mount Sinai Hospital.
Table 1.
Means and standard deviations for demographics and clinical symptoms among the three groups
| Healthy Controls | Schizotypal PD Patients | Schizophrenia Patients | p value and test statistic | |
|---|---|---|---|---|
| Sample size: | 13 | 13 | 13 | |
| Age: | 35.9±11.7 | 40.1±9.0 | 38.5±15.9 | all p values>0.31 |
| Sex: | 8M | 9M | 10M | all p values>0.22 |
| BPRS score: | ----- | 28.2±5.5, Range=22–39 | 50.7±17.7, Range=24–82 | t(24)=4.37, p=0.0002 |
The healthy controls and SPD patients underwent diagnostic assessment with the Structured Interview for DSM-IV Personality Disorders (SIDP) (Pfohl et al 1989) and the Structured Clinical Interview for DSM-IV Axis I disorders (SCID-I) (First et al 1995). To match our ongoing schizophrenia neuroimaging studies, the schizophrenia patients were diagnosed using the Comprehensive Assessment of Symptoms and History (Andreasen et al 1992). SPD and schizophrenia patients met DSM-IV diagnostic criteria on the basis of these structured interviews. To assess clinical symptoms, the Brief Psychiatric Rating Scale (Overall and Gorham 1962) was given to all patients on scan day. As expected, the schizophrenia patients had significantly higher 18-item BPRS scores compared with the SPD patients (Table 1). Healthy volunteers with an Axis I or II psychiatric illness or an Axis I diagnosis in a first-degree relative were excluded.
All participants were medically healthy as assessed by medical history, physical examination, and standard laboratory test and were taking no medications. Individuals with a history of substance abuse in the previous six months or any history of substance dependence, neurological disorders, or head trauma were excluded. All participants had a negative urine drug screen on the day of their scan.
This study was approved by the Mount Sinai School of Medicine Institutional Review Board and all participants provided written informed consent prior to participation and were paid for their participation.
In addition to the fMRI session, 33 of the study participants (12 healthy controls, 12 SPDs, and 9 schizophrenia patients) also had psychophysiological measurement of the startle eyeblink response (PPI) during the same attention-to-prepulse paradigm during a separate session 4–7 days prior to their fMRI scan. The psychophysiological (PPI) findings indicated that compared with healthy controls, both the SPD and schizophrenia patient groups exhibit deficient attentional modulation of PPI and these methods and results are published separately (Hazlett et al 2007). However, in the present fMRI study, we report new correlational analyses between psychophysiological measurement of PPI and FST BOLD activation (area under the curve; AUC) during the attended PPI condition for this subgroup of 33 participants with both measures.
MRI scanning and overview
Participants were scanned on a head-dedicated Siemens Allegra 3T scanner. Head movement was restricted with the use of expandable foam cushions positioned lateral to the participant’s head. The fMRI acquisition occurred during an attention-to-prepulse paradigm similar to our previous fMRI study in healthy individuals conducted on a 1.5T scanner (Hazlett et al 2001). For the functional MRI scans, a gradient echoplanar imaging (GE-EPI) sequence (28 axial slices, 3mm thick, skip=1mm, TR=2s, TE=40ms, flip angle=90°, FOV=210, matrix=64×64) was used for measurement of the BOLD signal. The 28 slices were selected from the temporal lobes up toward the brain apex and obtained in the same location for six trial blocks each containing 135 2-sec image acquisitions for a total scan time of about 27 minutes.
For the anatomical acquisition, a low resolution, high speed scout image was obtained first followed by a series of axial scans. For high resolution structural images with good gray/white matter contrast, T1-weighted MP-RAGE (Magnetization Prepared Rapid Gradient Echo) imaging was used (208 slices with slice thickness=0.82mm, matrix size=256×256×208, FOV=21cm, TR=2500ms, TE=4.38ms, TI=1100ms and a 8° flip angle FLASH acquisition) for accurate anatomical tracing of our regions of interest (caudate, putamen, MDN) and had a total structural imaging time of about 10 minutes.
We used two methods to analyze the average BOLD response values: (1) Hypothesis-driven mixed-factorial design examined key PPI-salient regions of interest visible with fMRI. Our repeated-measures approach helps minimize Type I statistical error involved with conducting t-tests for each area, group contrast, and condition. Our multivariate analysis of variance (MANOVA) approach also allows for regional comparisons (e.g., DLPFC shows more activation compared with caudate) and (2) voxel-by-voxel whole-brain analysis to examine between-group BOLD response differences during the attend-ignore PPI conditions.
fMRI Procedure, Stimuli, and Task
The fMRI acquisition occurred during an attention-to-prepulse paradigm nearly identical to that described in our prior fMRI study of healthy individuals (Hazlett et al 2001) (although we increased the number of trial blocks in the present study). For fMRI, we adapted the attention-to-prepulse paradigm used in our psychophysiological studies examining modulation of startle eyeblink amplitude as a measure of attentional processing (e.g., Dawson et al 1993; Filion 1993; Hazlett et al 1998, 2007). The participants were instructed that their task throughout each of the trial blocks was to listen closely to a series of high- and low-pitch tones (presented though hybrid air-conducting headphones that delivered stimuli directly into the ear canal), count silently the number of “longer-than-usual” high-pitch tones, and simply ignore the low-pitch tones (the to-be-attended pitch was counterbalanced across participants). Participants also were told that: (1) the standard-length tone was 5 sec and the longer-than-usual tones were 8 sec in duration and (2) a brief loud noise burst would be presented occasionally throughout the tone-counting task but that it was unrelated to the task and could be ignored. To emphasize the importance of the length-judgment task, a monetary reward was offered for a correct count of the longer-than-usual tones of the designated pitch. Participants received $10.00 if their count was correct, $9.00 if their count was off by one, and so forth.
After the instructions, participants were given a warned presentation of the startle-eliciting burst of noise alone and an experimenter confirmed that the participant heard the stimulus and that it elicited a visible eye-blink. Next, one example of the high-pitch tone and one example of the low-pitch tone were presented and participants were told that each of these examples was the standard 5 sec in duration. A third tone was then presented and participants identified the pitch and confirmed that they could discriminate between the high- and low-pitch tones.
Next, all participants underwent six 4.5-min BOLD fMRI scan blocks. Each of the six trial blocks began with a period of silence lasting 30 sec to allow the spins to come to an equilibrium, the data from the first 8 sec were discarded. The scans from the following 22 sec were used as a baseline. Next, the following stimulus conditions were presented in an intermixed fashion (also a different order across blocks) for both the high (1200-Hz, 100-dB(A) Sound Pressure Level (SPL)) and the low (800-Hz 100-dB(A) SPL) prepulse tone conditions: 5-sec tone prepulse alone, 5-sec tone prepulse with a startle pulse (115 dB SPL(A) burst of white noiseburst, 50-ms duration) presented 120 ms following prepulse onset, and a 8-sec tone prepulse with startle pulse presented at 120 ms. There were also two startle pulses presented without any tone prepulse. Each of these eight trial types lasted 30 sec each with the stimulus onset (e.g., 5-sec tone alone) occurring at either 2, 4, or 6 sec following trial onset. All auditory stimuli (tone prepulses and startle pulses) were transmitted via sound-insulated and cushioned earphones that delivered stimuli directly into the ear canal. Following each block, the participant was asked via intercom how many 8-sec high (or low) tones they counted during the preceding block.
Stimuli were generated and fMRI acquisition triggered with a desktop computer with a digital sound file (Windows XP, multimedia WAVE format). This ensured accurate correspondence between image acquisition time and stimulus presentation.
We addressed the problem of inherent fMRI background noise conceptually in three ways: (1) It was minimized by using the special headphones described above, (2) Because auditory noise from the scanner is a constant pattern of high-pitched sound modulated at 4 Hz, it has no frequency component that is near any of the auditory stimulus components in the tone-discrimination task we employed, (3) Because the inherent noise is a constant factor across all three conditions for all three groups and we employed MANOVA with condition as a repeated measure for our statistical analysis, the background noise does not contribute to the hypothesized Group × Condition or Group × Condition × Time interactions.
Image Processing and Analysis
We carried out the following pre-statistics processing steps for the six trial blocks: conversion of all image data to Analyze format, motion correction using MCFLIRT (Jenkinson et al 2002); non-brain removal using Brain Extraction Tool (Smith 2002); spatial smoothing with Gaussian profile filter of full-width-half-maximum (FWHM) 5 mm; high-pass temporal filtering with Gaussian-weighted running line detrending (cutoff=70s). Next, the BOLD images were coregistered to the anatomical MRI. Registration was carried out with FSL.FLIRT in two steps. First, fMRI images were co-registered to their structural MRI with a 7 degrees-of-freedom (DOF) linear transformation. Second, the co-registered images were aligned to the MNI brain template using a 12 DOF linear fit. These images were only used for voxel-by-voxel analyses.
Preprocessing on the BOLD images used for the region-of-interest analysis involved the same steps as the voxel-by-voxel analysis described above, except that the mean-based intensity normalization and high-pass temporal filtering was different (FSL temporal filter, sigma=100.0s). For each participant, the regions-of-interest (ROIs) were traced (as described in the next section) on the anterior-posterior commissure (ACPC)-positioned MP-RAGE structural MRI which was coregistered to the BOLD images. Following the coregistration, we obtained mean BOLD response time-series values in each of the ROIs for each of the key stimulus conditions (attended prepulse + pulse, attended prepulse no pulse, ignored prepulse + pulse, ignored prepulse no pulse; all with 5-sec prepulse duration) averaged across the six trial blocks. We averaged across the six trials for each stimulus condition to closely match the number of trials obtained in a standard psychophysiological session involving PPI measurement with electromyogram recording.
Region-of-interest delineation and statistical design
Dorsolateral prefrontal cortex
We used the rigorous quantitative cytoarchitectonic work of Goldman-Rakic for defining the DLPFC as comprising BA46 and BA9 (Rajkowska and Goldman-Rakic 1995; Selemon et al 2003). BOLD activation in the gray matter pixels of this DLPFC region was obtained by tracing coronal brain edges and using our standard cortical Brodmann area analysis methods based on stereotaxic coordinates derived from post-mortem histological examination detailed elsewhere (Buchsbaum et al 2002; Hazlett et al 1998; Mitelman et al 2005).
Caudate, putamen, and mediodorsal nucleus of the thalamus
For each participant, we traced the caudate, putamen, and MDN of the thalamus on anterior commissure-posterior commissure positioned MP-RAGE structural MRI at three slice levels (ventral, middle, dorsal). We used our standard methods detailed elsewhere for tracing the caudate, putamen (Brickman et al 2003) and MDN (Kemether et al 2003). However, given that the MDN is small, BOLD response data was averaged across the three slice levels for all analyses including this region. The MDN outlines were insufficiently detailed on two of the participants’ MRI scans at one or more of the three slice levels (one healthy control and one schizophrenia patient as judged by the tracer (E.M.K.) without diagnostic information) and these subjects were eliminated from analyses including the MDN.
MANOVA design
We specifically hypothesized group differences in the differential amplitude of BOLD response during attended vs. ignored PPI conditions in dorsolateral prefrontal cortex, striatal and mediodorsal thalamus regions and thus, a focused test of regional differences was chosen to complement whole-brain mapping also reported. We initially examined group differences in the BOLD response curves using a mixed-design MANOVA with Diagnostic Group (healthy controls vs. SPD vs. schizophrenia) as a between-subjects factor and FST region (DLPFC, caudate, putamen, MDN), Condition (attended prepulse, ignored prepulse), Startle stimulus (startle presented 120 ms following prepulse onset, no startle stimulus presented during the prepulse), Hemisphere, and Time point (2 sec apart beginning 2 sec post-prepulse onset and ending 26 seconds later; total of 14 time points) as repeated-measures or within-subjects factors. For this initial analysis because there were so many repeated-measure factors, we averaged across BA46 and 9 for the DLPFC region and across the three slices which were traced for the caudate and putamen.
To better characterize regional group differences, MANOVAs were next conducted for each of the ROIs separately. For the DLPFC, we conducted a Group (Healthy controls vs. SPD vs. schizophrenia) × DLPFC region (BA46, BA9) × Condition (attended prepulse, ignored prepulse) × Startle stimulus (startle presented 120 ms following prepulse onset, no startle stimulus) × Hemisphere × Time (1–14, each 2-sec epoch from 2 sec to 28 sec) MANOVA. Similarly, for the caudate and putamen, we conducted separate Group × Condition × Startle stimulus × Slice level (ventral, middle, dorsal) × Hemisphere × Time MANOVA. Lastly, for the MDN we conducted a Group × Condition × Startle stimulus × Hemisphere × Time MANOVA.
Note that interactions not containing the factor of Time are essentially area under the curve (AUC) summary effects (BOLD response activation averaged across all time points). Analyses were performed using Statistica (StatSoft 2003) and we report the multivariate F (Wilks lambda) and univariate F with Greenhouse-Geisser (G-G) epsilon corrections to adjust probabilities for repeated-measure effects with more than two levels (for all G-G results, we report the epsilon values and uncorrected degrees of freedom).
Whole brain analysis
For the voxel-by-voxel whole brain statistical analysis of the fMRI data we used FSL (Smith et al 2004). GLM analysis was first carried out on the preprocessed fMRI data for each single subject with FSL.FILM with four contrasts set for the effects of attended PPI condition, ignored PPI condition, startle alone, and the attend minus ignore PPI condition difference, respectively. Next, single-subject statistics were fed into second-level multi-session, multi-subject analysis. The unpaired t-test group analysis was performed on the three groups with FSL.FLAME (FMRIB’s Local Analysis of Mixed Effects). We present the data with a color bar showing p<0.05 to p<0.0005 so that both a-priori hypotheses (e.g., schizophrenia-related decrease in differential BOLD response for attend minus ignore PPI condition in mediodorsal nucleus and decreases associated with significant traced regional effects) and exploratory hypotheses (survey of entire cortex) can be examined by the reader. We also report the z-score and cluster size for hypothesized regions.
Results
FST circuitry
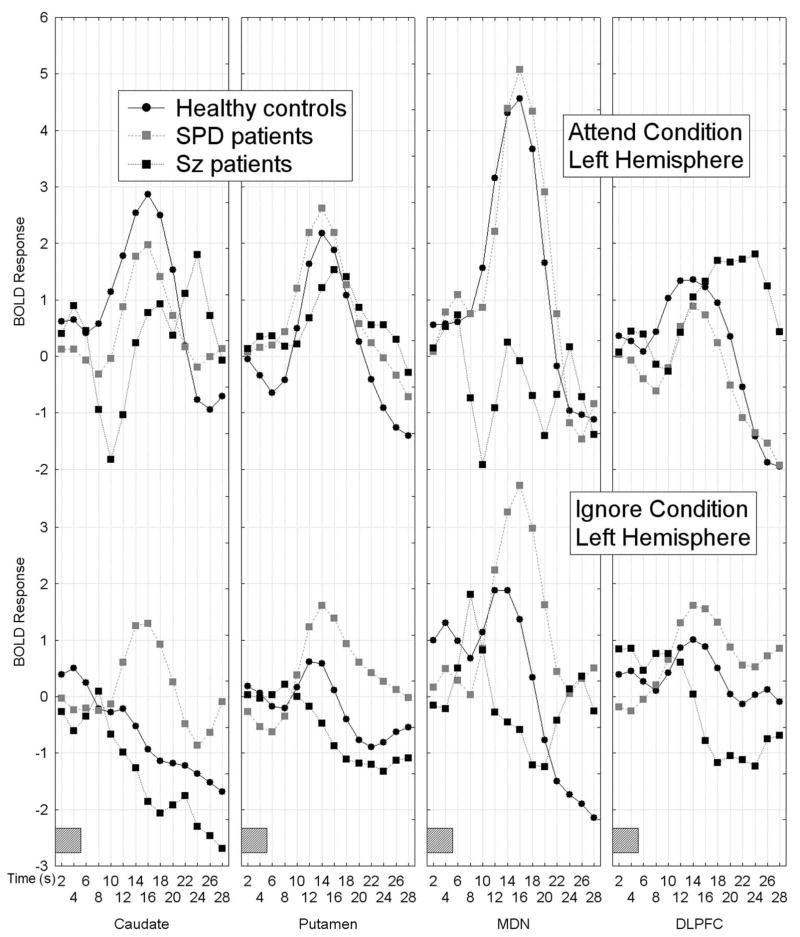
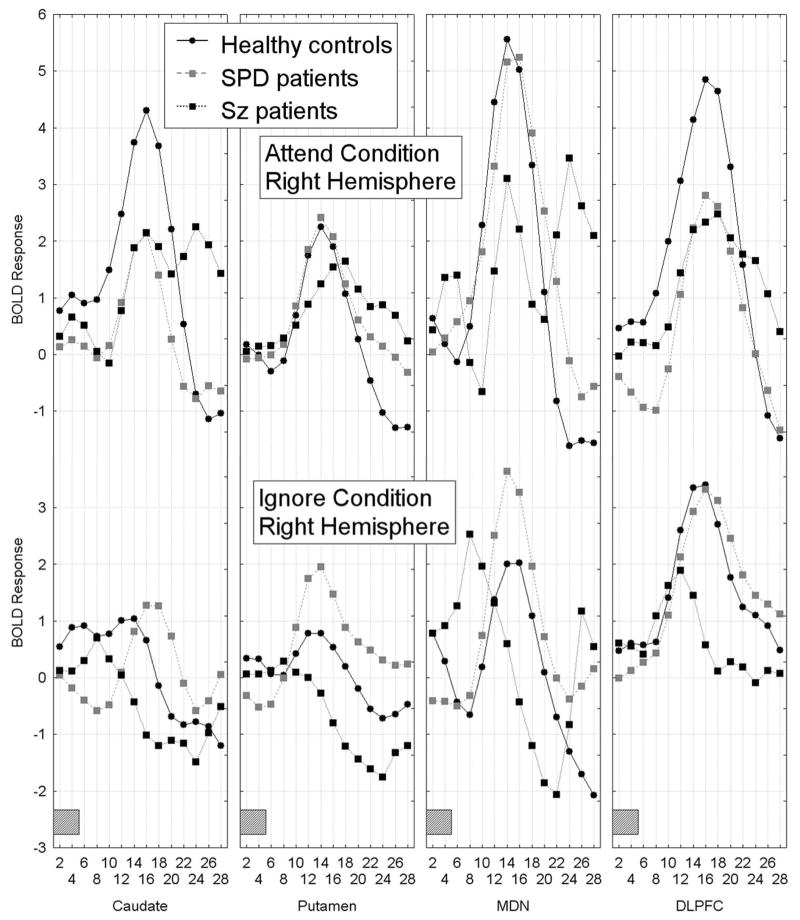
The multiple brain region analysis resulted in a complex pattern of group differences in BOLD activation which showed that the healthy controls had greater BOLD response activation curves during the attend than the ignore PPI condition in frontal-striatal-thalamic (FST) regions across hemispheres, whereas both patient groups failed to show this pattern of attentional modulation. Schizophrenia patients tended to show less differential attend-ignore BOLD activation mainly due to a lack of BOLD activation during the attend PPI condition, whereas SPD patients showed greater-than-normal BOLD response activation during the ignore PPI condition, Group × FST region × Attend/Ignore × Hemisphere × Time interaction, F[78,1326]=2.38, p=0.004, G-G ε=0.18, Figure 1).
Figure 1.
Figure 1A–1B. Mean BOLD response curves for frontal-striatal-thalamic (FST) regions including the caudate, putamen, mediodorsal nucleus of the thalamus and dorsolateral prefrontal cortex (averaged across BAs 46 and 9) are shown for the three groups as a function of condition (attend PPI, ignore PPI), hemisphere (1A shows left hemisphere, 1B shows right hemisphere) and time. Healthy controls showed larger BOLD response curves during the attend prepulse condition compared with the ignore prepulse condition in all FST regions, whereas both schizophrenia-spectrum groups failed to show this pattern. Schizophrenia patients tended to show a similar BOLD response during attend and ignore PPI conditions, whereas SPD patients tended to show greater-than-normal BOLD response curves during the ignore PPI condition, Group × FST region × Attend/Ignore × Hemisphere × Time interaction, F[78,1326]=2.38, p=0.004, G-G ε=0.18. The gray rectangle along the timeline indicates when the presentation of the 5-sec tone-prepulse occurred. The BOLD responses presented are averaged across the two startle conditions (i.e. prepulse plus startle at 120 ms and prepulse without startle).
Averaged across FST region, attend/ignore condition, startle/no startle and hemisphere, the SPD patients had the largest BOLD response curve, schizophrenia patients were smallest, and healthy controls were intermediate, Group × Time interaction, F(26,442)=2.52, p=0.020, G-G ε=0.26. We followed-up these significant interactions with simple-effects MANOVAs for each of the FST regions and these results are described below. The main effect of Group was not significant (F[2,34]=0.58, p=0.57) indicating that the AUC for the overall BOLD response (averaged across time, FST region, Attend/Ignore, Startle/No startle, and hemisphere) did not differ between the three groups and none of the other interactions with Group were significant.
It should be noted that the two interactions with Group described above remained statistically significant when we removed the one SPD patient who had previously been treated with an antipsychotic from the analysis. We also repeated the multiple-brain-region MANOVA with a between-group factor comparing previously medicated (n=8) with never-medicated (n=5) schizophrenia patients and neither the main effect of Group, nor any of the interactions with Group were significant indicating that these subgroups did not differ in their FST BOLD response patterns.
DLPFC
As described in the methods section (2.5), for the DLPFC we conducted a Group (Healthy controls vs. SPD vs. schizophrenia) × DLPFC region (BA46, BA9) × Condition (attended prepulse, ignored prepulse) × Startle stimulus (startle presented 120 ms following prepulse onset, no startle stimulus) × Hemisphere × Time (1–14, each 2-sec epoch from 2 sec to 28 sec) MANOVA. Compared with healthy controls, the schizophrenia group showed less of a differential attend-ignore PPI BOLD response in the DLPFC (collapsed across BA46 and 9) and this was most dramatic in the right hemisphere. Interestingly, in left DLPFC, the schizophrenia patients showed greater peak amplitude than the controls during the attend PPI condition but peak amplitude was delayed in time consistent with slower processing time. The SPD patients showed greater BOLD response curves during the ignore than the attend PPI condition in the DLPFC, Group × Attend/Ignore PPI condition × Hemisphere × Time interaction, F[26,468]=2.24, p=0.044, G-G ε=0.23, Figure 1A-B; four right panels labeled DLPFC.
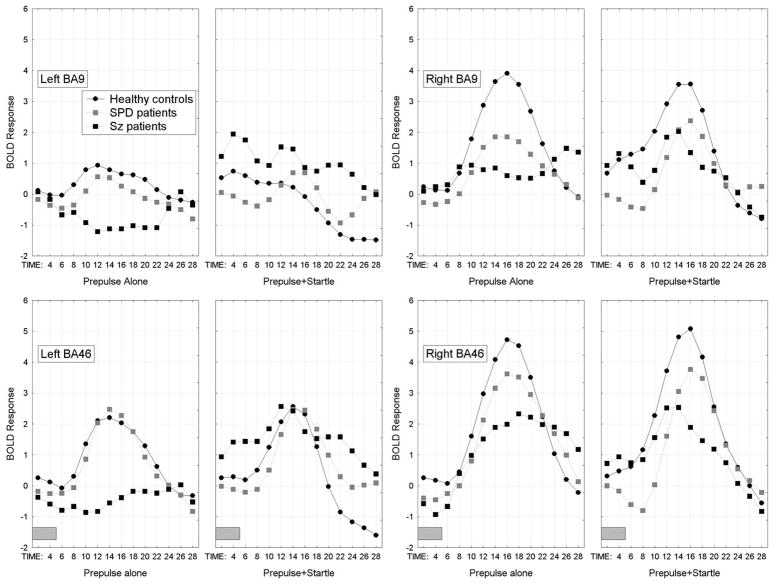
As can be seen in Figure 2, the healthy controls and SPD patients showed similar BOLD response curves whether the startle stimulus was presented during the prepulse or not, whereas the schizophrenia patients showed greater BOLD activation when the prepulse was paired with the startle stimulus (PPI condition), particularly in the left hemisphere (Group × Startle/No Startle condition × BA (BA46, BA9) × Hemisphere × Time interaction, F[26,468]=1.96, p=0.047, G-G, ε=0.35). The main effect of Group was not significant (F[2,36]=0.38, p=0.69) indicating the three groups did not differ in overall AUC for DLPFC activation. None of the other interactions with Group were significant.
Figure 2.
In the DLPFC, the schizophrenia patients showed greater BOLD activation during the prepulse+startle condition (i.e. when the startle stimulus was presented 120 ms following onset of the prepulse) than the prepulse alone condition, particularly in the left hemisphere. In contrast, the healthy controls and SPD patients showed similar BOLD response curves whether the prepulse was presented alone or with the startle stimulus, Group × Startle/No Startle condition × BA × Hemisphere × Time interaction, F[26,468]=1.96, p=0.047, H-F; ε=0.35. The gray rectangle along the timeline indicates when the presentation of the 5-sec tone-prepulse occurred.
Caudate nucleus
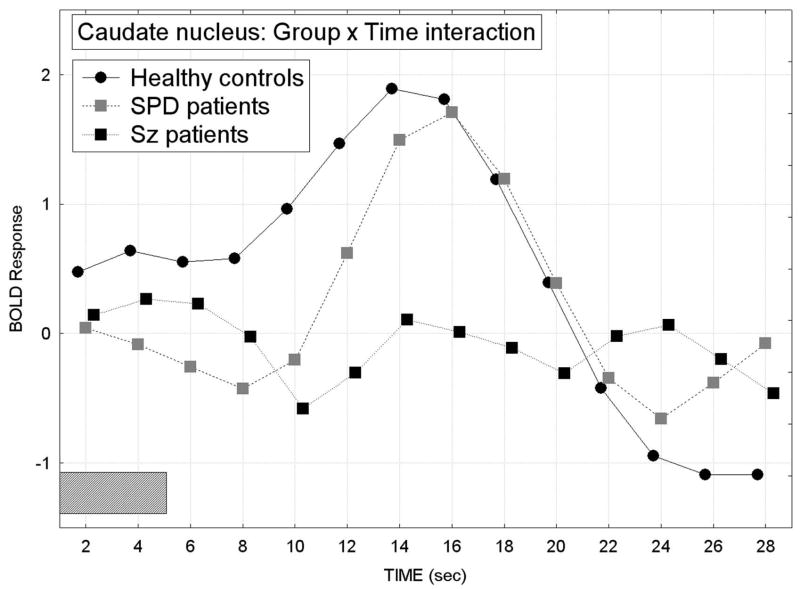
For the caudate, we conducted a Group × Condition × Startle stimulus × Slice level (ventral, middle, dorsal) × Hemisphere × Time MANOVA and the schizophrenia group showed the smallest overall BOLD response curve in comparison with the healthy control group while the SPD group was intermediate (overall group difference in the time course of the BOLD response averaged across condition, startle/no startle, slice, and hemisphere factors; Group × Time interaction, F[26,468]=2.39, p=0.024, G-G ε=0.28; Figure 3).
Figure 3.
In the caudate nucleus, the healthy controls showed the greatest peak for the BOLD response across time and averaged over attend/ignore condition, hemisphere and startle-no startle conditions. In contrast, the schizophrenia patients showed the smallest overall BOLD response and SPD patients were intermediate between the healthy controls and schizophrenia groups (Group × Time interaction, F[26,468]=2.39, p=0.024, G-G ε=0.28). The gray rectangle along the timeline indicates when the presentation of the 5-sec tone-prepulse occurred.
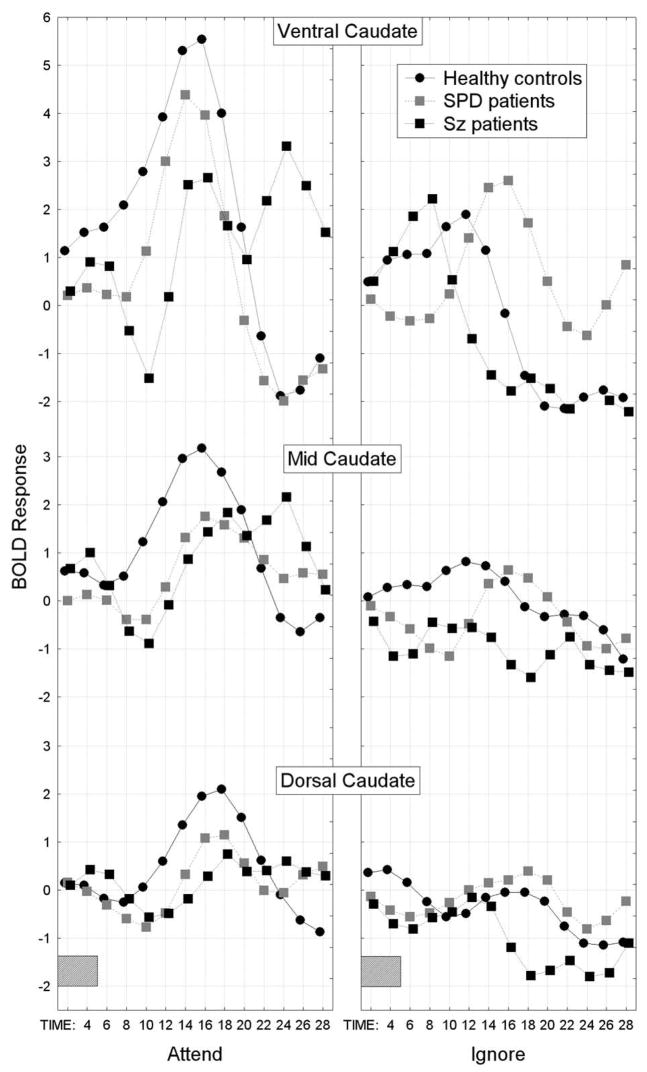
As can be seen in Figure 4, a spectrum pattern was observed for the BOLD response in the caudate during the attend PPI condition primarily at the ventral slice level (but also seen to smaller degree at dorsal level) with the schizophrenia group showing the least activation compared with healthy controls while the SPD group was intermediate (Group × Condition × Slice level × Time interaction, F[52,936]=2.63, p=0.004, G-G ε=0.20). During the ignore PPI condition, particularly at the ventral slice level, the SPD patients showed greater-than-normal activation suggesting greater processing of the to-be-ignored prepulse, while the schizophrenia patients were intermediate between the SPD and control groups. The main effect of Group was not significant (F[2,36]=0.68, p=0.51), nor were any of the other interactions with Group.
Figure 4.
In the caudate nucleus, a spectrum pattern was observed for the BOLD response during the attend PPI condition primarily at the ventral slice level with schizophrenia patients showing the least activation in comparison to healthy controls and the SPD patients were intermediate (Group × Condition (attend, ignore) × Slice level × Time interaction, F[52,936]=2.63, p=0.004, G-G ε=0.20). During the ignore PPI condition, particularly at the ventral slice level, the SPD patients showed greater-than-normal activation suggesting they failed to ignore, while the schizophrenia patients were intermediate. The gray rectangle along the timeline indicates when the presentation of the 5-sec tone-prepulse occurred.
Putamen
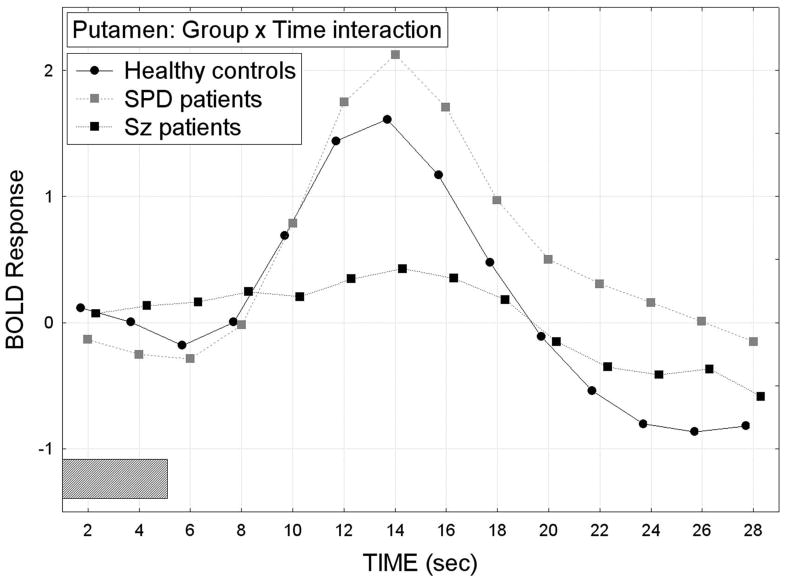
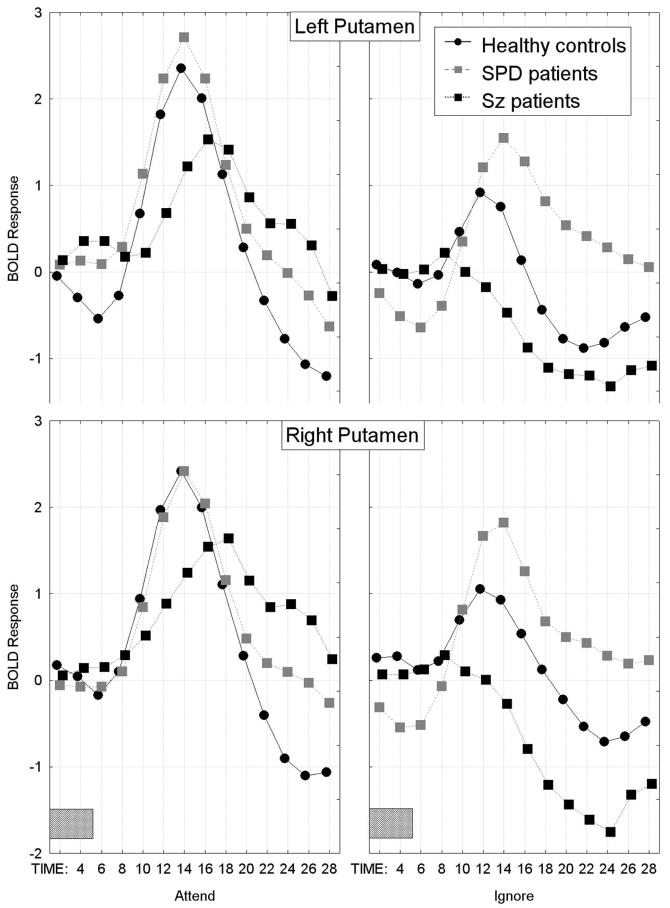
The SPD patients showed the largest overall BOLD response curve in the putamen, schizophrenia patients had the smallest and the healthy controls were intermediate (overall group difference in the time course of the BOLD response averaged across all repeated-measures factors except time; Group × Time interaction, F[26,48]=1.94, p=0.023, Wilks; Figure 5). As can be seen in Figure 6, all three groups showed a pattern of greater bilateral putamen BOLD activation during the attend than ignore PPI condition. However, compared with the healthy controls, the schizophrenia patients showed the smallest BOLD responses during both the attend and ignore PPI conditions, whereas the SPD patients showed the greatest BOLD response during the ignore PPI condition, Group × Condition × Hemisphere × Time interaction, F[26,468]=2.19, p=0.028, G-G ε=0.33. The main effect of Group was not significant (F[2,36]=0.79, p=0.46), nor were any of the other interactions with Group.
Figure 5.
In the putamen, the SPD patients showed the greatest BOLD response, schizophrenia patients showed the smallest and healthy controls were intermediate (Group × Time interaction, F[26,48]=1.94, p=0.023, Wilks). The gray rectangle along the timeline indicates when the presentation of the 5-sec tone-prepulse occurred.
Figure 6.
In the putamen, the schizophrenia patients showed less BOLD response activation during both the attend and ignore PPI conditions compared with the healthy controls. In contrast, the SPD group showed greater-than-normal BOLD activation during the ignored PPI condition, Group × Condition × Hemisphere × Time interaction, F[26,468]=2.19, p=0.028, G-G.
Mediodorsal nucleus of the thalamus
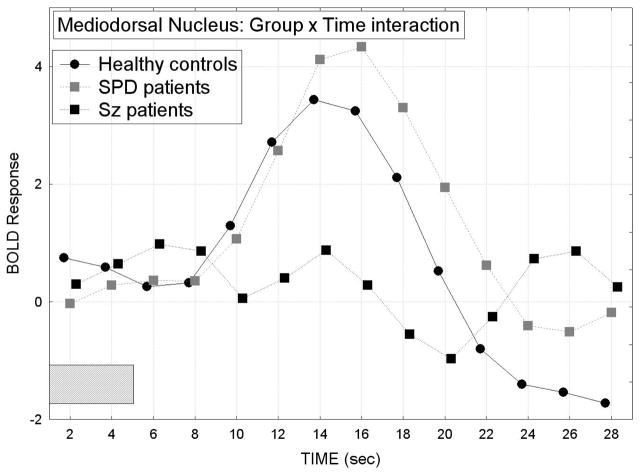
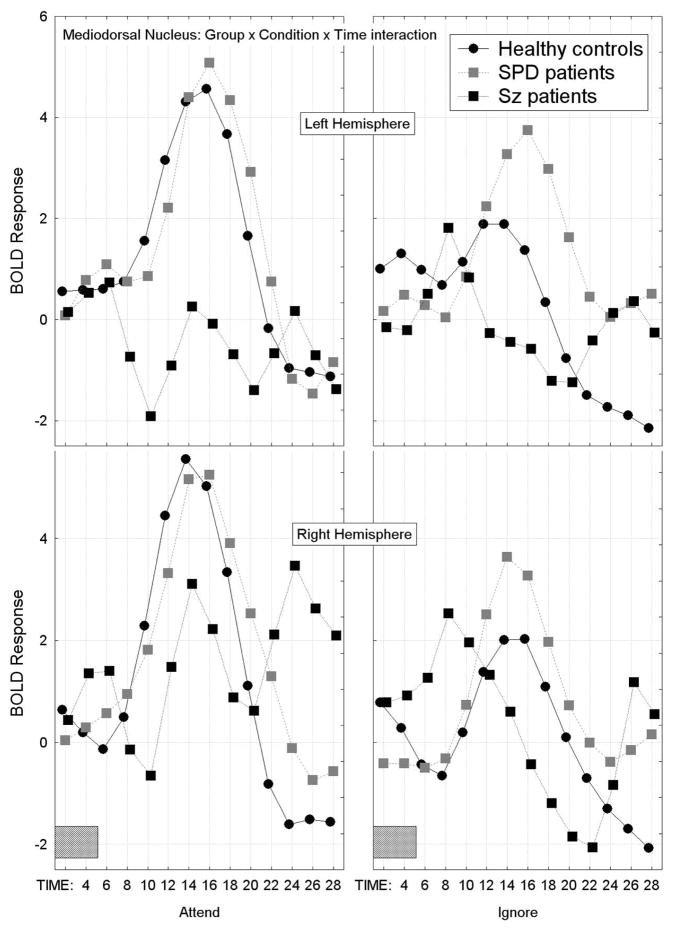
The SPD group also showed the largest overall BOLD response in the MDN of the thalamus, schizophrenia patients showed the smallest and the healthy controls were intermediate (BOLD response averaged across the attend/ignore PPI condition, hemisphere, and startle/no startle factors, Group × Time interaction, F[26,442]=2.38, p=0.031, G-G, ε=0.25; Figure 7).
Figure 7.
Mean BOLD response curves across time are shown for the mediodorsal nucleus (MDN) of the thalamus for each of the three groups. The BOLD response curves are averaged across the attend/ignore PPI condition, hemisphere, and startle/no startle factors. The SPD group showed the largest overall BOLD response, schizophrenia patients showed the smallest and the healthy controls were intermediate, Group × Time interaction, F[26,442]=2.38, p=0.031, G-G, ε=0.25.
The healthy controls showed attend>ignore PPI condition BOLD responses in the MDN. In contrast, the schizophrenia patients showed ignore>attend PPI condition BOLD responses in the left MDN. The SPD patients showed a pattern similar to the healthy controls, however, they showed greater-than-normal BOLD activation bilaterally in the MDN during the ignored PPI condition (Group × Condition × Hemisphere × Time interaction, F[26,442]=2.54, p=0.010, H-F, ε=0.35; Figure 8). None of the other interactions with Group were significant, nor was the main effect of Group (F[2,34]=0.84, p=0.44).
Figure 8.
Mean BOLD response curves in the MDN of the thalamus are shown for each of the three groups for each hemisphere and during the attend and ignore PPI conditions. Healthy controls showed attend>ignore PPI condition BOLD responses bilaterally in the MDN. In contrast, schizophrenia patients showed ignore>attend PPI condition BOLD responses in the left MDN. SPD patients showed a pattern similar to the healthy controls, however, they showed greater-than-normal BOLD activation bilaterally in the MDN during the ignored PPI condition, Group × Condition × Hemisphere × Time interaction, F[26,442]=2.54, p=0.010, H-F, ε=0.35.
Cortical mapping with voxel-by-voxel statistical maps
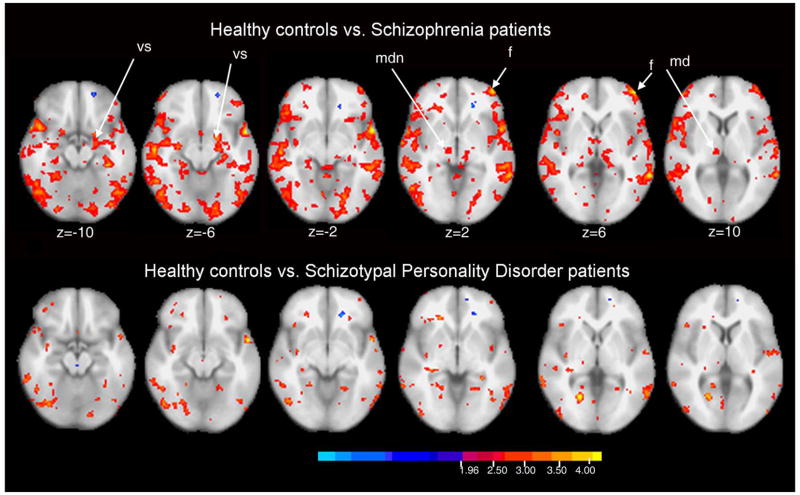
Figure 9 shows statistical probability maps (SPM) of comparisons of healthy controls and patients with schizophrenia and SPD and z-scores and cluster size for key FST regions are reported in Table 2. The between-group comparisons are for the attend-ignore PPI condition difference scores. Patients with schizophrenia showed widespread frontal and temporal areas with smaller attend minus ignore differences than healthy controls (red/orange/yellow areas). Areas with z scores above 4.0 are primarily in the frontal cortex. Areas identified above with hand-traced MRI (caudate, MDN) are also identified, but the tracing methods combined with time-course MANOVA appear somewhat more statistically powerful than shown in the SPM analysis.
Figure 9.
Significance probability mapping of healthy controls vs. patients with schizophrenia (top row) and schizotypal personality disorder patients (bottom row). Comparison is for attend minus ignore conditions and color bar shows z = 1.96 to 4.00 (p<0.05 to p<0.0005) so that both a-priori hypotheses (DLPFC decrease and decreases associated with significant traced regional effects) and exploratory hypotheses (survey of entire cortex) for healthy controls>patients may be examined. Anatomical abbreviations (vs=ventral striatum, mdn=medial dorsal nucleus, f=dorsolateral prefrontal cortex).
Table 2.
Key activation in brain regions labeled in SPM analysis shown in Figure 10. SPM analysis is between-groups and for the attend minus ignore PPI condition differences
| A. Comparison between schizophrenia patients and healthy controls (Controls – Sz patients) | ||||||
|---|---|---|---|---|---|---|
| Location | BA | Coordinates (x, y, z) | z-score | Cluster Size | ||
| Frontal Lobe (F): | ||||||
| (L) Dorsolateral prefrontal cortex | 46 | −46 | 54 | 0 | 4.0 | 393 |
| Striatum: | ||||||
| (L) Ventral striatum (VS) | −20 | 2 | −12 | 3.3 | 5533 | |
| Thalamus: | ||||||
| (R) Mediodorsal nucleus (MDN) | 8 | −20 | 6 | 2.6 | 73 | |
| B. Comparison between SPD patients and healthy controls (Controls – SPD patients) | ||||||
| Location | BA | Coordinates (x, y, z) | z-score | Cluster Size | ||
| Frontal Lobe (F): | ||||||
| (L) Dorsolateral prefrontal cortex | 46 | −40 | 54 | −6 | 2.54 | 158 |
| Striatum: | ||||||
| (R) Ventral striatum (VS) | 20 | 0 | −2 | 2.0 | 3 | |
| Thalamus: | ||||||
| (R) Mediodorsal nucleus (MDN) | 10 | −22 | 6 | 2.1 | 1 | |
| Coordinates are in mm (Talairach space) | ||||||
BA=Brodmann area, L=Left hemisphere, R=Right hemisphere
Correlation Between PPI and FST BOLD Activation During the Attended Prepulse Condition
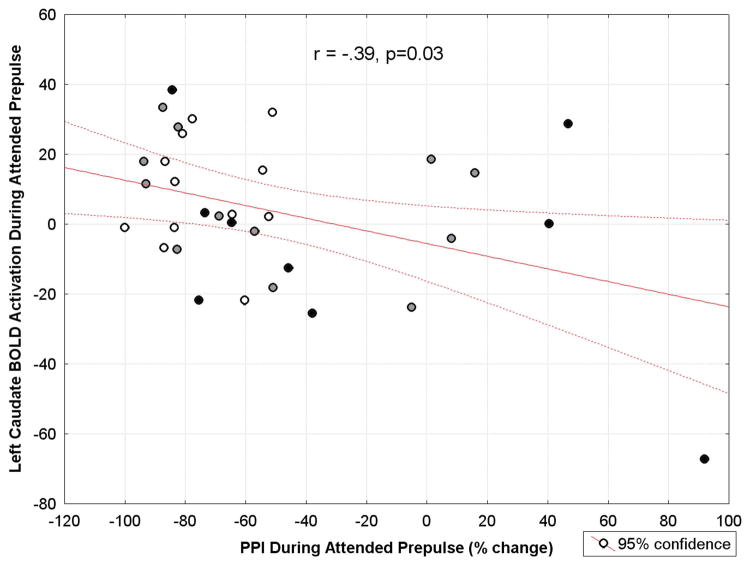
Pearson correlation coefficients were calculated between PPI and BOLD activation (AUC) in left and right DLPFC, caudate, putamen, and MDN during the attended prepulse condition for the combined normal-SPD-Schizophrenia group. Poor sensorimotor gating (measured as PPI) was associated with lower left caudate BOLD activation (r(31)= −.39, p=0.03; Figure 10). None of the remaining correlations were significant (all p>0.11).
Figure 10.
Scatterplot for the correlation between prepulse inhibition (PPI) of the startle eyeblink response and fMRI BOLD activation in the left caudate nucleus during the attended prepulse condition in the spectrum (n=33) from healthy controls (represented as white circles) to SPD patients (gray circles) to schizophrenia patients (black circles). Among the group, more deficient PPI was associated with less caudate activation during the attended prepulse condition (r = −.39, p = 0.03). This association appears to be driven by some schizophrenia-spectrum patients in the bottom right portion of the graph (poor sensorimotor gating or PPI and lower caudate activity), as well as, a few patients who appear in the top left portion of the graph (good sensorimotor gating and higher caudate activity).
Performance on the Tone-Length Judgment Task
From the participant’s perspective, every attended prepulse tone whether it was the usual, standard duration (5 sec) or the longer-than-usual duration (8 sec) had to be equally attended to during the first five seconds of presentation. However, once the attended prepulse tone reached a 5-sec duration, a decision needed to be made as to whether it was the standard-length tone or the longer-than-usual tone prepulse. For each participant, we recorded the accuracy of the count made of the longer-than-usual (i.e. 8 sec versus the usual 5 sec) attended tone prepulses at the end of each trial block to ensure they were performing the selective-attention task. This also served as a behavioral measure to determine whether there were group differences in performance. There was one longer-than-usual occurrence of the to-be-attended prepulse in each of the six trial blocks.
In all three groups, the majority of the participants performed well on the task; 8 of the 13 schizophrenia patients, 10 of the 13 SPD patients, and 11 of the 13 healthy controls gave answers that were within 2 of the correct answer. The mean error score did not significantly differ between the three groups (error score for Controls: mean=1.23, SD=1.17; SPD patients: mean=1.85, SD=1.95; Schizophrenia patients: mean=2.38, SD=2.36; Kruskal-Wallis test: H=1.48, df=2, p=0.48).
Discussion
To our knowledge, this is the first study to examine the time course of frontal-striatal-MDN activation during a PPI paradigm in an unmedicated schizophrenia-spectrum sample. Our main finding is that compared with healthy controls, schizophrenia patients showed diminished BOLD activation curves in the dorsolateral prefrontal cortex, caudate, putamen, and MDN during the attended PPI condition while the SPD patients tended to show greater-than-normal activation during the ignored PPI condition. Our findings indicate that while both schizophrenia-spectrum patient groups exhibit FST dysfunction during an attentional modulation of PPI, it is manifested somewhat differently in SPD and schizophrenia. The schizophrenia patients showed diminished BOLD response activation in FST regions during the attended PPI condition suggesting they fail to activate this circuit to attend to a stimulus that is salient. In contrast, the SPD patients showed a pattern of enhanced BOLD activation in FST regions during the ignored PPI condition suggesting they cannot ignore stimuli that are unimportant. Fronto-striatal circuits play a central role in modulating sustained attention and SPD patients display deficits in cognitive processing similar to those observed in schizophrenia (Siever and Davis 2004). Consistent with prior theories of resource allocation in schizophrenia (e.g., Braff 1993; Nuechterlein and Dawson 1984), our findings suggest two different types of deficient FST resource allocation: the schizophrenia patients seem deficient in the ability to mobilize and allocate resources from the FST circuit, whereas the SPD patients seem to show a pattern of excessive FST resource allocation during non-salient stimuli.
Our finding of diminished FST activation in schizophrenia patients during an active attention PPI paradigm is consistent with prior FDG-PET (Hazlett and Buchsbaum 2001; Hazlett et al 1998) and fMRI studies examining brain activity during a PPI paradigm (Kumari et al 2003, 2007a). We previously reported lower relative glucose metabolism using FDG-PET in DLPFC in schizophrenia patients compared with healthy controls during an attention-to-prepulse paradigm with simultaneous startle eyeblink recording. We also reported that among healthy controls, greater PPI of the startle eyeblink response during the attended PPI condition was associated with greater relative glucose in DLPFC, whereas in schizophrenia patients this relationship was found in a much smaller region of PFC (Hazlett and Buchsbaum 2001). Two prior whole-brain approach fMRI studies used a tactile PPI paradigm which showed greater activation of striatal and thalamic regions in healthy controls compared with medicated schizophrenia patients (Kumari et al 2003, 2007a). The Kumari et al. (2003) study examined six patients all of whom were treated (doctor’s choice) with typical antipsychotics while the more recent study (Kumari et al 2007a) examined patients on a range of doses of either typical or atypical (risperidone versus olanzapine) antipsychotics (10 in each of the three groups). It is important to note that unlike the present study and our previous fMRI study in healthy controls (Hazlett et al 2001), Kumari et al. (Kumari et al 2003, 2007a) used a passive, uninstructed PPI paradigm. Nevertheless, the similar pattern of activation across both active and passive attention PPI paradigms in healthy individuals supports the involvement of FST circuitry during both passive- and active-attention modulation of PPI. Our finding of greater BOLD response activation in FST regions during the attended compared with the ignored PPI condition in the healthy controls and less differential activation in schizophrenia-spectrum patients is also consistent with the lesion and pharmacological studies examining the neural substrates modulating PPI in the rat as a schizophrenia model (e.g., Swerdlow et al 2001).
Our finding in healthy controls of greater BOLD activation in the MDN during the attended than in the ignored PPI condition replicates our prior fMRI study with a 1.5T magnet in an independent sample of healthy individuals (Hazlett et al 2001), suggesting this finding is reliable. The thalamus has been hypothesized to play a central role in the altered circuitry in schizophrenia (Andreasen et al 1996) and particularly the MDN of the thalamus given it has direct connections with DLPFC and integrates incoming sensory information with higher cortical regions involved in planning response strategies. Consistent with several prior studies, we found that compared with healthy controls, schizophrenia patients showed lower overall MDN activation (e.g., Buchsbaum et al 1991; Hazlett et al 1999) yet, consistent with inefficient attentional processing in schizophrenia, the patients also showed greater left MDN activation during the ignore than the attend PPI condition. In contrast, the SPD patients showed greater-than-normal overall activation in the MDN and in particular, greater activation during the ignore PPI condition. The overactivation of the MDN in the SPD group during a sustained attention task may result from a compensatory mechanism or hypervigilance which is protective against the more severe negative symptoms of schizophrenia. However, hypervigilance may result in inappropriately heightened attention to irrelevant stimuli consistent with the paranoid, referential symptoms of SPD.
In addition to showing greater-than-normal overall activation in the MDN, the SPD group also showed overactivation in the putamen. Our finding of low striatal activation in unmedicated schizophrenia patients and high striatal activation in SPD patients is consistent with work showing greater relative glucose metabolism with FDG-PET in the putamen, an area rich in D2 receptors, in SPD patients in relation to schizophrenia patients and healthy controls (Shihabuddin et al 2001). Given that these D2 receptors mediate dopaminergic inhibition of putamen activity, our findings are consistent with the idea of reduced dopaminergic activity in the putamen or lower susceptibility to dopaminergic up-regulation which hypothetically is protective against full-blown psychotic symptoms in SPD (Shihabuddin et al 2001).
A subgroup of the participants in the present study had their startle eyeblink measured in the psychophysiology laboratory within one week of their fMRI scan and these results are published elsewhere (Hazlett et al 2007). Consistent with several prior studies (Dawson et al 1993; Filion 1993; Hawk et al 2002; Hazlett et al 1998, 2003), the healthy controls showed greater prepulse inhibition of startle during the attended prepulse condition compared with the ignored prepulse condition. Compared with healthy controls, both of the schizophrenia-spectrum groups exhibited significantly less PPI during the attended prepulse. Previous studies have reported that schizophrenia-spectrum patients have deficient attentional modulation of PPI (Dawson et al 1993, 2000; Hazlett et al 1998, 2003, in press). In the present study, our correlational results suggest that schizophrenia-spectrum related deficits in PPI during the attended prepulse are associated with deficient left caudate activation and not DLPFC, putamen, or MDN function. However, future work with a larger sample size is needed in order to fully examine PPI-FST activation associations within each of the diagnostic subgroups separately. Nevertheless, our finding of an association between PPI and caudate activity in a schizophrenia-spectrum sample is consistent with data from animal studies which consider the striatum to be important in the modulation of PPI (e.g., Swerdlow et al 2001) and suggests that schizophrenia studies which measure striatal activity and PPI may ultimately help us target effective new treatments.
An unique feature of the present study is that we studied schizophrenia patients while off medication. All of the fMRI studies examining the underlying neural circuitry of PPI conducted to date have included medicated schizophrenia patients (Kumari et al 2003, 2007a) although a recent non-imaging study found the expected gating deficit in antipsychotic naïve patients (Kumari et al 2007b). Our findings suggest that schizophrenia (5/13 neuroleptic naïve) and SPD patients (12/13 neuroleptic naïve) exhibit dysfunction in dorsolateral, caudate, putamen, and mediodorsal nucleus regions during an attention-to-prepulse paradigm and that group differences are not due to current medication. Medicated patients failed to show the expected PPI vs. symptom severity correlations shown in unmedicated patients (Duncan et al 2006). Evidence from a double-blind study where schizophrenia patients were randomized to either 8-week treatment with amisulpride or olanzapine suggest that that the PPI-restoring effect of antipsychotics is likely attributed to a dopamine D2 receptor blockade (Quednow et al 2006). Future schizophrenia work employing measures of striatal activity together with PPI may be useful in predicting treatment response. Also, larger sample sizes are needed in functional imaging studies examining PPI in order to determine whether neuroleptic naïve and previously-medicated schizophrenia patients differ in striatal function.
Group differences in dorsolateral prefrontal cortex activation were observed during the prepulse+startle condition (when the startle stimulus was presented 120 ms following onset of the tone prepulse) and the prepulse alone condition. The healthy controls showed similar DLPFC activation during the prepulse+startle and startle alone condition (averaged across attend/ignore and hemisphere factors). In contrast, the schizophrenia patients showed much greater DLPFC activation during the prepulse+startle condition than the prepulse alone condition suggesting that they were more distracted by the startle stimulus. Startle inhibition has been explained in terms of sensorimotor gating, or perceptual filtering which involves the concept of the reduction of processing of and distraction by irrelevant or repetitive stimuli (Braff et al 1978, 1992). Graham’s (Graham 1975) concept of protection of processing resources is similar but it goes a step further by predicting differential processing of the prepulse as a function of startle inhibition. In Graham’s theory, the onset of the prepulse initiates two processes, one serving to identify the prepulse, and the other serving to protect the processing of the prepulse from interruption by the startle stimulus. The degree to which this protective mechanism is activated determines the extent of startle inhibition. It is interesting that in our study, the startle stimulus effect was only observed in the DLPFC and not in the other regions examined (caudate, putamen, MDN). Interestingly, in healthy volunteers, fMRI startle habituation effects are very prominent in the thalamus (McDowell et al 2006) and it is possible that this habituation mechanism is absent in our SPD group.
Limitations of this study include the small sample size. While our findings are promising and our study is the first to examine unmedicated patients, it will be important to replicate the findings in a larger sample. Our sample size of 13 unmedicated schizophrenia patients is larger than prior fMRI work examining PPI in medicated schizophrenia patients (n=10 and n=6 patients in Kumari et al 2003 and 2007, respectively). We were unable to carry out fMRI and psychophysiological recordings of PPI in the same session. However, our prior work examining simultaneous PPI during FDG-PET showed a similar pattern of greater PFC activation with greater PPI during the attended prepulse in the healthy controls suggesting the pattern is stable. Also, prior work has shown that startle eyeblink during an attended prepulse has good test-retest reliability (Hawk et al 2002).
Our method used hand-tracing of caudate and other structures on each participant’s anatomical MRI which is time-consuming. However, to match our earlier studies on the caudate, e.g., (Buchsbaum et al 1986, 1992), we examined the correlation between our hand-tracings and a stereotaxic box at xyz 12,12,12 (Talairach and Tournoux 1988). A 5×5 pixel box placed in the caudate with root-mean-square assessment of fMRI activity yielded both a significant difference between attend minus ignore conditions in patients with schizophrenia (−8.12, sd=20.25) and normal controls (3.35, sd= 6.48; t-1.95, df=24, p=0.032, 1-tailed). The correlation between hand-traced root-mean-square and stereotaxic box was 0.49, p=0.012. This indicates that an entirely automated method can yield a single score for patient characterization on the attentional dimension which may be useful in future studies for predicting neuroleptic response and following neuroleptic action. Given a recent double-blind, randomized controlled trial showed that olanzapine effectively increased PPI in schizophrenia but risperidone and haloperidol had no such effects (Wynn et al 2007), it will be important for future studies to determine the underlying neural substrates so that pharmacological treatments can be targeted.
In conclusion, this study found that activation of frontal-striatal-MDN circuitry during an active attention PPI paradigm is abnormal in both schizophrenia and SPD patients and likely underlies deficient modulation of PPI in these groups. Schizophrenia patients showed an overall pattern of failing to activate key FST regions during the attend PPI while SPD patients tended to over-activate FST regions during the ignore PPI condition. Our findings suggest that either one of these patterns of FST circuitry dysfunction may in turn, lead to deficient attentional modulation of PPI which has reliably been reported in both SPD and schizophrenia patients (Dawson et al 1993, 2000; Hazlett et al 1998, 2003, 2007, in press). Although generally consistent with the SPM analysis, our findings were more robust using our hypothesis-driven region-of-interest MANOVA approach highlighting the strength of this statistical strategy. Our findings build upon prior rodent models delineating the neural circuitry modulating PPI and provide important implications for future PPI research. For example, combining PPI and fMRI measures of FST activation in future medication trials may be a useful strategy for new targeted region-of-interest based pharmacological treatments and predicting treatment response in schizophrenia.
Acknowledgments
This research was supported by an Independent Investigator Award from the National Alliance for Research on Schizophrenia and Depression (NARSAD) and R01MH073911 to E.A.H. The authors wish to thank Frank Macaluso for his technical assistance with MRI acquisition.
Footnotes
Publisher's Disclaimer: This is a PDF file of an unedited manuscript that has been accepted for publication. As a service to our customers we are providing this early version of the manuscript. The manuscript will undergo copyediting, typesetting, and review of the resulting proof before it is published in its final citable form. Please note that during the production process errors may be discovered which could affect the content, and all legal disclaimers that apply to the journal pertain.
References
- American-Psychiatric-Association. DSM-IV: Diagnostic and Statistical Manual of Mental Disorders. 4. Washington, DC.: APA; 1994. [Google Scholar]
- Andreasen N, Flaum M, Arndt S. The Comprehensive Assessment of Symptoms and History (CASH): An instrument for assessing diagnosis and psychopathology. Arch Gen Psychiatry. 1992;49:615–623. doi: 10.1001/archpsyc.1992.01820080023004. [DOI] [PubMed] [Google Scholar]
- Andreasen N, O’Leary D, Cizadlo T, Arndt S, Rezai K, Boles Ponto L, et al. Schizophrenia and cognitive dymetria: A positron-emission tomography study of dysfunctional prefrontal-thalamic-cerebellar circuitry. Proc Natl Acad Sci USA. 1996;93:9985–9990. doi: 10.1073/pnas.93.18.9985. [DOI] [PMC free article] [PubMed] [Google Scholar]
- Blumenthal TD. Short lead interval startle modification. In: Dawson ME, Schell AM, Bohmelt AH, editors. Startle Modification: Implications for Neuroscience, Cognitive Science, and Clinical Science. Cambridge, UK: Cambridge University Press; 1999. pp. 51–71. [Google Scholar]
- Braff D. Information processing and attention dysfunctions in schizophrenia. Schizophr Bull. 1993;19:233–259. doi: 10.1093/schbul/19.2.233. [DOI] [PubMed] [Google Scholar]
- Braff D, Stone C, Callaway E, Geyer M, Glick I, Bali L. Prestimulus effects on human startle reflex in normals and schizophrenics. Psychophysiology. 1978;15:339–343. doi: 10.1111/j.1469-8986.1978.tb01390.x. [DOI] [PubMed] [Google Scholar]
- Braff DL, Grillon C, Geyer MA. Gating and habituation of the startle reflex in schizophrenic patients. Arch Gen Psychiatry. 1992;49:206–215. doi: 10.1001/archpsyc.1992.01820030038005. [DOI] [PubMed] [Google Scholar]
- Brickman AM, Buchsbaum MS, Shihabuddin L, Hazlett EA, Borod JC, Mohs RC. Striatal size, glucose metabolic rate, and verbal learning in normal aging. Brain Res Cogn Brain Res. 2003;17:106–116. doi: 10.1016/s0926-6410(03)00085-5. [DOI] [PubMed] [Google Scholar]
- Buchsbaum M, Haier R, Teng C, Potkin S, Nuechterlein K, Lohr J, et al. Striatal-thalamic disorder of cerebral metabolism in never-medicated schizophrenics. Schizophr Res. 1991;4:401. doi: 10.1001/archpsyc.1992.01820120023005. [DOI] [PubMed] [Google Scholar]
- Buchsbaum MS, Nenadic I, Hazlett EA, Spiegel-Cohen J, Fleischman MB, Akhavan A, et al. Differential metabolic rates in prefrontal and temporal Brodmann areas in schizophrenia and schizotypal personality disorder. Schizophr Res. 2002;54:141–150. doi: 10.1016/s0920-9964(01)00361-9. [DOI] [PubMed] [Google Scholar]
- Buchsbaum MS, Potkin SG, Siegel BV, Jr, Lohr J, Katz M, Gottschalk LA, et al. Striatal metabolic rate and clinical response to neuroleptics in schizophrenia. Arch Gen Psychiatry. 1992;49:966–974. doi: 10.1001/archpsyc.1992.01820120054008. [DOI] [PubMed] [Google Scholar]
- Buchsbaum MS, Wu J, DeLisi LE, Holcomb H, Kessler R, Johnson J, et al. Frontal cortex and basal ganglia metabolic rates assessed by positron emission tomography with [18F]2-deoxyglucose in affective illness. J Affect Disord. 1986;10:137–152. doi: 10.1016/0165-0327(86)90036-4. [DOI] [PubMed] [Google Scholar]
- Bunney WE., Jr . Psychiatry: A World Perspective. Vol. 2. Amsterdam: Elsevier; 1990. Schizophrenia--new hypotheses and treatments. [Google Scholar]
- Cadenhead KS, Geyer MA, Braff DL. Impaired startle prepulse inhibition and habituation in patients with schizotypal personality disorder. Am J Psychiatry. 1993;150:1862–1867. doi: 10.1176/ajp.150.12.1862. [DOI] [PubMed] [Google Scholar]
- Cadenhead KS, Swerdlow NR, Shafer KM, Diaz M, Braff DL. Modulation of the startle response and startle laterality in relatives of schizophrenic patients and in subjects with schizotypal personality disorder: evidence of inhibitory deficits. Am J Psychiatry. 2000;157:1660–1668. doi: 10.1176/appi.ajp.157.10.1660. [DOI] [PubMed] [Google Scholar]
- Callaway E, Naghdi S. An information processing model for schizophrenia. Arch Gen Psychiatry. 1982;39:339–347. doi: 10.1001/archpsyc.1982.04290030069012. [DOI] [PubMed] [Google Scholar]
- Carlsson M, Carlsson A. Interactions between glutametergic and monoaminergic systems within the basal ganglia: Implications for schizophrenia and Parkinson’s disease. Trends Neurosci. 1990;13:272–276. doi: 10.1016/0166-2236(90)90108-m. [DOI] [PubMed] [Google Scholar]
- Dawson ME, Hazlett EA, Filion DL, Nuechterlein KH, Schell AM. Attention and schizophrenia: impaired modulation of the startle reflex. J Abnorm Psychol. 1993;102:633–641. doi: 10.1037//0021-843x.102.4.633. [DOI] [PubMed] [Google Scholar]
- Dawson ME, Schell AM, Hazlett EA, Nuechterlein KH, Filion DL. On the clinical and cognitive meaning of impaired sensorimotor gating in schizophrenia. Psychiatry Res. 2000;96:187–197. doi: 10.1016/s0165-1781(00)00208-0. [DOI] [PubMed] [Google Scholar]
- Dickey CC, McCarley RW, Shenton ME. The brain in schizotypal personality disorder: a review of structural MRI and CT findings. Harv Rev Psychiatry. 2002;10:1–15. doi: 10.1080/10673220216201. [DOI] [PMC free article] [PubMed] [Google Scholar]
- Duncan EJ, Bollini AM, Lewison B, Keyes M, Jovanovic T, Gaytan O, et al. Medication status affects the relationship of symptoms to prepulse inhibition of acoustic startle in schizophrenia. Psychiatry Res. 2006;145:137–145. doi: 10.1016/j.psychres.2006.04.006. [DOI] [PubMed] [Google Scholar]
- Filion DL, Dawson ME, Schell AM. Modification of the acoustic startle-reflex eyeblink: A tool for investigating early and late attentional processes. Biol Psychology. 1993;35:185–200. doi: 10.1016/0301-0511(93)90001-o. [DOI] [PubMed] [Google Scholar]
- Filion DL, Dawson ME, Schell AM. The psychological significance of human startle eyeblink modification: a review. Biological psychology. 1998;47:1–43. doi: 10.1016/s0301-0511(97)00020-3. [DOI] [PubMed] [Google Scholar]
- First MB, spitzer RL, Gibbon M, Williams JBW, Benjamin LS. User’s guide for the structured clinical interview for DSM-IV axis I (SCID-I) Washington, DC.: American Psychiatric Press; 1995. [Google Scholar]
- Graham FK. Presidential Address, 1974. The more or less startling effects of weak prestimulation. Psychophysiology. 1975;12:238–248. doi: 10.1111/j.1469-8986.1975.tb01284.x. [DOI] [PubMed] [Google Scholar]
- Grillon C, Ameli R, Charney DS, Krystal J, Braff D. Startle gating deficits occur across prepulse intensities in schizophrenic patients. Biol Psychiatry. 1992;32:939–943. doi: 10.1016/0006-3223(92)90183-z. [DOI] [PubMed] [Google Scholar]
- Hawk LW, Jr, Pelham WE, Jr, Yartz AR. Attentional modification of short-lead prepulse inhibition and long-lead prepulse facilitation of acoustic startle among preadolescent boys. Psychophysiology. 2002;39:333–339. doi: 10.1017/s0048577201393071. [DOI] [PubMed] [Google Scholar]
- Hazlett EA, Buchsbaum M, Byne W, Wei T-C, Spiegel-Cohen J, Geneve C, et al. Three-dimensional analysis with MRI and PET of the size, shape, and function of the thalamus in the schizophrenia spectrum. Am J Psychiatry. 1999;156:1190–1199. doi: 10.1176/ajp.156.8.1190. [DOI] [PubMed] [Google Scholar]
- Hazlett EA, Buchsbaum MS. Sensorimotor gating deficits and hypofrontality in schizophrenia. Front Biosci. 2001;6:D1069–1072. doi: 10.2741/hazlett. [DOI] [PubMed] [Google Scholar]
- Hazlett EA, Buchsbaum MS, Haznedar MM, Singer MB, Schnur DB, Jimenez EA, et al. Prefrontal cortex glucose metabolism and startle eyeblink modification abnormalities in unmedicated schizophrenia patients. Psychophysiology. 1998;35:186–198. [PubMed] [Google Scholar]
- Hazlett EA, Buchsbaum MS, Tang CY, Fleischman MB, Wei TC, Byne W, et al. Thalamic activation during an attention-to-prepulse startle modification paradigm: a functional MRI study. Biol Psychiatry. 2001;50:281–291. doi: 10.1016/s0006-3223(01)01094-0. [DOI] [PubMed] [Google Scholar]
- Hazlett EA, Dawson ME, Schell AM, Nuechterlein KH. Probing attentional dysfunctions in schizophrenia: Startle modification during a continuous performance test. Psychophysiology. doi: 10.1111/j.1469-8986.2008.00653.x. in press. [DOI] [PubMed] [Google Scholar]
- Hazlett EA, Levine J, Buchsbaum MS, Silverman JM, New A, Sevin EM, et al. Deficient attentional modulation of the startle response in patients with schizotypal personality disorder. Am J Psychiatry. 2003;160:1621–1626. doi: 10.1176/appi.ajp.160.9.1621. [DOI] [PubMed] [Google Scholar]
- Hazlett EA, Romero M, Haznedar MM, New AS, Goldstein KE, Newmark RE, et al. Deficient attentional modulation of startle eyeblink is associated with symptom severity in the schizophrenia spectrum. Schizophr Res. 2007;93:288–295. doi: 10.1016/j.schres.2007.03.012. [DOI] [PubMed] [Google Scholar]
- Jenkinson M, Bannister P, Brady M, Smith S. Improved optimization for the robust and accurate linear registration and motion correction of brain images. Neuroimage. 2002;17:825–841. doi: 10.1016/s1053-8119(02)91132-8. [DOI] [PubMed] [Google Scholar]
- Kemether EM, Buchsbaum MS, Byne W, Hazlett EA, Haznedar M, Brickman AM, et al. Magnetic resonance imaging of mediodorsal, pulvinar, and centromedian nuclei of the thalamus in patients with schizophrenia. Arch Gen Psychiatry. 2003;60:983–991. doi: 10.1001/archpsyc.60.9.983. [DOI] [PubMed] [Google Scholar]
- Kendler KS, McGuire M, Gruenberg AM, O’Hare A, Spellman M, Walsh D. The Roscommon Family Study. III. Schizophrenia-related personality disorders in relatives. Arch Gen Psychiatry. 1993;50:781–788. doi: 10.1001/archpsyc.1993.01820220033004. [DOI] [PubMed] [Google Scholar]
- Kety SSRD, Wender PH, Schulsinger F. The types and prevalence of mental illness in the biological and adoptive families of adopted schizophrenics. In: Rosenthal DKS, editor. Second Research Conference of the Foundation’s Fund for Research in Psychiatry. London: Pergamon Press; 1967. pp. 345–362. [Google Scholar]
- Koch M, Schnitzler HU. The acoustic startle response in rats--circuits mediating evocation, inhibition and potentiation. Behavioural brain research. 1997;89:35–49. doi: 10.1016/s0166-4328(97)02296-1. [DOI] [PubMed] [Google Scholar]
- Kumari V, Antonova E, Geyer MA, Ffytche D, Williams SC, Sharma T. A fMRI investigation of startle gating deficits in schizophrenia patients treated with typical or atypical antipsychotics. International Journal of neuropsychopharmacology. 2007a;4:463–477. doi: 10.1017/S1461145706007139. [DOI] [PubMed] [Google Scholar]
- Kumari V, Fannon D, Sumich AL, Sharma T. Startle gating in antipsychotic-naive first episode schizophrenia patients: one ear is better than two. Psychiatry Res. 2007b;151:21–28. doi: 10.1016/j.psychres.2006.09.013. [DOI] [PubMed] [Google Scholar]
- Kumari V, Gray JA, Geyer MA, ffytche D, Soni W, Mitterschiffthaler MT, et al. Neural correlates of tactile prepulse inhibition: a functional MRI study in normal and schizophrenic subjects. Psychiatry Res. 2003;122:99–113. doi: 10.1016/s0925-4927(02)00123-3. [DOI] [PubMed] [Google Scholar]
- Kumari V, Sharma T. Effects of typical and atypical antipsychotics on prepulse inhibition in schizophrenia: a critical evaluation of current evidence and directions for future research. Psychopharmacology (Berl) 2002;162:97–101. doi: 10.1007/s00213-002-1099-x. [DOI] [PubMed] [Google Scholar]
- Kumari V, Soni W, Sharma T. Normalization of information processing deficits in schizophrenia with clozapine. Am J Psychiatry. 1999;156:1046–1051. doi: 10.1176/ajp.156.7.1046. [DOI] [PubMed] [Google Scholar]
- Levitt JJ, McCarley RW, Dickey CC, Voglmaier MM, Niznikiewicz MA, Seidman LJ, et al. MRI study of caudate nucleus volume and its cognitive correlates in neuroleptic-naive patients with schizotypal personality disorder. The American journal of psychiatry. 2002;159:1190–1197. doi: 10.1176/appi.ajp.159.7.1190. [DOI] [PMC free article] [PubMed] [Google Scholar]
- Levitt JJ, Westin CF, Nestor PG, Estepar RS, Dickey CC, Voglmaier MM, et al. Shape of caudate nucleus and its cognitive correlates in neuroleptic-naive schizotypal personality disorder. Biol Psychiatry. 2004;55:177–184. doi: 10.1016/j.biopsych.2003.08.005. [DOI] [PMC free article] [PubMed] [Google Scholar]
- McDowell JE, Brown GG, Lazar N, Camchong J, Sharp R, Krebs-Thomson K, et al. The neural correlates of habituation of response to startling tactile stimuli presented in a functional magnetic resonance imaging environment. Psychiatry Res. 2006;148:1–10. doi: 10.1016/j.pscychresns.2006.05.008. [DOI] [PubMed] [Google Scholar]
- Mitelman SA, Shihabuddin L, Brickman AM, Buchsbaum MS. Cortical intercorrelations of temporal area volumes in schizophrenia. Schizophr Res. 2005;76:207–229. doi: 10.1016/j.schres.2005.01.010. [DOI] [PubMed] [Google Scholar]
- Nuechterlein KH, Dawson ME. Information processing and attentional functioning in the developmental course of schizophrenic disorders. Schizophr Bull. 1984;10:160–203. doi: 10.1093/schbul/10.2.160. [DOI] [PubMed] [Google Scholar]
- Overall J, Gorham D. The Brief Psychiatric Rating Scale. Psychological Reports. 1962;10:799–812. [Google Scholar]
- Pfohl B, Blum NMZ. Structured Interview for DSM-III-R Personality (SIDP-R) Iowa City: University of Iowa; 1989. [Google Scholar]
- Quednow BB, Wagner M, Westheide J, Beckmann K, Bliesener N, Maier W, et al. Sensorimotor gating and habituation of the startle response in schizophrenic patients randomly treated with amisulpride or olanzapine. Biol Psychiatry. 2006;59:536–545. doi: 10.1016/j.biopsych.2005.07.012. [DOI] [PubMed] [Google Scholar]
- Rajkowska G, Goldman-Rakic PS. Cytoarchitectonic definition of prefrontal areas in the normal human cortex: I. Remapping of areas 9 and 46 using quantitative criteria. Cereb Cortex. 1995;5:307–322. doi: 10.1093/cercor/5.4.307. [DOI] [PubMed] [Google Scholar]
- Selemon LD, Mrzljak J, Kleinman JE, Herman MM, Goldman-Rakic PS. Regional specificity in the neuropathologic substrates of schizophrenia: a morphometric analysis of Broca’s area 44 and area 9. Arch Gen Psychiatry. 2003;60:69–77. doi: 10.1001/archpsyc.60.1.69. [DOI] [PubMed] [Google Scholar]
- Shihabuddin L, Buchsbaum M, Hazlett E, Silverman J, New A, Brickman A, et al. Striatal size and relative glucose metabolic rate in schizotypal personality disorder and schizophrenia. Arch Gen Psychiatry. 2001;58:877–884. doi: 10.1001/archpsyc.58.9.877. [DOI] [PubMed] [Google Scholar]
- Siever LJ, Davis KL. The pathophysiology of schizophrenia disorders: perspectives from the spectrum. Am J Psychiatry. 2004;161:398–413. doi: 10.1176/appi.ajp.161.3.398. [DOI] [PubMed] [Google Scholar]
- Smith SM. Fast robust automated brain extraction. Hum Brain Mapp. 2002;17:143–155. doi: 10.1002/hbm.10062. [DOI] [PMC free article] [PubMed] [Google Scholar]
- Smith SM, Jenkinson M, Woolrich MW, Beckmann CF, Behrens TE, Johansen-Berg H, et al. Advances in functional and structural MR image analysis and implementation as FSL. Neuroimage. 2004;23(Suppl 1):S208–219. doi: 10.1016/j.neuroimage.2004.07.051. [DOI] [PubMed] [Google Scholar]
- StatSoft I. Statistica, 6.0 ed. Tulsa, OK: 2003. www.statsoft.com. [Google Scholar]
- Swerdlow N, Koob G. Dopamine, schizophrenia, mania, and depression: Towards a unified hypothesis of cortico-striato-palido-thalamic function. Behavioral and Brain Sciences. 1987;10:197–245. [Google Scholar]
- Swerdlow NR, Geyer MA, Braff DL. Neural circuit regulation of prepulse inhibition of startle in the rat: current knowledge and future challenges. Psychopharmacology (Berl) 2001;156:194–215. doi: 10.1007/s002130100799. [DOI] [PubMed] [Google Scholar]
- Swerdlow NR, Light GA, Cadenhead KS, Sprock J, Hsieh MH, Braff DL. Startle gating deficits in a large cohort of patients with schizophrenia: relationship to medications, symptoms, neurocognition, and level of function. Arch Gen Psychiatry. 2006;63:1325–1335. doi: 10.1001/archpsyc.63.12.1325. [DOI] [PubMed] [Google Scholar]
- Talairach J, Tournoux P. Co-planar Stereotaxic Atlas of the Human Brain. Stuttgart: Thieme; 1988. [Google Scholar]
- Wynn JK, Green MF, Sprock J, Light GA, Widmark C, Reist C, et al. Effects of olanzapine, risperidone and haloperidol on prepulse inhibition in schizophrenia patients: a double-blind, randomized controlled trial. Schizophr Res. 2007;95:134–142. doi: 10.1016/j.schres.2007.05.039. [DOI] [PMC free article] [PubMed] [Google Scholar]


