

Abstract
We studied the effectiveness of trilysine (Lys3)-, tetralysine (Lys4)-, pentalysine (Lys5)-, and poly-L-lysine (PLL) (MW: 50,000) on λ-DNA nanoparticle formation, and characterized the size, shape and stability of nanoparticles. Light scattering experiments showed EC50 (lysine concentration at 50% DNA compaction) values of ~0.0036, 2, and 20 μmoles/liter, respectively, for PLL, Lys5, and Lys4 at 10 mM [Na+]. Plots of log[EC50] versus log[Na+] showed positive slopes of 1.09 and 1.7, respectively, for Lys4 and Lys5 and a negative slope of −0.1 for PLL. Hydrodynamic radii of oligolysine-condensed particles increased (48–173 nm) with increasing [Na+], whereas no significant change occurred to nanoparticles formed with PLL. There was an increase in the size of nanoparticles formed with Lys5 at >40 °C, whereas no such change occurred with PLL. DNA melting temperature increased with oligolysine concentration. These results indicate distinct differences in the mechanism(s) by which oligolysines and PLL provoke DNA condensation to nanoparticles.
Keywords: DNA nanoparticles, DNA condensation, Lysine-DNA interaction, DNA-poly-L-lysine complexes, Toroidal condensation
DNA condensation to nanoparticles has been extensively studied to understand the energetic forces involved in the control of DNA compaction in viral capsids and in chromosomes, and to develop novel gene delivery vehicles.1 Natural and synthetic polyamines, basic proteins, synthetic polymers, and dehydrating solvents are excellent promoters of DNA condensation and aggregation.1–3 In dilute solutions, these agents collapse DNA to nanoparticles of finite size and ordered morphology.4–6 Toroidal structures have been observed for these nanoparticles by several investigators, although spherical and rod-like structures have also been found using electron and atomic force microscopy. A hexagonal, liquid crystalline packaging arrangement has been observed for cation condensed DNA.7,8
The interaction of oligopeptides, including oligolysines with DNA was studied earlier by several investigators as a model system for evaluating the thermodynamic parameters of protein-DNA interactions.9,10 In recent years, poly-L-lysine (PLL)-mediated DNA condensation has been studied as a model for DNA compaction to nanoparticles, and for the use of DNA nanoparticles for gene delivery applications.11–14 Oligolysine-DNA interaction has been modeled on the basis of the counterion condensation theory developed by Manning15 and Record et al.16 However, there has not been much attempt to examine the mechanism of the interaction of poly-L-lysine with DNA, especially the effect of ionic conditions of the medium and temperature. Comparative studies on the interaction of oligolysines and PLL with DNA are also scant. We, therefore, undertook the present study to examine the effects of monovalent ion (Na+) concentration and temperature on the ability of trilysine (Lys3), tetralysine (Lys4), pentalysine (Lys5), and PLL to condense λ-DNA using static and dynamic light scattering techniques, and electron microscopy.
Among the cationic biopolymers with gene therapy applications, PLL has received much attention because it is amenable to chemical modifications and can be conjugated to a variety of ligands to achieve receptor-mediated uptake for gene delivery applications.17–20 DNA collapse by PLL leads to structures of various shapes (i.e. toroids, spheroids or rods) and sizes, depending on its ratio to DNA and the conditions of the medium.21–25 PLL can bind DNA cooperatively or non-cooperatively, producing unimolecular complexes or multimolecular aggregates, respectively. In addition to condensation, polypeptides confer marked stabilization to DNA against thermal denaturation, and the magnitude of stabilization and specificity of the interaction depends on the nature of the polypeptide chain.17,18
Our present results indicate that the efficacy of lysines to condense DNA increased with the number of positive charges on the molecules, with PLL being a better condensing agent than oligolysines. Temperature-dependent measurements of hydrodynamic radii of DNA nanoparticles showed that the presence of Lys5 caused aggregation as the temperature increased > 40 °C, whereas PLL did not have such an effect. Oligolysines increased the Tm of DNA in a concentration-dependent manner, at concentrations used to condense the DNA. Complexes formed with PLL and DNA did not melt at temperatures up to 95 °C. These results provide new insights into the mode of interaction of DNA with oligolysines and PLL.
MATERIALS AND METHODS
λ-DNA
Lyophilized λ phage DNA (MW: 31.5×10⁶ Da; 48,502 base pairs) was purchased from Sigma Chemical Co. (St. Louis, MO). It was dissolved in 10 mM Na cacodylate buffer (10 mM Na cacodylate, 0.5 mM EDTA, pH 7.4), and dialyzed against the same buffer for 3 hours. The absorbance ratio (A260/A280) of the DNA solution was 1.9, indicating that the DNA was free from protein contamination.
Lysines and Reagents
Trilysine, tetralysine, pentalysine, and poly-L-lysine (MW range: 30,000–70,000), were purchased from Sigma Chemical Co. (St. Louis, MO). We determined the purity of the oligolysines from Sigma by thin layer chromatography, using silica gel plates with matrix polyester support to run the samples. The mobile phase consisted of 60% butanol, 25% double distilled (dd) deionized water, and 15% glacial acetic acid. The samples were spotted on the plates (at concentrations of 20 and 100 μmoles/liter), and the mobile phase was allowed to run for 5 hours. The plates were dried and sprayed with ninhydrin reagent solution (0.2% ninhydrin in ethanol), and then heated to 50 °C for 3 minutes to visualize the peptides. Lys3 and Lys4 migrated as single spots, indicating the homogeneity of the peptides. In the case of Lys5, we observed 2 minor spots, which co-migrated with a major spot of Lys5. The minor spots could be due to the presence of Lys3 and Lys4. However, the intensity of the major spot indicated that the material was > 95% Lys5. Average MW of PLL (50,000) was used to calculate the molar concentration in solution. Stock solutions of Lys3, Lys4, Lys5 (10 mM each) and PLL (1 mg/ml) were prepared in 10 mM Na cacodylate buffer. Subsequent dilutions were made with the same buffer. Buffers of increasing ionic strength (25 mM, 50 mM, 75 mM, 100 mM and 150 mM Na+) were prepared by adding appropriate amounts of 1 M NaCl solution to the 10 mM Na cacodylate buffer.
Total Intensity Light Scattering
Static light scattering experiments were performed using a Fluoromax-2 spectrofluorometer (Jobin Yvon-Spex Instruments S. A., Inc., Edison, NJ).26 The excitation and emission monochromators were both set to a wavelength of 305 nm with 5 nm band pass. The scattered light intensity was collected at a 90° angle with respect to the incident beam. Small quantities of stock oligolysine or PLL solutions were added to DNA/buffer solutions (0.5 μg/ml DNA) in 2 ml borosilicate glass tubes to achieve the desired concentration of the condensing agent. The solutions were vortexed gently and allowed to equilibrate for 30 minutes at 22 °C. They were then centrifuged in a Beckman GS 6KR centrifuge for 10 minutes at 500 × g to avoid light scattering from aggregated particles. Centrifugation at 500 × g did not result in phase separation or a reduction in DNA concentration in solution. Therefore, the light scattering measurements are representative of the DNA concentrations used.
Dynamic Laser Light Scattering
Dynamic light scattering experiments were performed using DynaPro model MSX equipment (Protein Solutions, Inc., Charlottesville, VA).27,28 Lysine solutions were added to DNA solutions (0.5 μg/ml) to achieve the desired condensing agent concentrations. The samples were mixed and allowed to attain equilibrium for 30 minutes at 22 °C, and centrifuged for 10 minutes at 500 × g and 4 °C to remove aggregate particles. Hydrodynamic radii were measured by transferring 45 μl of sample solution to a standard quartz cuvette, and the scattered light was detected at a 90° angle to the incident beam. All measurements were performed in the same cuvette to avoid variations introduced by minor differences between cuvettes. The cuvette was washed with double distilled water and vacuum-dried before each measurement. The measurements were performed at different temperatures, ranging from 20 °C to 80 °C, after equilibrating the sample at the indicated temperatures for 10 min.
A laser beam from a 2W laser (800 nm wavelength) was passed through a quartz cell holding the sample (lysine/DNA mixture), and the scattered light was detected at a 90° angle with respect to the incident beam. The scattered light was analyzed with an autocorrelator in order to generate the first-order autocorrelation function. The following equation describes the autocorrelation function, g(l) (τ), for monodisperse particles that are much smaller than the incident beam:
In this equation, τ is the decay time, q (= 4πn/[λosin(θ/2)]) is the scattering vector which is a function of the incident beam wavelength λo, the scattering angle θ, the refractive index of the solvent n, and the diffusion coefficient D. The hydrodynamic radius (Rh) is calculated from the diffusion coefficient using the Stokes-Einstein equation:
where T is the absolute temperature, η is solvent viscosity, and k is the Boltzmann constant. Data were analyzed by a Dynamics Version 6 software package obtained from Protein Solutions, Inc.
Electron Microscopy
Lysine-DNA condensates were visualized using a JEOL 1200EX electron microscope.27 Briefly, the samples were prepared by combining lysine solutions with DNA solutions (0.5 μg/ml) in order to achieve the desired cationic agent concentrations. The solutions were mixed and allowed to equilibrate for approximately 30 minutes. Formvar-coated copper grids (Electron Microscopy Sciences) were glow discharged for 60 seconds. Samples were placed on the grids for 10 minutes. The grids were then washed with water for 1–2 minutes and excess solution removed using a filter paper. The grids were stained with 1% uranyl acetate solution (1–2 minutes) and allowed to dry in air.
Centrifugation Assay for DNA Precipitation
In order to examine the ability of different lysines to precipitate DNA, we conducted the centrifugation assay.29 In brief, aliquots of DNA solution (DNA in100 mM Na+ cacodylate buffer) were mixed with lysine solution to achieve the desired condensing agent concentration in a final volume of 400 μL. The samples were vortexed for 5 seconds, incubated either at 22, 50, or 70 °C for 30 minutes, and centrifuged for 10 minutes at 11000 × g using a microcentrifuge. The supernatant was withdrawn for analysis and placed in a 350 μL quartz microcuvette (path length = 1 cm). Sample absorbance was measured using a Beckman DU 460 spectrophotometer at 260 nm. λ-DNA concentration used in centrifugation experiments was 0.1 A260nm units. The amount of DNA present in solution was calculated using the following equation: percent DNA in solution = (As/Ao) × 100; where As and Ao are the absorbance of the supernatant and control (DNA in the absence of lysine reagent), respectively, at 260 nm.
Melting Temperature (Tm) Measurements
Tm experiments were performed using a Beckman DU640 spectrophotometer.30 Tm cell block contained six cells, one of which was filled with buffer (used as a blank). Melting temperature was obtained by increasing the temperature of the sample at a rate of 0.5 °C/min, within a range of 40–95 °C, and monitoring the absorbance (A) every 30 seconds. Tm values were taken as the temperatures at which half of the complex was dissociated. Computer-generated first derivative of the melting curve, dA/dT (where A is absorbance and T is temperature) was also used for determining Tm. Tm measurements obtained by both methods did not deviate by more than 1 °C.
RESULTS
Static Light Scattering
The ability of oligolysines and PLL to condense λ-DNA was studied using static light scattering. Figure 1 shows the relative intensity of scattered light versus concentration of Lys4, Lys5, and PLL. In each case, a sharp rise (> 4-fold) occurred in the intensity of scattered light at a critical lysine concentration, which plateaued on further addition of lysine. A plateau in the light scattering profile indicates complete condensation of λ-DNA at high peptide concentrations. Among the oligolysines, Lys3 did not provoke DNA condensation even up to a concentration of 1 mM.
Figure 1.
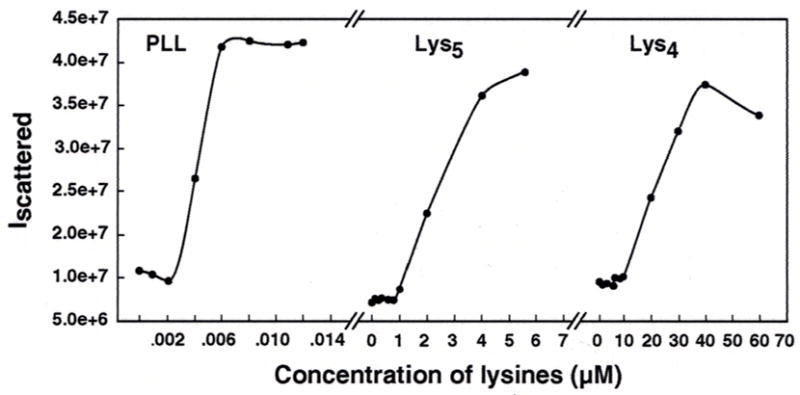
Typical plots of relative intensity of scattered light at 90° against concentrations of Lys4, Lys5, and PLL. The λ-DNA solution had a concentration of 1.5 μM DNA phosphate, dissolved in 10 mM Na cacodylate buffer, pH 7.4. Lysine concentrations are in terms of the whole molecules, μmoles/liter.
To compare the relative effectiveness of Lys4, Lys5, and PLL in condensing DNA, we calculated the EC50 values, which corresponded to lysine concentrations at which half of the DNA was in the compacted form. Our results are presented in Table 1. The effective concentration of PLL in inducing DNA condensation was much lower than that of Lys5. In the presence of 10 mM Na+, there was a 10-fold decrease in the EC50 value (from 20 to 2 μM) when Lys4 was replaced by Lys5, suggesting that Lys5 was more efficacious in condensing DNA than Lys4. We also compared the DNA condensing abilities of lysines by calculating the molar ratios of nitrogen to phosphate (N/P values) at the EC50 value. PLL demonstrated the greatest DNA condensation efficiency (N/P ~ 1.8), followed by Lys5 (N/P ~ 13), and Lys4 (N/P ~ 106). Our results indicate that DNA condensation by lysines is a sensitive function of the cationicity of the condensing agent.
Table 1.
Effects of Na+ concentration on EC50 values and hydrodynamic radius (Rh) of λ-DNA condensates formed in the presence of Lys4, Lys5, and poly-L-lysine
| Na+ (mM) | Tetralysine (Lys4)
|
Pentalysine (Lys5)
|
Poly-L-lysine (PLL)
|
|||
|---|---|---|---|---|---|---|
| EC50 (μmoles/l) | Rh (nm) | EC50 (μmoles/l) | Rh (nm) | EC50 (μmoles/l) | Rh (nm) | |
| 10 | 20 | 66.3±6.8 | 2 | 48±1.8 | 0.0036 | 60.9±3 |
| 25 | 32 | 71.9±4.4 | 3.4 | 99.1±6 | 0.0029 | 70.6±3 |
| 50 | 75 | 125.9± 3.2 | 16.7 | 113±2.6 | 0.0031 | 77.1±4 |
| 75 | 138 | 168.9±2.9 | 45 | 144.5±2.6 | 0.0027 | 74.7±4 |
| 100 | 257 | 172.6±1 | 90 | 151.5±5 | 0.0027 | 84.4±4 |
| 150 | -- | -- | 148 | 155.9±5 | 0.0028 | 87.0±3 |
Rh measurements were done with the dynamic laser light scattering equipment in10 mM Na cacodylate buffer (pH 7.4), containing 0, 15, 40, 65, 90, and 140 mM NaCl to make up the Na+ concentration. ± indicates SD from 4–6 experiments. Standard deviations in EC50 values were less than 10%.
Effect of Salt Concentration
We next examined the effect of increasing ionic strength of the medium on the ability of Lys4, Lys5, and PLL to condense λ-DNA. The [Na+] of 10 mM Na cacodylate buffer was increased in stages up to 150 mM by the addition of predetermined aliquots of 1 M NaCl that took into account the original 10 mM [Na+] in the buffer. At each ionic concentration, plots of total intensity of scattered light against lysine concentrations were generated, similar to Figure 1. From these plots, EC50 values were determined. Figure 2 shows the influence of [Na+] on the effectiveness of lysines in condensing λ-DNA. In these plots of log[EC50] against log[Na+], the critical concentrations of Lys4 and Lys5 increased linearly with [Na+]. The slope of the plot, (dlog[EC50]/dlog[Na+]) is a quantitative measure of the concentration dependence between multivalent and monovalent cations during λ-DNA condensation. The slopes obtained from the plot were 1.09 and 1.7 for Lys4 and Lys5, respectively. In contrast, a slightly negative slope (− 0.1) was obtained for PLL, pointing to a minimal of change in EC50 values with increasing [Na+].
Figure 2.
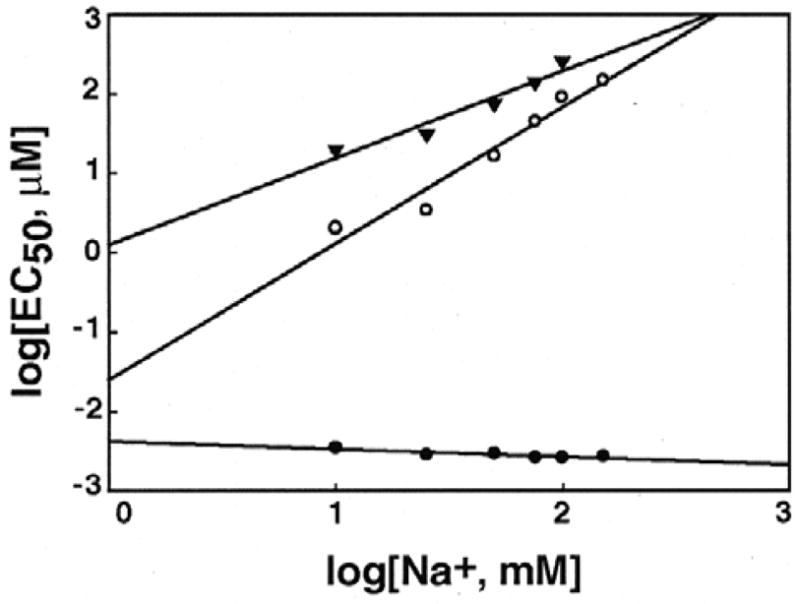
Effect of Na+ concentration on the midpoint condensing concentration (EC50) of Lys4, Lys5 and poly-L-lysine. The log of EC50 (μmoles/liter) is plotted against log of [Na+] (mM). The symbols represent EC50 values of Lys4 (▾), Lys5 (○), and poly-L-lysine (●). Error bars are of a magnitude to be contained within the symbols, and indicate standard deviation from 3 separate experiments.
Measurement of Hydrodynamic Radius of Condensed Particles
In the next series of experiments, we determined the hydrodynamic radius (Rh) of λ-DNA nanoparticles formed in the presence of oligolysines and PLL, using dynamic laser light scattering equipment. Lysine concentrations at which λ-DNA achieved complete condensation, as established by the plateau region in the light scattering profile, were used in these experiments. Rh values were initially determined using 10 mM Na cacodylate buffer. The size of the DNA nanoparticles was 66.3 ± 6.8 nm, 48.0 ± 1.8 nm, and 60.9 ± 2.7 nm, respectively, in the presence of Lys4, Lys5, and PLL (Table 1).
To determine the effect of increasing monovalent ion concentration on particle size, [Na+] of the buffer was gradually increased from 10 to 150 mM by the addition of required volumes of 1 M NaCl. Table 1 shows the change in Rh values of nanoparticles formed with oligolysines and PLL in the presence of increasing concentrations of [Na+]. DNA nanoparticles formed with Lys4 increased in size from 66.3 nm to 173 nm, as the monovalent ion concentration increased from 10 to 100 mM. At 150 mM Na+, Lys4 was unable to condense λ-DNA, as evidenced by its failure to increase the scattered light intensity even up to a concentration of 1 mM. The Rh value of DNA nanoparticles condensed with Lys5 increased from 48 nm to 156 nm, when [Na+] was increased from 10 to 150 mM. In the case of PLL, however, the particle size showed only a modest increase, from 61 to 87 nm when [Na+] increased from 10 mM to 150 mM. Overall, Lys4 produced larger particles than those produced by Lys5 at ≥ 50 mM Na+. Lys5 and PLL produced the smallest nanoparticles, indicating that the particle size decreased with increasing number of positive charges on the oligo-/polylysines.
Temperature Effect on Particle Size
We next studied the effect of increasing temperature (20 – 80 °C) on the size of DNA nanoparticles formed in the presence of Lys4, Lys5 and PLL in cacodylate buffer containing 100 mM Na+. The results are shown in Figure 3. The average size of nanoparticles formed with PLL increased slightly around 30 °C (Rh ~ 98 nm) and remained almost constant from 30 – 60 °C. Starting at 70 °C, we observed a small decrease (~15–25 nm) in the Rh of these particles. In contrast, a sharp increase in the size of Lys5 nanoparticles was observed at 50 °C, with Rh value almost tripling in magnitude (Rh ~ 436 nm). The Rh values of Lys4 condensed particles remained the same from 20 to 37 °C. However, they became unstable at higher temperatures (≥ 40 °C), precluding any further measurement of Rh.
Figure 3.
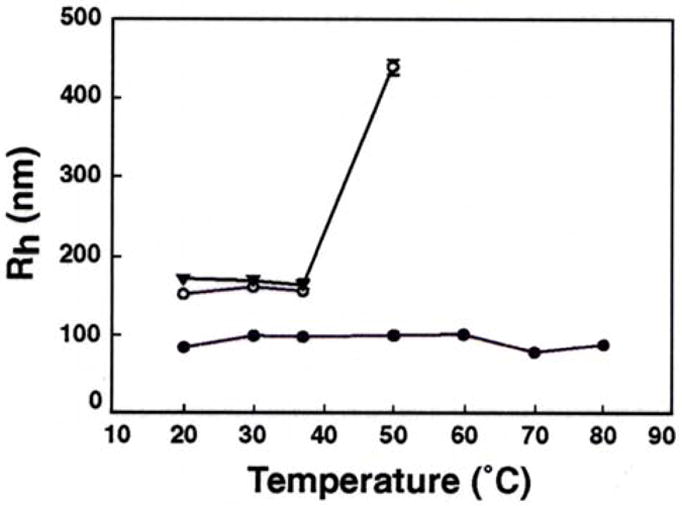
Effect of temperature on hydrodynamic radius (Rh) of λ-DNA nanoparticles. The symbols represent mean Rh values of nanoparticles produced in 100 mM Na cacodylate buffer in the presence of Lys4 (▼), Lys5 (○), and poly-L-lysine (●). Error bars indicate standard deviation from 4–6 separate experiments and are generally of a magnitude to be contained within the symbol.
Determination of Nanoparticle Size and Shape by Electron Microscopy (EM)
In the next set of experiments, we examined the shape of the nanoparticles formed by the interaction of oligolysines and PLL with λ-DNA. Electron microscopic examination of Lys5 and PLL condensed DNA complexes at different salt concentrations (10, 50 and 100 mM) revealed the presence of nanoparticles of different sizes and shapes. The structures of DNA nanoparticles formed by the binding of Lys5 are shown in Figure 4 (A-E), whereas PLL-containing particles are depicted in panels (F-I). DNA condensates appeared predominantly as toroids and spheroids, but occasionally rods were also observed. In some cases, particle sizes determined by EM were smaller than those obtained by dynamic light scattering method. The smaller sizes can be attributed to drying artifacts during the deposition of the condensates on the EM grid.
Figure 4.
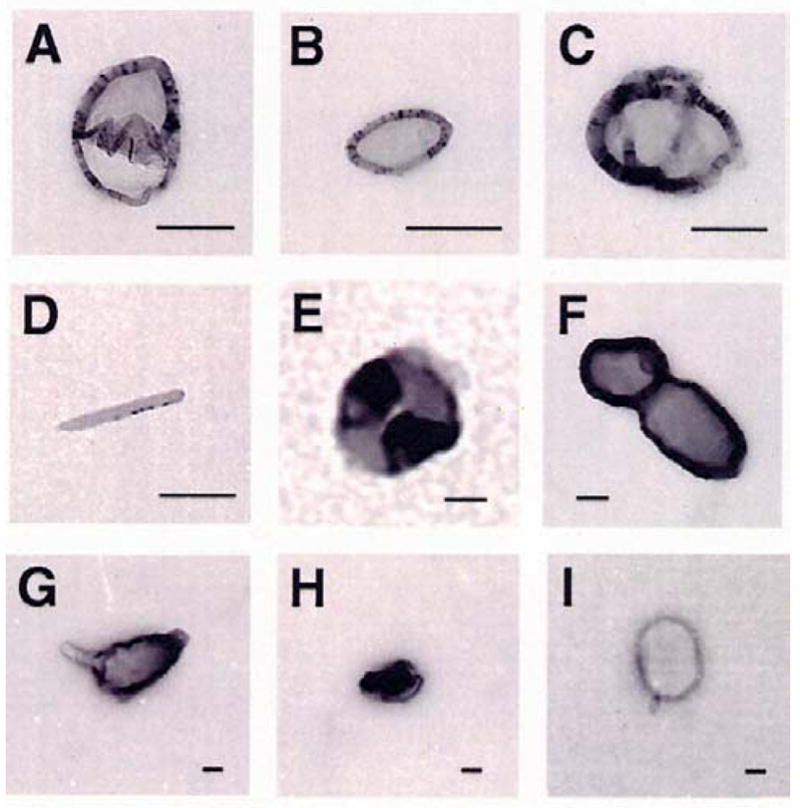
Representative electron micrographs of λ-DNA nanoparticles produced by Lys5, and poly-L-lysine. Experiments were conducted in Na cacodylate buffer, containing different concentrations of NaCl. A and B, Lys5 induced particles in 50 mM [Na+]; C, Lys5 in 10 mM [Na+]; D and E, Lys5 in 100 mM [Na+]; F, poly-L-lysine in 10 mM [Na+]; G and H, poly-L-lysine in 50 mM [Na+]; and I, poly-L-lysine in 100 mM [Na+]. It should be noted that the intense darkness of the micrographs is due to uranyl acetate staining. The bars in all panels (A-I) represent 100 nm.
Precipitation Studies of λ-DNA in the Presence of Oligo- and Poly-L-lysine
This set of experiments was designed to determine and compare the effect of Lys4, Lys5, and PLL on the precipitation of λ-DNA. In agreement with experiments conducted to determine the effect of temperature on particle size, the present experiments were also performed in 100 mM Na cacodylate buffer. We conducted the precipitation experiments using samples incubated for 30 minutes at 22, 50, and 70 °C.
Lys5 caused significant aggregation of λ-DNA, as shown in the Figure 5A. At low Lys5 concentration (0–100 μM), the precipitation curve showed only a small decrease, with > 88% of DNA remaining in solution at 100 μM. At 150 μM, Lys5 caused DNA precipitation at all temperatures, as evidenced by a sharp decline of the precipitation curves. Over 90% of DNA was in aggregated form at Lys5 concentrations ranging from 200 – 500 μM. In contrast, Lys4 failed to induce λ-DNA precipitation at either 22, 50, or 70 °C. Reducing DNA concentration from 0.1 to 0.05 A260nm units did not have any noticeable effect on Lys4’s inability to stimulate DNA aggregation.
Figure 5.
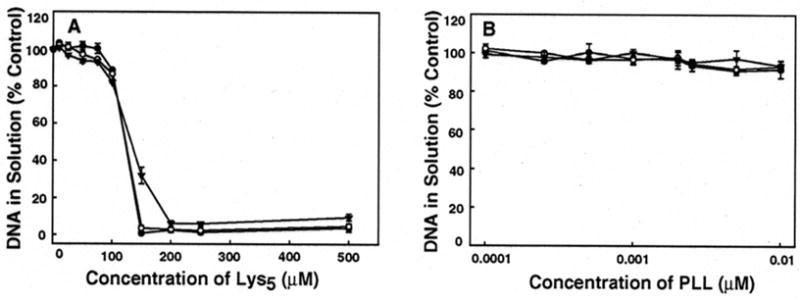
Precipitation/aggregation of λ-DNA in the presence of (A) Lys5 and (B) PLL, observed at room temperature (●), 50 °C (○), and 70 °C (▼). All experiments were conducted in 100 mM Na cacodylate buffer (pH 7.4). A logarithmic scale is used for PLL concentrations in panel B. Error bars represent standard deviation from 3 separate experiments. The DNA concentration used in these experiments was 0.1 A260nm units.
PLL induced minimal DNA precipitation (≤ 9%) across a wide range of concentrations employed in this study at all experimental temperatures (Figure 5B). A slight trend towards increased precipitation with greater PLL concentration can be observed at concentrations > 0.001 μM.
Tm measurements of DNA complexed with Oligo- and Poly-L-lysine
In order to examine whether the ability of oligo-/poly-L-lysines to condense λ-DNA correlated with their ability to increase the stability of DNA duplex, we determined Tm values of λ-DNA in the presence of increasing concentrations of Lys3, Lys4, Lys5 and PLL. Figure 6 shows representative absorbance-temperature profiles of λ-DNA in the presence of different concentrations of Lys5. The dissociation of the duplex to single strands was seen as an increase in the absorbance at 260 nm, as the temperature increased from 40 to 95 °C. In the absence of lysines, λ-DNA melted at 71 °C in a buffer containing 10 mM Na cacodylate. The presence of Lys5 shifted the melting profile to the right, indicating an increase in the Tm in a concentration-dependent manner.
Figure 6.
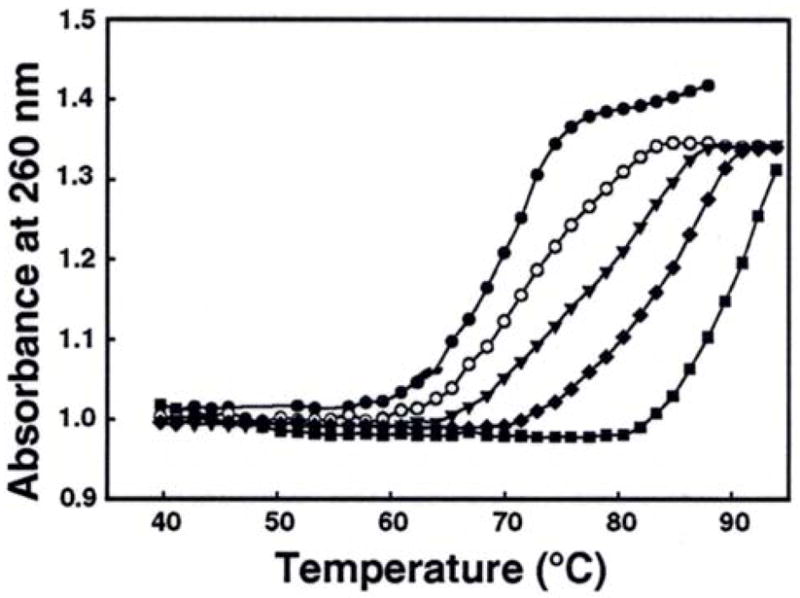
Typical melting profiles of λ-DNA in the presence of Lys5. The concentrations of Lys5 were: 0 (●), 1 (○), 2.5 (▼), 5 (◆), and 10 (■) μM. The Tm measurements were conducted in 10 mM Na cacodylate buffer at a heating rate of 0.5 °C/minute.
The results of our Tm measurements with all 3 oligolysines and PLL are presented in Table 2. A concentration-dependent increase in Tm was observed for all 3 oligolysines. For the same concentration, Lys5 had a much higher duplex stabilizing effect than Lys4 and Lys3. For example, ΔTm (Tm(in the presence of lysine)-Tm(in the absence of lysine)) with 10 μM Lys5 was 18.1 °C, compared to that of 12.8 °C and 12.7 °C, respectively, for Lys3 and Lys4. The Tm of DNA showed a minor transition at ~ 71°C in the presence of different concentrations of PLL up to 0.02 μM. This is the same Tm as that of λ-DNA in buffer, and may represent the melting of uncomplexed DNA. This result suggests that λ-DNA-PLL complexes do not melt up to 95 °C, the upper limit of our temperature program.
Table 2.
Effects of Lys3, Lys4, Lys5, and poly-L-lysine on the melting Tm of λ-DNA
| Trilysine (Lys3)
|
Tetralysine (Lys4)
|
Pentalysine (Lys5)
|
|||
|---|---|---|---|---|---|
| Conc., μM | Tm,°C | Conc., μM | Tm, °C | Conc., μM | Tm, °C |
| 0 | 70.9 | 0 | 71.2 | 0 | 71.1 |
| 1 | 72.7 | 1 | 73.4 | 1 | 72.5 |
| 2.5 | 78.2 | 2.5 | 77.1 | 2.5 | 82.3 |
| 5.0 | 81.2 | 5.0 | 79.7 | 5.0 | 86.9 |
| 10 | 83.6 | 10 | 84.0 | 10 | 89.2 |
Tm measurements were done in 3 separate experiments. The values given are the mean values. The SD in Tm measurements was <1 °C. The molar concentration of poly-L-lysine was calculated, using the average molecular weight of 50,000. At concentrations higher than 0.02 μM, DNA precipitated in the presence of poly-L-lysine.
DISCUSSION
Results presented in this report show significant differences in the mechanism(s) by which oligolysines and PLL condense λ-DNA to nanoparticles. Lys4, Lys5 and PLL condensed λ-DNA to nanoparticles at very low concentrations, and the critical concentrations required to condense half the DNA in a sample decreased with increasing lysine chain length. In a plot of log[EC50] against log [Na+], EC50 values of Lys4 and Lys5 increased linearly with Na+ concentration with a positive slope. In contrast, such a plot yielded a negative slope (− 0.1) for PLL, indicating that the predominant mode of interaction of PLL with DNA might be different from that of oligolysine-DNA interactions. The hydrodynamic radii of the nanoparticles formed with oligolysines increased with [Na+] in the medium, whereas no such effect was found for nanoparticles provoked by PLL. While increasing temperature had a large effect on the size and stability of DNA nanoparticles formed in the presence of Lys4 and Lys5, temperature had only a modest effect on nanoparticles formed with PLL. In addition, Lys5 induced DNA aggregation, whereas PLL did not initiate aggregation of the condensates (Figure 5).
As can be seen from Table 1, DNA condensation by lysines is dependent on the nature of the lysine molecule. Decrease in EC50 values with increasing lysine chain length indicates that the cationicity of the condensing agent plays an important role in DNA condensation. According to the counterion condensation theory developed by Manning15 and Record et al,16 and as applied to the condensation of DNA by multivalent cations,26,31 approximately 89–90% phosphate charge neutralization is required for DNA condensation. The trend of decreasing EC50 values with increasing lysine chain length can be explained in terms of binding affinity. Generally, higher charge of a cation leads to a higher binding affinity than that of lower charge cations, thereby causing DNA to collapse at lower counterion concentrations. Therefore, PLL’s ability to condense λ-DNA at significantly lower concentration than that of Lys4 or Lys5 can be attributed to its high affinity binding to DNA. However, Lys3 was incapable of mediating DNA condensation under different conditions tested by us. The lack of Lys3-mediated λ-DNA condensation in our study is consistent with earlier observations by Wadhwa,18 who demonstrated that alkylated Lys3 could not bind to and condense DNA.
Previous studies on DNA condensation by multivalent cations have shown that trivalent cations are excellent promoters of nanoparticle formation in aqueous solution. For example, cobalt hexamine Co(NH3)63+ and spermidine3+ provoked DNA condensation, with EC50 values of 15 and 35 μM, respectively, in 1 mM Na cacodylate buffer, and the resultant nanoparticles had hydrodynamic radius of ~ 50 nm.27,31 In contrast to these trivalent cations, trilysine could not condense DNA up to 1 mM concentration. Trilysine has three ε amino groups, and an α amino group. When pH is = 7.0, the amino acid groups of lysine are considered to be 99% protonated. At our experimental pH of 7.4, each amino group of the peptide may be partially protonated, making the molecule less than tripositive, thereby contributing to its inability to condense DNA. Trilysine’s inability to promote DNA compaction may also be attributed to low charge density of the molecule resulting from the chain separation between positive charges on the ε-terminals of the lysine side-chains. However, tetralysine appears to provide the threshold for sufficient postive charges and charge density for DNA condensation. Although multivalent cation-mediated condensation of DNA has been modeled on the basis of the counterion condensation theory, ion-specific effects have been found in the case of tetravalent polyamines.26
There is no consensus regarding the size of DNA nanoparticles produced by PLL or oligolysines. Particle size often depends on the starting reactant concentrations, size of the DNA, ionic environment, mixing conditions, as well as the method of measurement. Hydrodynamic diameters of PLL-DNA condensates (λ-DNA size: ~ 48.5 kb, MW: 31.5×10⁶ Da) in our study varied from approximately 120 to 180 nm, with salt concentration ranging from 0.01 to 0.15 M. Significantly larger particles (diameter: ~ 340 nm) were obtained by Shapiro et al.32 in the course of light scattering experiments, using sonicated calf thymus DNA (MW: 5×10⁵ Da), which is smaller than the DNA used in our studies. Liu et al.33 demonstrated the formation of complexes of a significantly lower size than that obtained in our study (diameter: 15–30 nm) between PLL and plasmid DNA of a much smaller size (~5 kb) than that of λ-DNA. These complexes were formed under high salt conditions, and thought to contain 1–3 molecules of DNA. Perales et al.34 also observed the formation of very small unimolecular particles (diameter: 17 nm) composed of PLL and homogeneous plasmid DNA, under similar ionic conditions. Lower Na+ concentrations tended to produce aggregates of unimolecular condensates. Using plasmid DNA, Kwoh et al.35 found that 10 kDa and 26 kDa PLL produced similar-sized polyplexes, ~255 nm and ~238 nm in diameter, respectively, at physiological Na+, suggesting that particle size does not vary with increasing PLL chain length. However, using AFM, Wolfert et al.12 observed a clear trend toward increasing particle diameter with increasing molecular weight of PLL in the presence of plasmid DNA (approximate size 6 kb). These differences may be attributed to differences in ionic conditions and/or kinetic changes occurring after the formation of the particles.
Our Tm experiments demonstrate that λ-DNA undergoes monophasic melting transitions in the presence of Lys3, Lys4 and Lys5, and that greater duplex stabilization is achieved with increasing oligolysine chain length. Dependence of Tm with increasing cation concentration indicates that DNA stabilization is achieved by the reversible binding of these cations to DNA. Our results with oligolysines are in agreement with those of Olins et al.36 who observed similar monophasic melting of DNA in the presence of Lys4. Our inability to observe biphasic melting in the presence of PLL may be attributed to the fact that the second melting transition occurs at a temperature above 100 °C, and, therefore, cannot be measured by the instrument used in our melting studies.37 The Tm of ~71 °C might be that of uncomplexed λ-DNA. Interestingly, Lys3 stabilizes duplex DNA, but is unable to condense the same.
A novel aspect of our study is the observation that increasing salt concentration has no major effect on the ability of PLL to condense DNA, and on the size of the resultant nanoparticles. We found that increasing salt concentration (0.010 to 0.15 M Na+) caused significant increase in the amount of Lys4 and Lys5 required for λ-DNA condensation, but had a minimal impact on the critical condensing concentration of PLL. Similarly, increase in Na+ caused only a small increase in the size of PLL nanoparticles, while producing a large increase in the size of DNA condensates produced in the presence of oligolysines. Na+ concentration was not raised above 0.15 M as our aim was to compare PLL and oligolysines at physiologically compatible salt conditions.
The linear positive slope obtained with oligolysines suggests that electrostatic interactions are the main force involved in oligopeptide-mediated DNA condensation.15,16,26 The driving force for oligolysine binding to DNA results from a net gain in entropy that occurs when DNA-bound Na+ are released into solution. When Na+ concentration of the medium is increased, the net gain in entropy from the release of Na+ decreases, and, therefore, a higher concentration of oligolysines is required to compete with Na+ and induce DNA condensation.3 Since a positive slope was not observed, which would be expected in the case of electrostatic mode of interaction between multivalent ions and DNA, we believe that PLL-DNA interaction is complicated by other factors.
Significant differences were also observed on the effect of temperature on hydrodynamic radius of DNA nanoparticles. While an increase in temperature favored the assembly of oligolysine condensed particles, with sizes tripling in magnitude at ≥ 50°C, size of PLL condensed particles remained relatively similar, suggesting that temperature-induced aggregation of DNA is prevented by PLL. These results can be attributed to the irreversible binding of PLL to DNA, in contrast to the reversibly bound oligolysines, which are easily replaced by increasing salt concentration.
Our precipitation/aggregation studies demonstrate Lys5’s ability to induce almost complete λ-DNA precipitation (≥ 91%) at 22, 50, and 70°C, at oligolysine concentrations higher than those required for condensation. The shape of the aggregation curve obtained with Lys5 is similar to those obtained with polyamines and polyamine analogs used by Saminathan et.al.29 This result is in agreement with our temperature studies, where a large increase in the size of Lys5-containing particles at ≥ 50 °C suggests a tendency toward aggregation of the nanoparticles. Lys4’s failure to stimulate DNA aggregation at high temperatures is also consistent with the results of our temperature studies that show this oligolysine’s inability to form discrete particles at temperatures > 37 °C. Lys4’s behavior may be attributed to its relatively low DNA binding affinity, which can lead to easy displacement of the oligolysine from its complexes with DNA by monovalent ions at high temperatures. We also demonstrated that PLL causes very little λ-DNA aggregation (≤ 9%) at temperatures up to 70 °C. Our results agree with the findings of other studies that demonstrated that PLL-DNA particles are resistant to precipitation at low DNA concentration in aqueous solutions in the presence of little or no salt.38–40 However, these and other studies reported that at high salt and DNA concentrations, PLL-containing particles tended to aggregate.
Taken together, our results indicate that the mode of binding of PLL to DNA is different from that of the binding of oligolysines and other small multivalent cations, such as polyamines and cobalt hexamine.1,26–28,31,41–45 Studies on DNA interactions of polyamines and H1 histone proteins suggest their preferential binding to the minor groove, the area of highest charge density in DNA.46–50 We, therefore, suggest that while the oligolysine molecule can wrap and bind DNA through its minor groove, DNA may wrap around the PLL as a string around a spool. The latter mode of binding is similar to that of DNA–dendronized polymer interaction, in which DNA wraps around the polymer and the calculated pitch decreases with increase in charge density of the polymer.51 Alternatively, it is conceivable that PLL and DNA undergoes coacervation, so that in the coacervation region, precipitation is prevented.52–54 Coacervation is a spontaneous process that occurs in aqueous solutions of oppositely charged polyelectolytes and involves a spontaneous liquid-liquid phase separation. Coacervation region is centered around the charge neutrality, dependent on charge neutrality and complex size. However, smaller complexes cannot coacervate even if their charges are neutralized. Therefore, PLL/DNA complexes have greater chances of forming coacervate regions. Molecular mechanical calculation suggests that DNA undergoes different modes of binding, depending on the nature of the multivalent cations.50,55 Based on our results and the above considerations, we propose a schematic model for the binding of oligolysines and PLL to DNA (Figure 7). This model is supported by our results on temperature effects on nanoparticles as well as our DNA precipitation/aggregation experiments (Figures 3 and 5).
Figure 7.
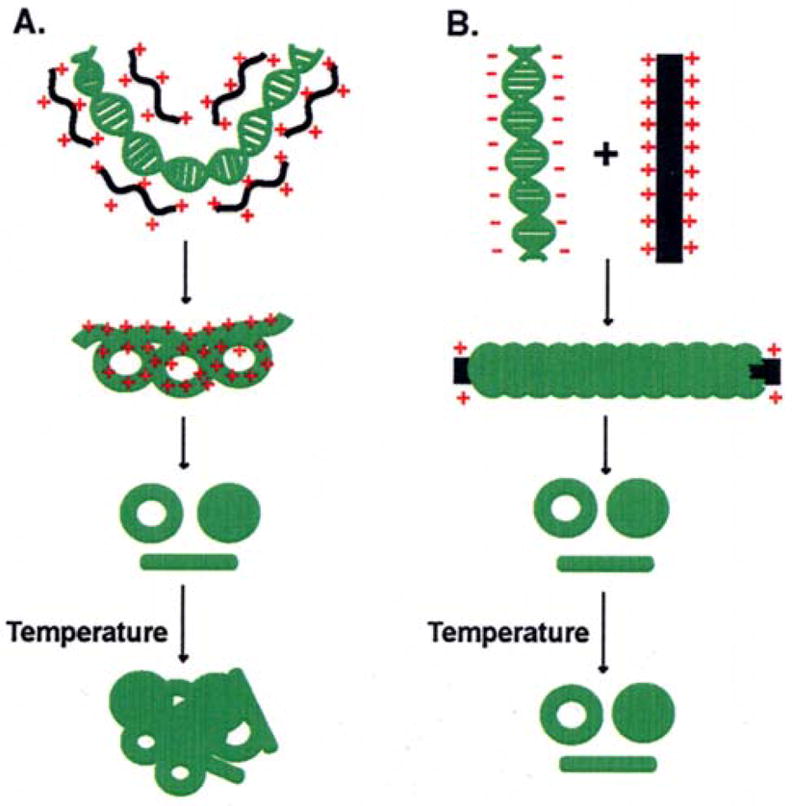
Schematic representation of 2 different mechanisms in the condensation of λ-DNA by: (A) oligolysines and (B) poly-L-lysine. In A, oligolysines are assumed to bind with DNA by electrostatic forces, leading to the collapse of DNA to nanoparticles. When these particles are heated, oligolysines partially dissociate from DNA, leading to partial melting of DNA and cross-linking of different DNA molecules to aggregates. In B, DNA is modeled to wrap around poly-L-lysine. The wrapped particles are protected from heat-induced denaturation and cross-linking.
In summary, our results show that both oligolysines and PLL are good DNA condensing agents, and that condensation efficiency increases with greater lysine chain length. The ability of PLL to condense DNA and the size of the resulting nanoparticles are relatively insensitive to salt concentration and increase in temperature. In contrast, oligolysines’ ability to condense DNA and the size of the polyplex shows a strong dependence on monovalent ion concentration of the medium. These results might contribute to the development of nonviral gene delivery vehicles because characterization of nanoparticle formation, their stability, and other properties are important in gene therapy.
Acknowledgments
We wish to express our sincere thanks to Dr. Veena Vijayanathan for her help in different stages of conducting the experiments and in preparing this manuscript.
Footnotes
This work was supported by NIH grants CA80163, CA80163-S1, CA73058, and CA42439.
References
- 1.Vijayanathan V, Thomas T, Thomas TJ. Biochemistry. 2002;41:14085. doi: 10.1021/bi0203987. [DOI] [PubMed] [Google Scholar]
- 2.Bloomfield VA. Curr Opin Struct Biol. 1996;6:334. doi: 10.1016/s0959-440x(96)80052-2. [DOI] [PubMed] [Google Scholar]
- 3.Hud NV, Vilfan ID. Annu Rev Biophys Biomol Struct. 2005;34:295. doi: 10.1146/annurev.biophys.34.040204.144500. [DOI] [PubMed] [Google Scholar]
- 4.Gosule LC, Schellman JA. J Mol Biol. 1978;121:311. doi: 10.1016/0022-2836(78)90366-2. [DOI] [PubMed] [Google Scholar]
- 5.Widom J, Baldwin RL. J Mol Biol. 1980;144:431. doi: 10.1016/0022-2836(80)90330-7. [DOI] [PubMed] [Google Scholar]
- 6.Thomas TJ, Bloomfield VA. Biochemistry. 1985;24:713. doi: 10.1021/bi00324a026. [DOI] [PubMed] [Google Scholar]
- 7.Hud NV, Downing KH. Proc Natl Acad Sci U S A. 2001;98:14925. doi: 10.1073/pnas.261560398. [DOI] [PMC free article] [PubMed] [Google Scholar]
- 8.Saminathan M, Thomas T, Shirahata A, Pillai CKS, Thomas TJ. Nucleic Acids Res. 2002;30:3722. doi: 10.1093/nar/gkf503. [DOI] [PMC free article] [PubMed] [Google Scholar]
- 9.Lohman TM, deHaseth PL, Record MT. Biochemistry. 1980;19:3522. doi: 10.1021/bi00556a017. [DOI] [PubMed] [Google Scholar]
- 10.Leng M, Felsenfeld G. Proc Natl Acad Sci U S A. 1966;56:1325. doi: 10.1073/pnas.56.4.1325. [DOI] [PMC free article] [PubMed] [Google Scholar]
- 11.Tang MX, Li W, Szoka FC., Jr J Gene Med. 2005;7:334. doi: 10.1002/jgm.664. [DOI] [PubMed] [Google Scholar]
- 12.Wolfert MA, Seymour LW. Gene Ther. 1996;3:269. [PubMed] [Google Scholar]
- 13.Guping Y, Guping T. Yanjie Drug Deliv. 2005;12:89. doi: 10.1080/10717540490446099. [DOI] [PubMed] [Google Scholar]
- 14.Matthews C, Jenkins G, Hilfinger J, Davidson B. Gene Ther. 1999;6:1558. doi: 10.1038/sj.gt.3300978. [DOI] [PubMed] [Google Scholar]
- 15.Manning GS. Q Rev Biophys. 1978;11:179. doi: 10.1017/s0033583500002031. [DOI] [PubMed] [Google Scholar]
- 16.Record MT, Jr, Anderson CF, Lohman TM. Q Rev Biophys. 1978;11:103. doi: 10.1017/s003358350000202x. [DOI] [PubMed] [Google Scholar]
- 17.Pannier AK, Shea LD. Mol Ther. 2004;10:19. doi: 10.1016/j.ymthe.2004.03.020. [DOI] [PubMed] [Google Scholar]
- 18.Wadhwa MS, Collard WT, Adami RC, McKenzie DL, Rice KG. Bioconjug Chem. 1997;8:81. doi: 10.1021/bc960079q. [DOI] [PubMed] [Google Scholar]
- 19.Kim SW. Adv Genet. 2005;53PA:263. doi: 10.1016/S0065-2660(05)53010-4. [DOI] [PubMed] [Google Scholar]
- 20.Park S, Healy KE. J Control Release. 2004;95:639. doi: 10.1016/j.jconrel.2003.12.002. [DOI] [PubMed] [Google Scholar]
- 21.Arscott PG, Li AZ, Bloomfield VA. Biopolymers. 1990;30:619. doi: 10.1002/bip.360300514. [DOI] [PubMed] [Google Scholar]
- 22.Petersen H, Kunath K, Martin AL, Stolnik S, Roberts CJ, Davies MC, Kissel T. Biomacromolecules. 2002;3:926. doi: 10.1021/bm025539z. [DOI] [PubMed] [Google Scholar]
- 23.Vijayanathan V, Thomas T, Antony T, Shirahata A, Thomas TJ. Nucleic Acids Res. 2004;32:127. doi: 10.1093/nar/gkg936. [DOI] [PMC free article] [PubMed] [Google Scholar]
- 24.Hansma HG. Annu Rev Phys Chem. 2001;52:71. doi: 10.1146/annurev.physchem.52.1.71. [DOI] [PubMed] [Google Scholar]
- 25.Molas M, Bartrons R, Perales JC. Biochim Biophys Acta. 2002;1572:37. doi: 10.1016/s0304-4165(02)00276-3. [DOI] [PubMed] [Google Scholar]
- 26.Vijayanathan V, Thomas T, Shirahata A, Thomas TJ. Biochemistry. 2001;40:13644. doi: 10.1021/bi010993t. [DOI] [PubMed] [Google Scholar]
- 27.Thomas TJ, Bloomfield VA. Biopolymers. 1985;24:2185. doi: 10.1002/bip.360241203. [DOI] [PubMed] [Google Scholar]
- 28.Vijayanathan V, Lyall J, Thomas T, Shirahata A, Thomas TJ. Biomacromolecules. 2005;6:1097. doi: 10.1021/bm0493234. [DOI] [PubMed] [Google Scholar]
- 29.Saminathan M, Antony T, Shirahata A, Sigal LH, Thomas T, Thomas TJ. Biochemistry. 1999;38:3821. doi: 10.1021/bi9825753. [DOI] [PubMed] [Google Scholar]
- 30.Thomas T, Thomas TJ. Biochemistry. 1993;32:14068. doi: 10.1021/bi00213a041. [DOI] [PubMed] [Google Scholar]
- 31.Thomas TJ, Bloomfield VA. Biopolymers. 1983;22:1097. doi: 10.1002/bip.360220407. [DOI] [PubMed] [Google Scholar]
- 32.Shapiro JT, Leng M, Felsenfeld G. Biochemistry. 1969;8:3119. doi: 10.1021/bi00836a014. [DOI] [PubMed] [Google Scholar]
- 33.Liu G, Molas M, Grossmann GA, Pasumarthy M, Perales JC, Cooper MJ, Hanson RW. Biol Chem. 2001;276:34379. doi: 10.1074/jbc.M105250200. [DOI] [PubMed] [Google Scholar]
- 34.Perales JC, Grossmann GA, Molas M, Liu G, Ferkol T, Harpst J, Oda H, Hanson RW. J Biol Chem. 1997;272:7398. doi: 10.1074/jbc.272.11.7398. [DOI] [PubMed] [Google Scholar]
- 35.Kwoh DY, Coffin CC, Lollo CP, Jovenal J, Banaszczyk MG, Mullen P, Phillips A, Amini A, Fabrycki J, Bartholomew RM, Brostoff SW, Carlo DJ. Biochim Biophys Acta. 1999;1444:171. doi: 10.1016/s0167-4781(98)00274-7. [DOI] [PubMed] [Google Scholar]
- 36.Olins DE, Olins AL, von Hippel PH. J Mol Biol. 1968;33:265. doi: 10.1016/0022-2836(68)90293-3. [DOI] [PubMed] [Google Scholar]
- 37.Liquier J, Pinot-Lafaix M, Taillandier E, Brahms J. Biochemistry. 1975;14:4191. doi: 10.1021/bi00690a007. [DOI] [PubMed] [Google Scholar]
- 38.Tang MX, Szoka FC. Gene Ther. 1997;4:823. doi: 10.1038/sj.gt.3300454. [DOI] [PubMed] [Google Scholar]
- 39.Wolfert MA, Seymour LW. Gene Ther. 1996;3:269. [PubMed] [Google Scholar]
- 40.Plank C, Tang MX, Wolfe AR, Szoka FC. Hum Gene Ther. 1999;10:319. doi: 10.1089/10430349950019101. [DOI] [PubMed] [Google Scholar]
- 41.Schurr JM, Fujimoto BS. Biophys Chem. 2002;101–102:425. doi: 10.1016/s0301-4622(02)00178-3. [DOI] [PubMed] [Google Scholar]
- 42.Bai Y, Das R, Millett IS, Herschlag D, Doniach S. Proc Natl Acad Sci U S A. 2005;102:1035. doi: 10.1073/pnas.0404448102. [DOI] [PMC free article] [PubMed] [Google Scholar]
- 43.Matulis D, Rouzina I, Bloomfield VA. J Am Chem Soc. 2002;124:7331. doi: 10.1021/ja0124055. [DOI] [PubMed] [Google Scholar]
- 44.Saminathan M, Antony T, Shirahata A, Sigal LH, Thomas T, Thomas TJ. Biochemistry. 1999;38:3821. doi: 10.1021/bi9825753. [DOI] [PubMed] [Google Scholar]
- 45.Bloomfield VA. Biopolymers. 1991;31:1471. doi: 10.1002/bip.360311305. [DOI] [PubMed] [Google Scholar]
- 46.Roque A, Orrego M, Ponte I, Suau P. Nucleic Acids Res. 2004;32:6111. doi: 10.1093/nar/gkh945. [DOI] [PMC free article] [PubMed] [Google Scholar]
- 47.Hendrickson FM, Cole RD. Biochemistry. 1994;33:2997. doi: 10.1021/bi00176a032. [DOI] [PubMed] [Google Scholar]
- 48.Sponar J, Votavova HJ. Biomol Struct Dyn. 1996;13:979. doi: 10.1080/07391102.1996.10508912. [DOI] [PubMed] [Google Scholar]
- 49.Schmid N, Behr JP. Biochemistry. 1991;30:4357. doi: 10.1021/bi00231a035. [DOI] [PubMed] [Google Scholar]
- 50.Korolev N, Lyubartsev AP, Laaksonen A, Nordenskiold L. Nucleic Acids Res. 2003;31:5971. doi: 10.1093/nar/gkg802. [DOI] [PMC free article] [PubMed] [Google Scholar]
- 51.Gossl I, Shu L, Schluter AD, Rabe JP. J Am Chem Soc. 2002;124:6860. doi: 10.1021/ja017828l. [DOI] [PubMed] [Google Scholar]
- 52.Kaibara K, Okazaki T, Bohidar HB, Dubin PL. Biomacromolecules. 2000;1:100. doi: 10.1021/bm990006k. [DOI] [PubMed] [Google Scholar]
- 53.Seyrek E, Dubin PL, Tribet C, Gamble EA. Biomacromolecules. 2003;4:273. doi: 10.1021/bm025664a. [DOI] [PubMed] [Google Scholar]
- 54.Yoshida K, Sokhakian S, Dubin PL. J Colloid Interface Sci. 1998;205:257. doi: 10.1006/jcis.1998.5618. [DOI] [PubMed] [Google Scholar]
- 55.Feuerstein BG, Pattabiraman N, Marton LJ. Nucleic Acids Res. 1990;18:1271. doi: 10.1093/nar/18.5.1271. [DOI] [PMC free article] [PubMed] [Google Scholar]