

Abstract
OBJECTIVES
The purpose of this work was to describe risk profiles for metabolic syndrome during adolescence and identify the childhood antecedents for these profiles among a nonclinical sample of non-Hispanic, white girls.
METHODS
Participants were part of a longitudinal study (n = 154) and were assessed at 5, 7, 9, 11, and 13 years of age. At 13 years, girls were grouped based on values for the 6 metabolic syndrome factors (blood pressure, high-density lipoprotein, triglycerides, waist circumference, and blood glucose) using a mixture model approach. Fat mass was measured by dual-energy radiograph absorptiometry. Dietary intake was assessed by a 24-hour recall. Mothers reported family demographics and disease history. Girls’ physical activity, sedentary behaviors, and fitness levels were also assessed.
RESULTS
Statistical support was strongest for a 4-group solution: (1) lower metabolic syndrome risk (n = 62), (2) lower dyslipidemia risk (n = 36), (3) lower hypertension risk (n = 33), and (4) higher metabolic syndrome risk (n = 21). At 13 years, the hypertension and higher metabolic syndrome risk groups had significantly higher weight status and percentage of body fat compared with the lower metabolic syndrome and dyslipidemia risk groups. In addition, the higher metabolic syndrome and hypertension risk groups had greater increases in both BMI and fat mass across childhood. The hypertension and higher metabolic syndrome risk groups had significantly more family history of type 2 diabetes and obesity. The higher metabolic syndrome risk group consumed significantly more servings of sweetened beverages during childhood. The dyslipidemia risk group had the lowest physical activity participation during childhood, and the lower metabolic syndrome risk group had the highest fitness levels at age 13 years.
CONCLUSIONS
A risk typology consisting of 4 groups was identified based on the components of metabolic syndrome. Findings on the antecedents of this risk typology suggest ways to identify those at higher risk for chronic disease and point to potential opportunities for intervention during childhood to prevent the development of metabolic syndrome.
Keywords: metabolic syndrome, risk profile, adolescents, girls, overweight
AMONG US ADULTS, the prevalence of metabolic syndrome ([MetS] defined as the clustering of dyslip-idemia, hypertension, insulin resistance, and abdominal obesity by the Adult Treatment Panel III1) has risen from ∼24% in 1988-1994 to 27% in 1999-2000.2 Because the rates of obesity, insulin resistance, and cardiovascular disease (CVD) are rising in child and adolescent populations,3-6 research has begun to examine the presence of MetS among these younger groups, as well.7-11 In US adolescents (12- to 19-years-of-age), the prevalence of MetS is estimated to be ∼6%12; yet, there are few data on this issue, because children and adolescents are not routinely screened for MetS. In addition, the definition and criteria for MetS in adolescents are currently based on a modification of the Adult Treatment Panel III definition, because age-appropriate definitions are still under investigation.13 However, because adolescence is characterized by accelerated growth and metabolic alterations, the development of MetS during adolescence may differ from the development during adulthood.9 Thus, additional research on MetS risk in this age group is warranted.
Despite widespread use of MetS as a construct in both research and clinical practice, there is still considerable debate about its definition and ultimate use. In the literature on MetS among adults, multiple definitions exist with different indicators and cutoffs.2,3,14,15 In addition, Kahn et al16 have questioned whether describing a syndrome adds to the understanding of the etiology and consequences of certain CVD and diabetes risk factors beyond the information provided by the individual risk factors. Researchers have attempted to examine this issue using exploratory and confirmatory factor analysis to investigate whether the relevant indicators for MetS reflect 1 underlying factor or several underlying factors,17-20 but a clear consensus has not yet been reached.
To respond to the need for novel methodologic approaches for the study of MetS, the present study uses the components of MetS to examine a possible typology of risk among a nonclinical sample of non-Hispanic, white 13-year-old girls. The first aim of the present study was to use a data-driven approach to describe latent risk profiles based on the indicators of MetS. Specifically, mixture models21-23 were used to identify qualitatively distinct subpopulations within the sample based on values for abdominal obesity, high-density lipoproteins (HDLs), triglycerides (TGs), systolic and diastolic blood pressure, and blood glucose. The second aim was to examine the developmental, lifestyle, and family history variables associated with the different risk profiles. Across ages 5 to 13 years, developmental antecedents of the MetS risk profiles at 13 were examined, including rate of growth, dietary patterns, physical activity, demographic factors, and family history. Overall, this study aims to provide a thorough description of potential pathways leading to the emergence of MetS and disease risk among a sample of non-Hispanic, white adolescent girls.
METHODS
Participants
The sample included, at study entry, 197 five-year-old girls and their parents. Families were reassessed every 2 years (ages 7, 9, 11, and 13 years); the final assessment included 168 families. Participating girls who did not provide a blood sample at age 13 (n = 14) were not included in the final analyses; therefore, the final sample included 154 girls. Families were recruited for participation in the study using flyers and newspaper advertisements. In addition, families with age-eligible female children within a 5-county radius received mailings and follow-up telephone calls (Metromail Inc, Lombard, IL). Families were not recruited based on weight status or concern about weight. Eligibility criteria for girls’ participation at the time of recruitment included living with biological parents, absence of severe food allergies or chronic medical problems affecting food intake, and absence of dietary restrictions involving animal products.
Families were exclusively non-Hispanic, white, and the average income for the sample ranged between $50 000 and $75 000, representing the demographics of the area surrounding the study site. Parents were relatively well educated, with fathers having a mean ± SD of 14.9 ± 2.7 years of education and mothers having 14.8 ± 2.3 years. On average, parents were overweight; mothers’ mean ± SD BMI was 28.3 ± 6.7, and fathers’ mean ± SD BMI was 29.2 ± 4.4. With respect to girls’ anthropometric and physiologic characteristics at age 13, mean ± SD BMI percentile score was 62.7 ± 26.2. Twenty-seven percent (n = 43) of girls were classified as either at-risk-for-overweight or overweight (BMI percentile score: ≥85). These proportions are similar to, but slightly lower than, the 2003-2004 National Health and Nutrition Examination Survey estimates for 12- to 19 year-old non-Hispanic white girls (30.4%).24 For the total sample, the mean ± SD blood glucose value was 81.9 ± 7.8 mg/dL, for TGs was 89.7 ± 44.4 mg/dL, for HDL was 47.8 ± 11.3, for waist circumference was 79.0 ± 11.5, and for blood pressure was 118.1 ± 12.9/66.0 ± 7.4 mm Hg.
Measures
Background Information
Mothers completed a questionnaire assessing family demographic characteristics, family history of chronic diseases, and whether their daughter had been exclusively breastfed, exclusively formula fed, or fed a mix of breast milk and formula.
Weight Status and Adiposity
At each visit, mothers’, fathers’, and daughters’ height and weight measurements were taken in the laboratory and were used to calculate BMI scores (weight [kg]/height [m2]). Because girls were all the same age and gender, BMI scores, rather than BMI percentiles or z scores, were used in both the cross-sectional and longitudinal analyses, following the suggestions of Cole et al.25 Age- and gender-specific BMI percentiles were also calculated and used to determine the prevalence of overweight in girls in this sample. Based on standardized reference criteria,26 a BMI percentile score ≥ the 85th percentile was used to classify girls as at risk for overweight, and ≥ the 95th percentile was used to classify girls as overweight. Girls’ adiposity was measured at ages 9, 11, and 13 years using dual-energy radiograph absorptiometry scans. Trained nurses measured girls’ waist circumference at ages 7, 9, 11, and 13 years.
Pubertal Status
At ages 7, 9, 11, and 13 years, breast development was assessed by visual inspection by trained nurses using the Tanner rating scale.27
Blood Lipids and Glucose
Girls’ fasting blood lipid and glucose values were collected at age 13. Blood was collected via a finger prick, and samples were analyzed by the Cholestech LDX enzymatic methodology with the Lipid Profile plus Glucose cartridge (Cholestech Corp, Hayward, CA).
Dietary Intake
Three 24-hour recalls were conducted to assess girls’ dietary intake, and the Minnesota Nutrition Data System for Research version 4.06_34 (2003; Minneapolis, MN) was used to calculate nutrient intakes. At each assessment point, participants provided three 24-hour recalls within a 2- to 3-week period after their laboratory visit. The 3 recalls included 2 weekdays and 1 weekend day and were averaged to provide an assessment of typical daily consumption.
Sport Participation and Fitness
At each visit, girls completed an activity checklist that assessed organized sports participation (ie, team or structured classes) over the past year. Girls’ physical fitness was also measured at each visit using the Progressive Aerobic Cardiovascular Endurance Run.28,29
Television Viewing and Computer Time
Sedentary behaviors were assessed at each visit by girls’ reported number of hours of typical television and computer usage on both school and nonschool days. Girls’ mean television viewing and mean computer time were derived by calculating mean hours per day from reported school day and nonschool day television and computer use.
Statistical Analyses
The first aim of this study was to use the indicators of MetS to find distinct subgroups of risk profiles among this nonclinical sample of non-Hispanic, white adolescent girls. A normal mixture model (or latent profile analysis) approach was used, which assumes that the full sample is composed of a heterogeneous mix of K subpopulations, each with their own mean levels on the risk indicators.23 In the current study, the 6 indicator variables were: (1) waist circumference, (2) systolic blood pressure, (3) diastolic blood pressure, (4) HDL, (5) TGs, and (6) blood glucose. In preliminary analyses, 2 girls were extreme outliers on these indicators. Both met the criteria for MetS and 1, with a fasting glucose level of 127 mg/dL, had been diagnosed with type 2 diabetes. The second had a fasting glucose level of 158 mg/dL. Because the glucose levels for these girls were 6 and 10 SDs above the group mean, they were excluded from the mixture analysis, because they essentially represented their own clinical subgroup.
For the remaining 152 girls, the indicator variables were standardized, and MPLUS30 (Muthén & Muthén, Los Angeles, CA) was used to estimate normal mixture models (where the variables were independent within groups). For each possible number of subgroups (1, 2, 3, . . ., etc) the statistical fit was compared based on the Akaike information criteria and Bayesian information criteria.31 Multiple runs were conducted from multiple starting values to find the best-fitting models. The analyses showed that the 4-group solution presented below had the best fit. Posterior probabilities of group membership were also used to classify girls into their most likely group. The average posterior probabilities for the groups were P = .89, .83, .89, and .90, respectively.
Once risk subgroups were determined, the groups were compared on aspects of their developmental history to assess whether the subgroups differed on variables associated with MetS and obesity. Analysis of variance with a general linear model and Fisher’s least significant difference correction posthoc pairwise comparison was used to describe group differences. All of the analyses comparing dietary intake among groups were controlled for total caloric intake. χ2 analyses or Fisher’s exact tests (if cell sizes were <5) were used to determine group differences on dichotomous variables. A mixed modeling approach (PROC MIXED) was used to model the growth curves for girls’ BMI and fat mass change from age 5 to 13 years to determine associations between group membership and growth trajectories.
RESULTS
MetS Risk Subgroups
Comparisons of models’ fit to the data using successively greater numbers of classes revealed that a 4-group solution had the best fit based on information criteria.31 Table 1 presents the mean (SD) values for the MetS indicators for each of the 4 subgroups, which were labeled based on their relative values for each of the MetS indicators used for risk typology classification. As shown in Table 1, the first group, the “lower MetS risk” group, had mean values within the healthy ranges for all of the classification variables. The second group, the “HDL-TG risk” group, had relatively higher TG levels and lower HDL levels, but relatively low values for waist circumference and blood pressure. The third group was labeled the “hypertension risk” group, because they had higher blood pressure and waist circumference. The fourth group was labeled the “higher MetS risk” group, because they had the highest values for waist circumference and blood pressure and the lowest HDL value relative to all of the other groups. Mean values of this group on the 6 indicator variables came close to or met the cutoff criteria for MetS diagnosis in adolescents.13 Groups did not differ in mean blood glucose levels; means for all of the groups were well below the MetS cutoff.
TABLE 1.
Mean Values for MetS Indicators in Girls at Age 13 According to MetS Risk Group
| Variable | MetS Risk Groups, Mean (SD) |
MetS Criteria* | |||
|---|---|---|---|---|---|
| Lower MetS (n = 62) | HDL-TG (n = 36) | Hypertension (n = 33) | Higher MetS (n = 21) | ||
| Blood glucose, mg/dL | 80.5 (7.5)a | 81.7 (7.2)a | 83.3 (8.0)a | 84.0 (9.1)a | ≥110 |
| TGs, mg/dL | 62.0 (14.6)a | 120.3 (27.9)b | 71.2 (17.4)a | 147.9 (65.0)c | ≥110 |
| HDL, mg/dL | 53.5 (11.0)a | 41.6 (7.1)b | 49.4 (9.7)c | 38.9 (10.0)b | ≤40 |
| Waist circumference, cm | 73.3 (6.9)a | 77.0 (7.7)b | 83.1 (8.9)c | 91.2 (11.0)d | ≥90.7 |
| Systolic blood pressure, mmHg | 110.4 (9.7)a | 112.5 (6.8)a | 130.0 (8.3)b | 131.8 (10.9)b | ≥118† |
| Diastolic blood pressure, mmHg | 61.3 (5.3)a | 63.5 (4.0)b | 73.0 (5.6)d | 73.0 (6.1)d | ≥76† |
Different superscripts across rows indicate significant differences among MetS risk groups at P <.05 in the Fisher’s least significant difference comparison.
Criteria from the Cook et al12 adaptation of the National Cholesterol Education Program (Adult Treatment Panel III) definition for adolescents.
Ninetieth percentile for age and gender.
Cutoff Criteria for the MetS Components
In the total sample, 8 girls were classified as having MetS, defined by Cook et al13 as meeting ≥3 of the 5 age-adjusted cutoffs for values on measures of waist circumference, blood glucose, TGs, HDL, and blood pressure; 7 of these 8 girls were in the higher MetS risk group by the mixture model analysis, and the other was in the hypertension risk group. The percentages of girls who met each age-adjusted cutoff are presented in Table 2.
TABLE 2.
Percentage of Girls Meeting Criteria for Individual MetS Components
| Variable | MS Risk Group, % |
Total Sample (n = 152), % | |||
|---|---|---|---|---|---|
| Lower MetS (n = 62) | HDL-TG (n = 36) | Hypertension (n = 33) | Higher MetS (n = 21) | ||
| Blood glucose | 0 | 0 | 0 | 0 | 0 |
| TGs | 0 | 55.6 | 0 | 66.7 | 22.3 |
| HDL | 9.7 | 41.7 | 12.1 | 57.1 | 24.3 |
| Waist circumference | 0 | 2.8 | 21.2 | 47.6 | 11.8 |
| Systolic blood pressure | 21.0 | 19.4 | 90.0 | 85.7 | 44.7 |
| Diastolic blood pressure | 0 | 0 | 24.2 | 42.9 | 11.2 |
| Median No. of criteria met | 0 | 1 | 1 | 3 | 1 |
Criteria from the Cook et al12 adaptation of the National Cholesterol Education Program (Adult Treatment Panel III) definition for adolescents.
Weight Status and Adiposity
Table 3 presents the anthropometric characteristics of each subgroup at age 13 and illustrates significant differences among the MetS risk groups on BMI (F3,147 = 14.57; P < .001), BMI percentile scores (F3,147 = 8.17; P < .001), fat mass (F3,131 = 14.52; P < .001), and percentage of body fat (F3,147 = 9.32; P < .001); the higher MetS risk and hypertension risk groups were consistently higher than the HDL-TG risk and lower MetS risk groups on all of these variables. In the lower MetS risk group, only 5% had BMI percentiles greater than the 85th percentile. In the HDL-TG risk group, 25% exceeded the 85th percentile. In the hypertension risk group, 57% exceeded the 85th percentile, and 90% of the girls in the higher MetS Risk group exceeded the 85th percentile.
TABLE 3.
Mean Values for Girls’ Anthropometric Characteristics at Age 13 According to MetS Risk Group
| Variable | MS Risk Groups, Mean (SD) |
|||
|---|---|---|---|---|
| Lower MetS (n = 62) | HDL-TG (n = 36) | Hypertension (n = 33) | Higher MetS (n = 21) | |
| Height, cm | 159.5 (7.2)a | 160.8 (5.8)a,b | 162.5 (6.8)b | 162.2 (4.8)a,b |
| Weight, kg | 49.4 (6.8)a | 52.6 (8.2)a | 59.8 (11.5)b | 64.3 (15.4)b |
| BMI, kg/m m2 | 19.4 (2.0)a | 20.3 (2.8)a | 22.7 (4.4)b | 24.4 (5.7)b |
| BMI percentile score | 52.2 (22.3)a | 60.0 (25.0)a | 72.5 (24.7)b | 75.8 (26.8)b |
| Fat mass, kg | 11.8 (3.5)a | 12.8 (3.9)a | 18.3 (7.8)b | 19.6 (8.9)b |
| Body fat, % | 24.2 (4.8)a | 25.3 (4.9)a | 30.1 (7.4)b | 29.9 (7.9)b |
| Tanner staging | 3.6 (0.1)a | 3.6 (0.2)a | 3.9 (0.2)b | 4.4 (0.2)b |
Different superscripts across rows indicate significant differences among MetS risk groups at P<.05 in the Fisher’s least significant difference comparison.
Tanner staging of breast development was used as an indicator of pubertal status. There were significant differences among MetS risk groups on the level of breast development (F3,138 = 5.34; P < .01). Posthoc planned comparisons revealed that the higher MetS risk and hypertension risk groups had significantly higher scores (mean ± SD: 3.9 ± 0.2 and 4.4 ± 0.2, respectively), indicating more advanced stages of breast development than the lower MetS risk and the HDL-TG risk groups (mean ± SD: 3.6 ± 0.1 and 3.6 ± 0.1, respectively; P < .001).
Developmental Antecedents
Weight and Adiposity Change
Figures 1 and 2 illustrate differences in patterns of change from 5 to 13 years among the MetS risk groups on BMI and fat mass. At age 5, the higher MetS risk group had the highest BMI relative to all of the other groups (Fig 1; F3,148 = 3.95, P < .01). In addition, the higher MetS risk and hypertension risk groups had greater changes in BMI between ages 5 and 13 than the lower MetS risk and HDL-TG risk groups (F3,147 = 10.02; P < .001). Results were similar for changes in fat mass (Fig 2). The higher MetS risk group’s fat mass at first measurement (age 9) was significantly higher than the values for the other 3 groups (F3,143 = 7.18; P < .01). The change in fat mass between 9 and 13 years of age was significantly greater for the higher MetS risk and the hypertension risk group than fat mass change for the lower MetS risk and the HDL-TG risk groups (F3,143 = 6.51; P < .01).
FIGURE 1.
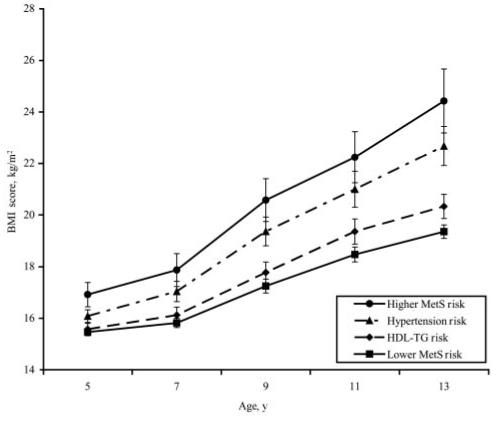
BMI change from 5 to 13 years for MetS risk groups. Plotted values are group means ± SE. Between-group differences in intercept (BMI at age 5) were significant (P < .05). The interaction of group membership with time was also significant (P < .05). The higher MetS risk group had a significantly steeper slope than the lower MetS risk and HDL-TG risk groups. The slope for BMI change in the hypertension risk group was not significantly different from the higher MetS risk group.
FIGURE 2.
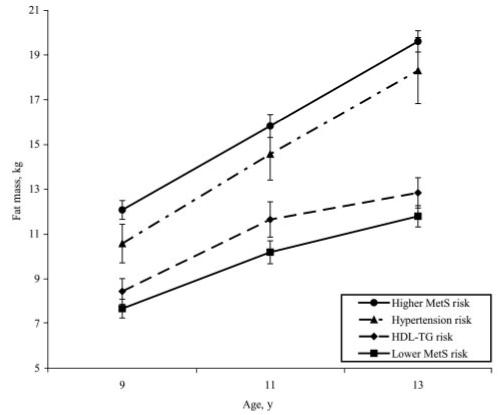
Fat mass change from 9 to 13 years for MetS risk groups. Plotted values are group means ± SE. Between-group differences in intercept (fat mass at age 9) were significant (P < .05). The interaction of group membership with time was also significant at (P < .05). The higher MetS risk group had a significantly steeper slope for fat mass change than the lower MetS risk and HDL-TG risk. The slope for fat mass change in the hypertension risk group was not significantly different from the higher MetS risk group.
Family History and Characteristics
No differences were found among groups for family history of hypercholesterolemia, hypertension, stroke, or heart attack. Family history of type 2 diabetes (F3,141 = 4.53; P < .01), obesity (F3,147 = 2.55; P = .05), and gestational diabetes (χ2 = 15.56; P < .001) differed significantly among groups. Posthoc planned comparisons revealed that the higher MetS risk and hypertension risk groups had significantly higher rates of type 2 diabetes (mean ± SD: 2.2 ± 0.3 family members for both groups) than the lower MetS risk and HDL-TG risk groups (mean ± SD: 1.3 ± 0.2 and 1.2 ± 0.2 family members, respectively). This pattern was the same for family history of obesity: the higher MetS Risk and hypertension risk groups had significantly higher prevalence of obesity (mean ± SD: 1.0 ± 0.2 and 1.2 ± 0.2 family members, respectively) than the lower MetS risk and HDL-TG risk groups (mean ± SD: 0.7 ± 0.3 and 0.5 ± 0.3 family members, respectively). In addition, family history of gestational diabetes differed across groups; mothers of girls in the HDL-TG risk (3 mothers) and higher MetS risk (4 mothers) groups were the only mothers who had reported gestational diabetes.
At study entry, girls in the lower MetS Risk group had mothers (F3,141 = 4.69; P = .01) and fathers (F3,140 = 4.99; P < .01) with higher levels of education (mothers: mean ± SD: 15.4 ± 2.4 years; fathers mean ± SD: 15.7 ± 2.6 years) than girls in the higher MetS risk group (mothers: mean ± SD: 13.6 ± 2.0 years; fathers mean ± SD: 14.1 ± 2.4 years). In addition, girls in the lower MetS risk group had mothers (F3,147 = 10.64; P < .001) and fathers (F3,144 = 3.29; P < .05) with lower BMI (mothers mean ± SD: 23.8 ± 3.6; fathers mean ± SD: 27.3 ± 4.0) than girls in the higher MetS risk group (mothers mean ± SD: 29.9 ± 7.4; fathers mean ± SD: 30.1 ± 5.1). No differences were found among the 4 MetS risk groups on family income, birth weight, or mothers’ retrospective reports of infant feeding (ie, exclusive breastfed, exclusively formula fed, or fed a mix of both) or the duration of breastfeeding.
Dietary Intake
Dietary recall data were examined for group differences in nutrient and food group intakes. The only significant difference among the 4 MetS risk groups was in sweetened beverage intake (Fig 3). A significant main effect of group membership on sweetened beverage intake was seen in the repeated-measures analysis of variance (F3,143 = 5.08; P < .01). At ages 5, 7, and 9 years, posthoc comparisons revealed that the higher MetS risk group had the highest daily sweetened beverage intake among all of the groups (P < .001); this difference over time was about one half to two thirds of a serving (and between 167.36 and 313.80 J) per day. No consistent differences among the MetS risk groups were found for intakes of any other macronutrient, micronutrient, or food group or in meal and snack frequency.
FIGURE 3.
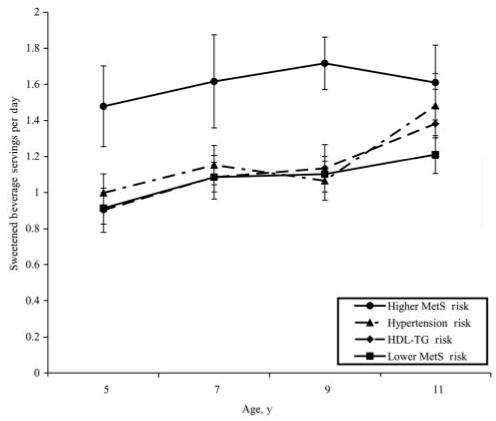
Mean servings per day of sweetened beverage from 5 to 11 years for MetS risk groups. Plotted values are group means ± SE. Lower MetS risk, HDL-TG risk, and hypertension risk were not significantly different at any age. Intake of the higher MetS risk group was significantly greater than all other groups at 5, 7, and 9 years of age (P < .001).
Sedentary Behaviors and Fitness Levels
No differences were found among groups for average television or computer time. A significant effect of group membership was noted for fitness levels at age 13 (F3,147 = 2.95; P < .05); girls in the lower MetS risk group had significantly higher fitness scores than the other 3 groups (P < .001); the HDL-TG risk, hypertension risk group, and higher MetS risk groups were not significantly different on fitness scores.
DISCUSSION
The current study provided strong statistical support for 4 distinct risk profiles among a nonclinical sample of non-Hispanic, white adolescent girls and identified developmental and familial antecedents of these MetS risk profiles. The 4 groups included: a higher MetS risk group (14% of the sample); a lower MetS risk group (41% of the sample); a HDL-TG risk group (24% of the sample); and a hypertension risk group (22% of the sample). At 13 years old, these 4 groups also differed in BMI, fat mass, pubertal development, and fitness levels. With respect to developmental antecedents, both the higher MetS risk and the hypertension risk groups had significantly greater increases in weight and fat mass from 5 to 13 years. The higher MetS risk and the hypertension risk groups also diverged from the HDL-TG risk and lower MetS risk groups in family history of obesity and type 2 diabetes. With respect to food intake and physical activity, the higher MetS risk groups had the highest sweetened beverage intakes, and lower MetS risk had the highest fitness levels. No differences were found among groups on indices of sedentary behavior, specifically television viewing and computer time.
Other research has used factor analysis to address the issue of whether MetS is a more useful conceptualization of risk compared with focusing on individual indicators.16,20,32 Cluster analysis has also been used to address this issue by looking for greater-than-chance clustering of dichotomous risk indicators.33 The present approach instead posits an underlying typology and estimates parameters associated with the latent groups. Although this mixture model analysis is similar to factor modeling in accounting for covariation among observed variables by their association with latent variables,34 there are some differences convenient for the purposes of this study. Mixture model analysis provided the opportunity to construct classes of individuals thought to differ qualitatively from one another. It was on the basis of these classifications that differences among the 4 risk groups’ developmental antecedents could then be examined and described.
Longitudinal data on development lifestyle factors provided information on several antecedents of risk classification. Changes in weight and adiposity were developmental antecedents of interest, because weight status, fat mass, and change over time for both of these variables from 5 to 13 years were strong predictors of risk group membership. This is consistent with research showing that overweight and obesity are intricately linked with the prevalence of MetS, its various components, and its consequences later in life.35-39 Before the 1990s, disease statuses, such as type 2 diabetes and CVD, were thought of as adult conditions, for which children were thought to be at very low risk. But, with the reports of dramatic increases in both CVD and type 2 diabetes in children and adolescents,3,5,6,40,41 it has become apparent that susceptibility to and development of these chronic diseases can emerge as early as adolescence. In addition, research has shown that the increased prevalence of type 2 diabetes and CVD in adolescents may be partially attributable to the dramatic increases in overweight in both children and adolescents,10 as well as to patterns of weight change during childhood.42 The present findings reveal that elevated weight status and accelerated change in weight status during middle childhood are predictors of MetS risk at age 13 and may serve as a key signal to clinicians and interventionists aimed at preventing MetS and CVD risk during early childhood.
Several aspects of girls’ families were found to differ across risk groups. Girls classified as having higher risk for MetS and the components of MetS (hypertension and dyslipidemia) were more likely to have a family history of obesity, type 2 diabetes, and gestational diabetes and to have parents who were more overweight. In addition, the lower-risk girls had parents who were more educated, although the mean educational levels of all 4 of the risk groups reflected 2 to 3 years of college education among parents. Similarities within families for the presence of MetS and for traits related to MetS have been attributed to both genetic and shared environment factors.43-46 Thus, although it seems that some girls in the present study may be genetically predisposed to the development of MetS, environmental factors, such as parent education level, were also predictive of risk status. In addition, the difference in parental weight status between the groups is suggestive of both genetic and environmental influences, because overweight parents may be a marker for less healthy parental eating and activity patterns. This supports the “obesegenic family” view,47-49 suggesting that there are certain environments created by parental behaviors that contribute to the development of overweight and comorbidities (ie, MetS) in children.
With respect to lifestyle factors, the only dietary pattern that clearly distinguished the higher-risk group from the other groups was early elevated intake of calorically sweetened beverages across ages 5 to 11 years. Relative to the low MetS risk group, at ages 5, 7, and 9 years, the higher MetS risk group consumed 27%, 45%, and 50% more sweetened beverage servings per day, respectively. This difference would result in an additional 167.36 to 313.80 J per day for the higher MetS risk group over time, which coincides with, and possibly accounts for, the greater weight and weight gain of the higher MetS risk group. For example, the consumption of an additional 50 kJ per day persisting over 4 years, assuming 50% of these additional calories are stored as fat, could result in an additional weight gain of ∼10 lb (4.5 kg) over a 4-year period. This estimation is close to the difference in weight gain between ages 5 and 9 years in the high MetS risk group (17.62 kg) and the average weight gain in the other 3 groups (14.3 kg; data not shown). The differences among the groups in their sweetened beverage consumption disappeared by age 11 because of increases in sweetened beverage intake among the other groups. This pattern suggests the possibility that consistently high intake of sweetened beverages early in life may constitute a risk factor for excessive weight gain and increased MetS risk. These findings are consistent with research examining physiologic responses to consuming high glycemic load carbohydrates (eg, sweetened beverages), which has shown that habitual consumption of these foods contributes to the development of insulin resistance, especially when these high intakes are accompanied by the consumption of higher than needed calories on a habitual basis.50 Based on these findings, it is not unreasonable to expect that girls who have been consuming higher amounts of sugar-sweetened beverages from ages 5 to 11 would have greater risk for insulin resistance or MetS. In addition, although a clear consensus on the effect of high intakes of sweetened beverages on weight change and health status has not been reached, children’s consumption of caloric drinks has been shown to predict change in BMI and overweight prevalence.51,52 Thus, epidemiologic data associating childhood sweetened beverage intakes to weight change, as well as data from the current and past studies associating childhood sweetened beverage intakes to MetS risk, suggest that this dietary factor may be an important target for early lifestyle health promotion efforts.
Recently, the definition of MetS and its clinical application have been questioned, with a charge that the label “syndrome” offers no substantive clinical use.16 The critics contend that for a syndrome to have scientific force it must have predictive use greater than that offered by the individual components, must designate a distinct underlying causal process, and must suggest a treatment strategy different from merely treating the individual risk components.16 The present study does not specifically address the clinical status of MetS. To do so, higher risk for adverse health outcomes for the higher MetS risk group would need to be established. Because this was a nonclinical sample of healthy, non-Hispanic, white 13-year-olds, the adverse health outcomes are not yet manifest. Concurrent associations between risk group membership and both higher body fat and BMI were seen, but whether this is reflective of a later morbidity remains to be tested in subsequent analyses using data from later points in development.
What this study does contribute is a novel approach to describing the clustering of the risk factors among a nonclinical sample of girls. This includes an estimate of the mean levels on the indicators associated with the subgroups of the girls in the study and a clear demonstration of developmental patterns showing consistent differences and a steady divergence from age 5 on measures of body weight and adiposity, which are associated with the clustering of the MetS risk indicators. In addition, this study was unique in that group means were estimated by the mixture modeling and not a priori considerations. Previous studies of MetS in adolescents classify individuals based on modified adult values13; in contrast, the current study allowed the data to determine profiles of MetS risk based on the commonly used indicators.
Limitations of this study include a sample that is relatively small and homogeneous in both ethnicity and gender. Because a sample of non-Hispanic white girls was examined, results cannot be generalized to other ethnicities or to boys. In addition, this study cannot currently assess future MetS risk, because data beyond age 13 have not yet been obtained. Data at future time points on the actual presence of MetS in this sample of adolescent girls are needed to assess the adequacy of the subgroups as indicators of risk and to determine whether the 3 elevated risk groups (HDL-TG, hypertension, and higher MetS) will be associated with distinctly different patterns of comorbidities later in development.
Given the strong statistical support for the model, the similarities between the higher-risk group in this model and the current conceptualization of MetS in adolescents and the various differences in the developmental precursors noted among the risk groups, this study provides support for a multifaceted disease risk trajectory during adolescence. In addition, 1 of the strengths of this study was the ability to use a rich, longitudinal data set to examine developmental antecedents of risk subtypes. This study provided evidence that family history and persistent patterns of elevated sweetened beverage intake, accelerated weight gain, and elevated fat mass accumulation during childhood were predictive of elevated risk for MetS in early adolescence. These developmental antecedents of adolescent MetS risk provide promising targets for preventive interventions.
ACKNOWLEDGMENTS
This research was supported by National Institutes of Health grants M01 RR10732 and HD32973.
We thank the families who participated in this research study and the General Clinical Research Center of the Pennsylvania State University, which provided aid and services.
Abbreviations
- MetS
metabolic syndrome
- CVD
cardiovascular disease
- HDL
high-density lipoprotein
- TG
triglyceride
Footnotes
The authors have indicated they have no financial relationships relevant to this article to disclose.
REFERENCES
- 1.National Institutes of Health . Clinical Guidelines on the Identification, Evaluation, and Treatment of Overweight and Obesity in Adults. National Institutes of Health; Bethesda, MD: 1998. [Google Scholar]
- 2.Ford ES, Giles WH, Dietz WH. Prevalence of the metabolic syndrome among US adults: findings from the third National Health and Nutrition Examination Survey. JAMA. 2002;287:356–359. doi: 10.1001/jama.287.3.356. [DOI] [PubMed] [Google Scholar]
- 3.Pinhas-Hamiel O, Dolan LM, et al. Increased incidence of noninsulin-dependent diabetes mellitus among adolescents. J Pediatr. 1996;128:608–615. doi: 10.1016/s0022-3476(96)80124-7. [DOI] [PubMed] [Google Scholar]
- 4.Ogden CL, Flegal KM, Carroll MD, Johnson CL. Prevalence and trends in overweight among US children and adolescents, 1999-2000. JAMA. 2002;288:1728–1732. doi: 10.1001/jama.288.14.1728. [DOI] [PubMed] [Google Scholar]
- 5.Berenson GS, Srinivasan SR, Bao W, Newman WP, 3rd, Tracy RE, Wattigney WA. Association between multiple cardiovascular risk factors and atherosclerosis in children and young adults. The Bogalusa Heart Study. N Engl J Med. 1998;338:1650–1656. doi: 10.1056/NEJM199806043382302. [DOI] [PubMed] [Google Scholar]
- 6.Berenson GS, Wattigney WA, Tracy RE, et al. Atherosclerosis of the aorta and coronary arteries and cardiovascular risk factors in persons aged 6 to 30 years and studied at necropsy (The Bogalusa Heart Study) Am J Cardiol. 1992;70:851–858. doi: 10.1016/0002-9149(92)90726-f. [DOI] [PubMed] [Google Scholar]
- 7.Arslanian S, Suprasongsin C. Insulin sensitivity, lipids, and body composition in childhood: is “syndrome X” present? J Clin Endocrinol Metab. 1996;81:1058–1062. doi: 10.1210/jcem.81.3.8772576. [DOI] [PubMed] [Google Scholar]
- 8.Bacha F, Saad R, Gungor N, Janosky J, Arslanian SA. Obesity, regional fat distribution, and syndrome X in obese black versus white adolescents: Race differential in diabetogenic and atherogenic risk factors. J Clin Endocrinol Metab. 2003;88:2534–2540. doi: 10.1210/jc.2002-021267. [DOI] [PubMed] [Google Scholar]
- 9.Goran MI. Metabolic precursors and effects of obesity in children: A decade of progress, 1990-1999. Am J Clin Nutr. 2001;73:158–171. doi: 10.1093/ajcn/73.2.158. [DOI] [PubMed] [Google Scholar]
- 10.Steinberger J, Daniels SR. Obesity, insulin resistance, diabetes, and cardiovascular risk in children: an American Heart Association scientific statement from the Atherosclerosis, Hypertension, and Obesity in the Young Committee (Council on Cardiovascular Disease in the Young) and the Diabetes Committee (Council on Nutrition, Physical Activity, and Metabolism) Circulation. 2003;107:1448–1453. doi: 10.1161/01.cir.0000060923.07573.f2. [DOI] [PubMed] [Google Scholar]
- 11.Weiss R, Dziura J, Burgert TS, et al. Obesity and the metabolic syndrome in children and adolescents. N Engl J Med. 2004;350:2362–2374. doi: 10.1056/NEJMoa031049. [DOI] [PubMed] [Google Scholar]
- 12.Duncan GE, Li SM, Zhou XH. Prevalence and trends of a metabolic syndrome phenotype among U.S. Adolescents, 1999-2000. Diabetes Care. 2004;27:2438–2443. doi: 10.2337/diacare.27.10.2438. [DOI] [PubMed] [Google Scholar]
- 13.Cook S, Weitzman M, Auinger P, Nguyen M, Dietz WH. Prevalence of a metabolic syndrome phenotype in adolescents: Findings from the third National Health and Nutrition Examination Survey, 1988-1994. Arch Pediatr Adolesc Med. 2003;157:821–827. doi: 10.1001/archpedi.157.8.821. [DOI] [PubMed] [Google Scholar]
- 14.National Institutes of Health . Third Report of the National Cholesterol Education Program Expert Panel on Detection, Evaluation, and Treatment of High Blood Cholesterol in Adults (Adult Treatment Panel III) National Institutes of Health; Bethesda, MD: 2001. [PubMed] [Google Scholar]
- 15.World Health Organization . Definition, Diagnosis and Classification of Diabetes Mellitus and Its Complications: Report of the WHO Consultation. World Health Organization; Geneva, Switzerland: 1999. [Google Scholar]
- 16.Kahn R, Buse J, Ferrannini E, Stern M. The metabolic syndrome: time for a critical appraisal: joint statement from the American Diabetes Association and the European Association for the Study of Diabetes. Diabetes Care. 2005;28:2289–2304. doi: 10.2337/diacare.28.9.2289. [DOI] [PubMed] [Google Scholar]
- 17.Ford ES. Factor analysis and defining the metabolic syndrome. Ethn Dis. 2003;13:429–437. [PubMed] [Google Scholar]
- 18.Lakka HM, Laaksonen DE, Lakka TA, et al. The metabolic syndrome and total and cardiovascular disease mortality in middle-aged men. JAMA. 2002;288:2709–2716. doi: 10.1001/jama.288.21.2709. [DOI] [PubMed] [Google Scholar]
- 19.Meigs JB, D’Agostino RB, Sr, Wilson PW, Cupples LA, Nathan DM, Singer DE. Risk variable clustering in the insulin resistance syndrome. The Framingham Offspring Study. Diabetes. 1997;46:1594–1600. doi: 10.2337/diacare.46.10.1594. [DOI] [PubMed] [Google Scholar]
- 20.Pladevall M, Singal B, Williams LK, et al. A single factor underlies the metabolic syndrome: A confirmatory factor analysis. Diabetes Care. 2006;29:113–122. doi: 10.2337/diacare.29.1.113. [DOI] [PubMed] [Google Scholar]
- 21.Aitkin M, Anderson D, Hinde J. Statistical modeling of teacher styles. J Royal Stat Soc. 1981;A(144):419–461. [Google Scholar]
- 22.Everitt BS, Hand DJ. Finite Mixture Distributions. Chapman and Hall; London, United Kingdom: 1981. [Google Scholar]
- 23.McLachlan GJ, Peel D. Finite Mixture Models. Wiley; New York, NY: 2000. [Google Scholar]
- 24.Ogden CL, Carroll MD, Curtin LR, McDowell MA, Tabak CJ, Flegal KM. Prevalence of overweight and obesity in the United States, 1999-2004. JAMA. 2006;295:1549–1555. doi: 10.1001/jama.295.13.1549. [DOI] [PubMed] [Google Scholar]
- 25.Cole TJ, Faith MS, Pietrobelli A, Heo M. What is the best measure of adiposity change in growing children: BMI, BMI %, BMI z-score or BMI centile? Eur J Clin Nutr. 2005;59:419–425. doi: 10.1038/sj.ejcn.1602090. [DOI] [PubMed] [Google Scholar]
- 26.Kuczmarski RJ, Flegal KM. Criteria for definition of overweight in transition: Background and recommendations for the United States. Am J Clin Nutr. 2000;72:1074–1081. doi: 10.1093/ajcn/72.5.1074. [DOI] [PubMed] [Google Scholar]
- 27.Marshall WA, Tanner JM. Variations in pattern of pubertal changes in girls. Arch Dis Child. 1969;44:291–303. doi: 10.1136/adc.44.235.291. [DOI] [PMC free article] [PubMed] [Google Scholar]
- 28.Leger LA, Lambert J. A maximal multistage 20-m shuttle run test to predict VO2max. Eur J Appl Physiol Occupat Physiol. 1982;49:1–12. doi: 10.1007/BF00428958. [DOI] [PubMed] [Google Scholar]
- 29.Leger LA, Mercier D, Gadoury C, Lambert J. The multistage 20 metre shuttle run test for aerobic fitness. J Sports Sci. 1988;6:93–101. doi: 10.1080/02640418808729800. [DOI] [PubMed] [Google Scholar]
- 30.Muthén L, Muthén B. Mplus User’s Guide. Muthén & Muthén; Los Angeles, CA: 19982003. [Google Scholar]
- 31.Schwartz G. Estimating the dimension of a model. Ann Stat. 1978;6:461–464. [Google Scholar]
- 32.Lawlor DA, Ebrahim S, May M, Davey Smith G. (Mis)use of factor analysis in the study of insulin resistance syndrome. Am J Epidemiol. 2004;159:1013–1018. doi: 10.1093/aje/kwh150. [DOI] [PubMed] [Google Scholar]
- 33.Wilson PW, Kannel WB, Silbershatz H, D’Agostino RB. Clustering of metabolic factors and coronary heart disease. Arch Intern Med. 1999;159:1104–1109. doi: 10.1001/archinte.159.10.1104. [DOI] [PubMed] [Google Scholar]
- 34.Bartholomew D, Knott M. Latent variable models and factor analysis. Oxford University Press; London, United Kingdom: 1999. [Google Scholar]
- 35.Haffner SM, Fong D, Hazuda HP, Pugh JA, Patterson JK. Hyperinsulinemia, upper body adiposity, and cardiovascular risk factors in non-diabetics. Metabolism. 1988;37:338–345. doi: 10.1016/0026-0495(88)90133-3. [DOI] [PubMed] [Google Scholar]
- 36.Boyd GS, Koenigsberg J, Falkner B, Gidding S, Hassink S. Effect of obesity and high blood pressure on plasma lipid levels in children and adolescents. Pediatrics. 2005;116:442–446. doi: 10.1542/peds.2004-1877. [DOI] [PubMed] [Google Scholar]
- 37.Han TS, Williams K, Sattar N, Hunt KJ, Lean ME, Haffner SM. Analysis of obesity and hyperinsulinemia in the development of metabolic syndrome: San Antonio Heart Study. Obes Res. 2002;10:923–931. doi: 10.1038/oby.2002.126. [DOI] [PubMed] [Google Scholar]
- 38.Liese AD, Mayer-Davis EJ, Haffner SM. Development of the multiple metabolic syndrome: an epidemiologic perspective. Epidemiol Rev. 1998;20:157–172. doi: 10.1093/oxfordjournals.epirev.a017978. [DOI] [PubMed] [Google Scholar]
- 39.Modan M, Halkin H, Almog S, et al. Hyperinsulinemia. A link between hypertension obesity and glucose intolerance. J Clin Invest. 1985;75:809–817. doi: 10.1172/JCI111776. [DOI] [PMC free article] [PubMed] [Google Scholar]
- 40.American Diabetes Association Type 2 diabetes in children and adolescents. Pediatrics. 2000;105:671–680. doi: 10.1542/peds.105.3.671. [DOI] [PubMed] [Google Scholar]
- 41.Fagot-Campagna A, Pettitt DJ, Engelgau MM, et al. Type 2 diabetes among North American children and adolescents: an epidemiologic review and a public health perspective. J Pediatr. 2000;136:664–672. doi: 10.1067/mpd.2000.105141. [DOI] [PubMed] [Google Scholar]
- 42.Bhargava SK, Sachdev HS, Fall CH, et al. Relation of serial changes in childhood body-mass index to impaired glucose tolerance in young adulthood. N Engl J Med. 2004;350:865–875. doi: 10.1056/NEJMoa035698. [DOI] [PMC free article] [PubMed] [Google Scholar]
- 43.Tang W, Hong Y, Province MA, et al. Familial clustering for features of the metabolic syndrome: the National Heart, Lung, and Blood Institute (NHLBI) Family Heart Study. Diabetes Care. 2006;29:631–636. doi: 10.2337/diacare.29.03.06.dc05-0679. [DOI] [PubMed] [Google Scholar]
- 44.Srinivasan SR, Frontini MG, Berenson GS. Longitudinal changes in risk variables of insulin resistance syndrome from childhood to young adulthood in offspring of parents with type 2 diabetes: The Bogalusa Heart Study. Metabolism. 2003;52:443–453. doi: 10.1053/meta.2003.50065. [DOI] [PubMed] [Google Scholar]
- 45.Freeman MS, Mansfield MW, Barrett JH, Grant PJ. Heritability of features of the insulin resistance syndrome in a community-based study of healthy families. Diabet Med. 2002;19:994–999. doi: 10.1046/j.1464-5491.2002.00843.x. [DOI] [PubMed] [Google Scholar]
- 46.Boney CM, Verma A, Tucker R, Vohr BR. Metabolic syndrome in childhood: association with birth weight, maternal obesity, and gestational diabetes mellitus. Pediatrics. 2005;115(3) doi: 10.1542/peds.2004-1808. Available at: www.pediatrics.org/cgi/content/full/115/3/e290. [DOI] [PubMed] [Google Scholar]
- 47.Birch LL, Davison KK. Family environmental factors influencing the developing behavioral controls of food intake and childhood overweight. Pediatr Clin North Am. 2001;48:893–907. doi: 10.1016/s0031-3955(05)70347-3. [DOI] [PubMed] [Google Scholar]
- 48.Davison KK, Birch LL. Childhood overweight: A contextual model and recommendations for future research. Obes Rev. 2001;2:159–171. doi: 10.1046/j.1467-789x.2001.00036.x. [DOI] [PMC free article] [PubMed] [Google Scholar]
- 49.Davison KK, Birch LL. Obesigenic families: parents’ physical activity and dietary intake patterns predict girls’ risk of overweight. Int J Obes Relat Metab Disord. 2002;26:1186–1193. doi: 10.1038/sj.ijo.0802071. [DOI] [PMC free article] [PubMed] [Google Scholar]
- 50.Ludwig DS. The glycemic index: Physiological mechanisms relating to obesity, diabetes, and cardiovascular disease. JAMA. 2002;287:2414–2423. doi: 10.1001/jama.287.18.2414. [DOI] [PubMed] [Google Scholar]
- 51.Ludwig DS, Peterson KE, Gortmaker SL. Relation between consumption of sugar-sweetened drinks and childhood obesity: A prospective, observational analysis. Lancet. 2001;357:505–508. doi: 10.1016/S0140-6736(00)04041-1. [DOI] [PubMed] [Google Scholar]
- 52.Welsh JA, Cogswell ME, Rogers S, Rockett H, Mei Z, Grummer-Strawn LM. Overweight among low-income preschool children associated with the consumption of sweet drinks: Missouri, 1999-2002. Pediatrics. 2005;115(2) doi: 10.1542/peds.2004-1148. Available at: www.pediatrics.org/cgi/content/full/115/2/e223. [DOI] [PubMed] [Google Scholar]