

Abstract
The microbial water quality at two beaches, Hobie Beach and Crandon Beach, in Miami-Dade County, Florida, USA was measured using multiple microbial indicators for the purpose of evaluating correlations between microbes and for identifying possible sources of contamination. The indicator microbes chosen for this study (enterococci, Escherichia coli, fecal coliform, total coliform and C. perfringens) were evaluated through three different sampling efforts. These efforts included daily measurements at four locations during a wet season month and a dry season month, spatially intensive water sampling during low- and high-tide periods, and a sand sampling effort. Results indicated that concentrations did not vary in a consistent fashion between one indicator microbe and another. Daily water quality frequently exceeded guideline levels at Hobie Beach for all indicator microbes except for fecal coliform, which never exceeded the guideline. Except for total coliform, the concentrations of microbes did not change significantly between seasons in spite of the fact that the physical–chemical parameters (rainfall, temperature, pH, and salinity) changed significantly between the two monitoring periods. Spatially intense water sampling showed that the concentrations of microbes were significantly different with distance from the shoreline. The highest concentrations were observed at shoreline points and decreased at offshore points. Furthermore, the highest concentrations of indicator microbe concentrations were observed at high tide, when the wash zone area of the beach was submerged. Beach sands within the wash zone tested positive for all indicator microbes, thereby suggesting that this zone may serve as the source of indicator microbes. Ultimate sources of indicator microbes to this zone may include humans, animals, and possibly the survival and regrowth of indicator microbes due to the unique environmental conditions found within this zone. Overall, the results of this study indicated that the concentrations of indicator microbes do not necessarily correlate with one another. Exceedence of water quality guidelines, and thus the frequency of beach advisories, depends upon which indicator microbe is chosen.
Keywords: Indicator microbes, Coliform, Marine recreational water quality
1. Introduction
Microbial indicators have been used world wide to indicate if human wastes have contaminated a water body. Microbes typically utilized are those that are found in elevated concentrations in human feces. The typical indicators used in the US include total coliform, fecal coliform, Esherichia coli, and enterococci. Total and fecal coliform were recommended by the US Environmental Protection Agency (EPA) in 1976 [1]. In 1986, the US EPA modified the guideline to specify the use of E. coli and enterococci as the indicators of choice [2]. Many US states, however, have chosen to utilize the older US EPA guideline [3]. The State of Hawaii uses an additional indicator, C. perfringens, for monitoring beach water quality [3,30]. Recommended guideline levels for each of these indicator microbes are summarized in Table 1. The choice of which indicator to utilize for monitoring recreational water bodies has been a source of considerable debate among the public health community. It has long been recognized that total coliform proliferate in nature [6]. Data have also shown that fecal coliform, E. coli, and entorococci are found in the environment in the absence of a known sewage source of contamination [7-9] and have been shown to multiply within warm tropical environments [10-14]. Given the problems associated with microbial regrowth the State of Hawaii currently utilizes C. perfringens, a spore-forming obligate anaerobe, to supplement its beach water monitoring program. C. perfringens is not capbable of regrowth in aerobic environments but persists for long periods of time and, its detection may not be an indicator of recent sewage contamination. Despite this limitation, the State of Hawaii has adopted the use of C. perfringens in addition to a lower enterococci standard [15] for monitoring beach water quality.
Table 1.
Guidelines for recreational marine water recommended or implemented by various US governmental agencies
| Indicator microbe | Guidelines | Developed or utilized by: |
|---|---|---|
| E. coli | Not recommended for marine waters. For freshwater a geometric mean of ≤126/100 ml and ≤235/100 ml on a single day. | USEPA [2]a |
| Enterococci | A geometric mean of ≤35/100 ml and ≤104/100 ml on a single day. | USEPA [2] |
| FDOH [4]b | ||
| Fecal coliform | A monthly average (geometric mean) of 200/100 ml, ≤400/100 ml in 10% of samples, and ≤800/100 ml on a single day. | USEPA [1] |
| FDEP [5]c | ||
| FDOH [4] | ||
| Total coliform | A monthly average (geometric mean) of ≤1000/100 ml, ≤1000/100 ml in 20% of samples, and ≤2400/100 ml on a single day. | USEPA [1] |
| FDEP [5] | ||
| C. perfringens | A geometric mean of ≤5/100 ml (open ocean) | State of Hawaii [15] |
| A geometric mean of ≤50/100 ml (interior waters) |
US Environmental Protection Agency.
Florida Department of Health, Effective August 2002, the FDOH’s Fecal coliform standard for a single sample was changed to 400 cfu/100 ml.
Florida Department of Environmental Protection.
The potential for microbial survival and regrowth in tropical areas has resulted in doubts concerning the interpretation of elevated indicator microbe concentrations in tropical environments, especially given that the studies used to establish the US EPA guidelines were conducted in Boston Harbor, MA, New York City, NY, and New Orleans, LA, which are not representative of tropical regions. Thus, a dilemma exists with respect to which indicator is suitable for regulating recreational water bodies within the tropics, in particular for water bodies that lack a known sewage source of contamination. In these situations, microbe concentrations can be elevated beyond that from fecal impacts alone primarily due to the persistence and regrowth of indicator microbes within the environment.
The primary objective of the current study was to evaluate multiple indicator microbes for two beach sites located in the tropical environment of Miami, Florida, USA. Specifically concentrations of microbial indicators were measured to determine whether concentrations correlated between one indicator and another and to identify possible sources of the indicator microbes. Evaluating the correlations between microbial indicators was considered useful for identifying sources. It was reasoned that if the source of indicator microbes to the water body was from direct sewage, then the concentrations of all indicator microbes would be elevated since these indicators are typically found in sewage [16]. If not, then concentrations observed at the beach sites would not be due to the dilution of sewage only but due to other factors which may include the regrowth and extended persistence of indicator microbes within the environments evaluated. Source tracking of indicator microbes also included evaluating the spatial distribution of indicator microbes along with the measurement of physical chemical parameters [salinity, pH, water temperature, tidal stage (or tidal height), rainfall, and turbidity]. The microbes chosen for study included total and fecal coliform which correspond to the old US EPA criteria, E. coli and enterococci which correspond to the new US EPA criteria, and C. perfringens which is used as a supplemental indicator within the State of Hawaii. These microbe concentrations were measured in support of a pilot-scale epidemiologic study designed to evaluate relationships between microbial water quality and human health [17]. Only the water quality data are presented in this current paper.
2. Materials and methods
2.1. Site description
Hobie Beach and Crandon Beach, the beaches chosen for this study, are located within Biscayne Bay, which is immediately east of the Miami mainland (Fig. 1). The climate of Miami, FL is often classified as subtropical because of its geographic location. It is considered to possess a tropical climate based on its average ambient temperature of 24.8°C [18,19].
Fig. 1.
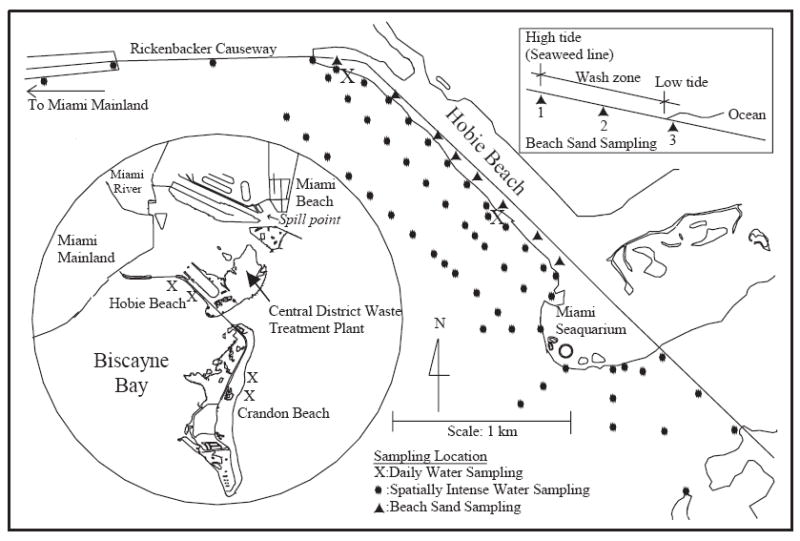
Study area and sampling sites.
Hobie Beach is approximately 1.6 km long, relatively shallow, and characterized by poor water circulation; its shoreline is covered with seaweed over a silty and muddy floor. It is a very narrow beach. The average distance between the mean water line and the outer edge of sand and gravel is about 5 m. It is the only beach in Miami-Dade County, where visitors can bring their pets. The beach has a history of poor water quality. During the year 2000, the beach exceeded the EPA Poor Water Quality Guideline (PWQG) for enterococci 29.2% of the time. There are no known sewage impacts to the beach. Bathroom facilities at the beach were connected to septic tanks which were pumped out daily to prevent infiltration of the septic tank effluent into the surrounding ground. Concerns were raised early during the study concerning the potential impacts of water discharges from marine animal tanks at the adjacent facilities of the Miami Seaquarium. Effluent from these tanks is chlorinated prior to discharge.
Crandon Beach is located about 4.2 km southeast of Hobie Beach. Crandon Beach is about 2 km long, relatively shallow, and located on the ocean side of the bay. The beach was chosen for this study because it possesses obvious contrasting characteristics in comparison with Hobie Beach. In particular, the beach has relatively good water quality and good circulation. Similar to Hobie, there are no known sources of sewage impacts to Crandon Beach.
The storm drainage system is separate from the sanitary sewer system within Miami-Dade County. There are no drains that discharge stormwater directly to either beach. The closest major river outflow, the Miami River, is located about 2 km north of Hobie Beach. Water from the Miami River flows into Biscayne Bay where it becomes diluted. Depending upon ocean circulation patterns, diluted freshwater flows from the Miami River can indirectly impact either beach.
2.2. Sample collection and measurement of physical–chemical parameters
Three separate sampling efforts were conducted. These included a daily sampling effort, a spatially intense water sampling effort, and a beach sand sampling effort. The daily sampling effort was conducted at both Hobie and Crandon Beaches. The spatially intense water sampling and the beach sand sampling efforts were conducted at Hobie Beach only.
2.2.1. Daily water sampling
Hobie and Crandon beaches were monitored daily for a period of two months. One month corresponded to the dry season (March 10–April 9, 2001) and the second month corresponded to the wet season (July 11–August 10, 2001). Two samples were collected daily from each beach for a total of four sites. The daily sampling sites for Hobie Beach are called H1 and H2 and for Crandon Beach are called C1 and C2 (Fig. 1). All samples were collected between 10:00 a.m. and 1:00 p.m. using 1-l pre-sterilized WhirlPakt™ bags. It took roughly 1 h to collect all of the samples. Water temperature, pH, and salinity were measured in the field from March 10 until March 16 using a multiparameter probe (Model 600R, YSI, Yellow Springs, Ohio). After this time, temperature was measured in the field using a mercury thermometer. Samples were then analyzed in the laboratory for pH (Model 525A pH meter, Orion, Beverly, MA), salinity (Model 4081 EC meter, Amber Science, Eugene, OR) and turbidity (TD-40 nephelometer, Turner Designs, Sunnyvale, CA).
2.2.2. Spatially intense water sampling
Two spatially intense sampling efforts were conducted at Hobie Beach. The first one was performed during high tide on June 25, 2001 and the second effort was conducted during low tide on July 2, 2001. During each of those efforts, samples were collected at a total 60 points (Fig. 1). Three different sampling crews were involved to facilitate sample collection within a 2-h period. The shoreline points at Hobie Beach were collected in knee-deep water using Whirl-Pak bags. Samples collected from the bridges and from the Miami Seaquarium were collected using a pre-sterile 1-l bottle that was attached to a metal fastener and a long rope. Offshore samples were collected from a boat using pre-sterilized Whirl-Pak bags. Sampling locations were identified through visual landmarks, including offshore buoys and with a handheld GPS. Upon sample collection, sub-samples of the original samples were placed into a 100 ml pre-sterilized bottle and sent to the Florida Department of Health Laboratory located in downtown Miami for the measurement of fecal coliform and enterococci. The original samples were then sent to the University of Miami, Environmental Engineering Laboratory for measurement of total coliform, E. coli, and C. perfringens.
2.2.3. Beach sand sampling
The beach sand survey, conducted at Hobie Beach, focused on collecting samples from the “wash” zone of the beach, which is the zone that is in contact with the outer fringes of the water between low and high tide. Typically a seaweed line marks the outer fringe of the wash zone. Samples were collected at eight locations during low tide on May 29, 2001. At each location a set of three samples were collected from different points within the wash zone. One sample was collected from under the seaweed, one was collected from sand that was not covered with seaweed in between the seaweed line and water’s edge, and the third was collected from the sand bottom within knee deep water (Fig. 1). Once collected, the samples were placed on ice inside a cooler and were immediately delivered to the laboratory. The sampling time was 3 h.
2.3. Laboratory methods for microbial analysis
All samples were analyzed for enterococci, E. coli, fecal coliform, total coliform, C. perfringens at the University of Miami Environmental Engineering laboratory with the exception of fecal coliform and enterococci for the spatially intensive sampling efforts, which were analyzed by Miami-Dade County Department of Health.
2.3.1. Sample pre-processing
Each sample was processed within 6 h. Sand samples, however, were processed within 24 h due to the lengthy procedures (procedures are time consuming, they require two filtration steps) and the large numbers of samples collected. Two preliminary processing steps were performed for sand analysis. These steps included measurement of the water content of the sand sample and extraction of the microbes from the sand grains into a liquid. Water content measurements were performed by measuring the weight of the sand before and after oven drying (110°C for 24 h) approximately 10 g of sample. In order to extract the microbes from the sand grains to a liquid, approximately 10 g of undried soil were removed from the sampling bags and were aseptically placed into new sterile pre-weighed Whirl-Pak bags. 200 ml of sterile de-ionized water were then added to each bag. The samples were shaken vigorously to promote the transfer of microbes toward the liquid phase. The liquid samples were then filtered using pre-sterilized 30 μm pore size nylon net filters (Type NY30, Millipore, Bedford, MA). A pre-determined volume of the liquid extract was then utilized for subsequent bacterial enumeration.
2.3.2. Microbial analysis
Two general types of microbial analytical methods were used. The first was the membrane filter (MF) method which provides a direct count of bacteria based on the development of colonies on the surface of a MF. The second method was based upon the use of a chromogenic substrate (IDEXX, Westbrook, MN). Fecal coliform and C. perfringens were analyzed using the MF method. Total coliform and E. coli were analyzed using chromogenic substrates. Enterococci were analyzed using both methods, but only the results from the MF method are reported here for brevity.
The MF method involves filtering a given volume of the sample through a 0.45 μm pore size filter membrane (47 mm diameter membrane, Fisher, Pittsburg, PA) that retains the bacteria. Sample volumes were 30 and 100 ml during the first half of the dry season monitoring. The sample volumes were later changed to 10 and 50 ml for the last half of the dry season monitoring to optimize quantification. Only 50 ml volumes were evaluated during wet season monitoring. The MF method used for enterococci [20] (Method 1600) was based upon the use of a selective medium (mEI agar, Becton Dickinson, Sparks, MD) upon which samples were incubated at 41°C for 24 h. Colonies with a blue halo were counted as enterococci. The MF method for enumerating fecal coliform ([21]; Method 9222 D) utilized a modified mFC agar (Becton Dickinson, Sparks, MD). Samples were incubated at 44.5±0.5°C for 24 h and colonies that were various shades of blue were counted as fecal coliform. The method for C. perfringens enumeration [22] was based upon the use of a mCP agar. Samples were incubated anaerobically using an anaerobic chamber fitted with an anaerobic GasPak (BBL GasPak Anaerobic System Envelopes, Becton Dickinson, Sparks, MD) at 44.5±0.5°C for 24 h. The plates were exposed to ammonium hydroxide fumes after the incubation and dark pink to magenta colonies were counted as C. perfringens.
The chromogenic substrate method in simple terms utilizes enzymes that are specific to particular microbe groups. These enzymes are attached to dyes, which are then released when the target microbe is present in the sample. Enumeration of the microbe population is based upon the use of a tray (Quanti-Tray/2000), IDEXX, Westbrook, Maine) which separates the sample into 49 large and 48 small wells. The number of test wells that show the characteristic color or fluorescence under ultra violet (UV) light were then counted and used in conjunction with a standardized table to provide the concentration in terms of the most probable number (MPN). IDEXX’s Colilert 18® reagents were used for the simultaneous detection of total coliform and E. coli. 10 ml of sample were poured into 100 ml sterile vessel and diluted with 90 ml of sterile deionized water. Colilert 18 reagent was added into the vessel and mixed. The sample was poured into the tray and the trays were incubated at 35±0.5°C for 18 h. Test wells showing a yellow color were positive for total coliform and wells that fluoresced under UV violet light were positive for E. coli.
All materials and instruments were sterilized prior to the analysis to prevent contamination. A blank sample was analyzed in order to confirm that there was no cross contamination.
3. Results
Results from daily monitoring, spatially intense water sampling, and the beach sampling efforts are provided in subsequent sections below. It is important to note that an estimated 8 million gallon sewage spill occurred over a period of 2 h in the evening on May 15, 2001 during the dry season monitoring period. This sewage spill was due to the rupture of a 1.8 m diameter force main. The data collected the two days after the sewage spill event were omitted when computing descriptive statistics.
3.1. Daily monitoring
3.1.1. Comparison of microbe concentration with water quality guidelines
Results from daily monitoring showed that the mean concentration of the microbial indicators at both Hobie and Crandon Beach were below guideline levels (Table 1) during both the dry and the wet monitoring periods except for total coliform at H2 during the wet period and C. perfringens at H1 and H2 during both periods. Daily water quality frequently exceeded guidelines with respect to single day levels (Table 2), especially at Hobie Beach, where 20–30% of the days exceeded maximum allowable daily values for 4 of the 5 microbes evaluated. The concentrations of all the microbes at Hobie Beach were significantly larger than at Crandon Beach (95% confidence). The sites in order from the least to the greatest number of microbes was C1, C2, H1 and H2 during both periods. The numbers of all microbes at H2 were significantly larger than at H1 (95% confidence) except for fecal coliform. There was no significant difference between C1 and C2 for any particular microbe. Only the concentration of total coliform increased significantly (95% confidence) from the dry season to the warmer wet season. No significant differences were observed between seasons for the remaining microbes.
Table 2.
Percentage (%) of days at each sampling site that exceeded daily regulatory guideline for beach closures
| Microbial indicator | Season | H1a | H2 | C1b | C2 |
|---|---|---|---|---|---|
| Enterococci | Dry | 4 | 17 | 0 | 0 |
| Over 104/100 ml | Wet | 3 | 23 | 3 | 6 |
| Dry and Wet | 2 | 20 | 2 | 3 | |
| E. coli | Dry | 7 | 17 | 0 | 0 |
| Over 235/100 ml | Wet | 13 | 23 | 0 | 6 |
| Dry and Wet | 10 | 20 | 0 | 3 | |
| Fecal coliform | Dry | 0 | 0 | 0 | 0 |
| Over 800/ml | Wet | 0 | 0 | 0 | 0 |
| Dry and Wet | 0 | 0 | 0 | 0 | |
| Total coliform | Dry | 3 | 21 | 0 | 0 |
| Over 2400/100 ml | Wet | 26 | 29 | 0 | 0 |
| Dry and Wet | 15 | 25 | 0 | 0 | |
| C. perfringensc | Dry | 21 | 28 | 0 | 0 |
| Over 50/100 ml | Wet | 6 | 23 | 0 | 0 |
| Dry and Wet | 13 | 25 | 0 | 0 |
Daily guidelines are provided in Table 1.
Sites H1 and H2 correspond to Hobie Beach.
Sites C1 and C2 correspond to Crandon Beach.
The State of Hawaii does not have a daily guideline for C. perfingens. A value of 50/100 ml, which is the recommended value for interior waters, was used for the comparison purposes.
The numbers of microbes varied noticeably during the daily monitoring periods. Data are plotted in Fig. 2 for site H2 and C2, respectively, during the dry period. These plots are representative of the overall results for each beach. Increases in bacterial concentrations by over an order of magnitude were common between one day and the next for all of the microbial indicators evaluated, in particular for the sites at Hobie Beach. The change in concentration of the indicator microbes on a day-to-day basis showed similar patterns in some cases. For example, a spike in indicator microbe concentrations was observed at H2 towards the end of March. However, it was also noted that patterns were not necessarily consistent all of the time. Even though Hobie Beach is considered the more contaminated beach it is important to emphasize that its water quality did not always exceed the guidelines. The distinguishing feature between Hobie and Crandon Beaches is that the standard deviation of the microbial concentrations was larger for Hobie than for Crandon Beach. In other words, the water quality at Hobie Beach varied largely, while at Crandon Beach the concentrations were more stable and at lower levels.
Fig. 2.
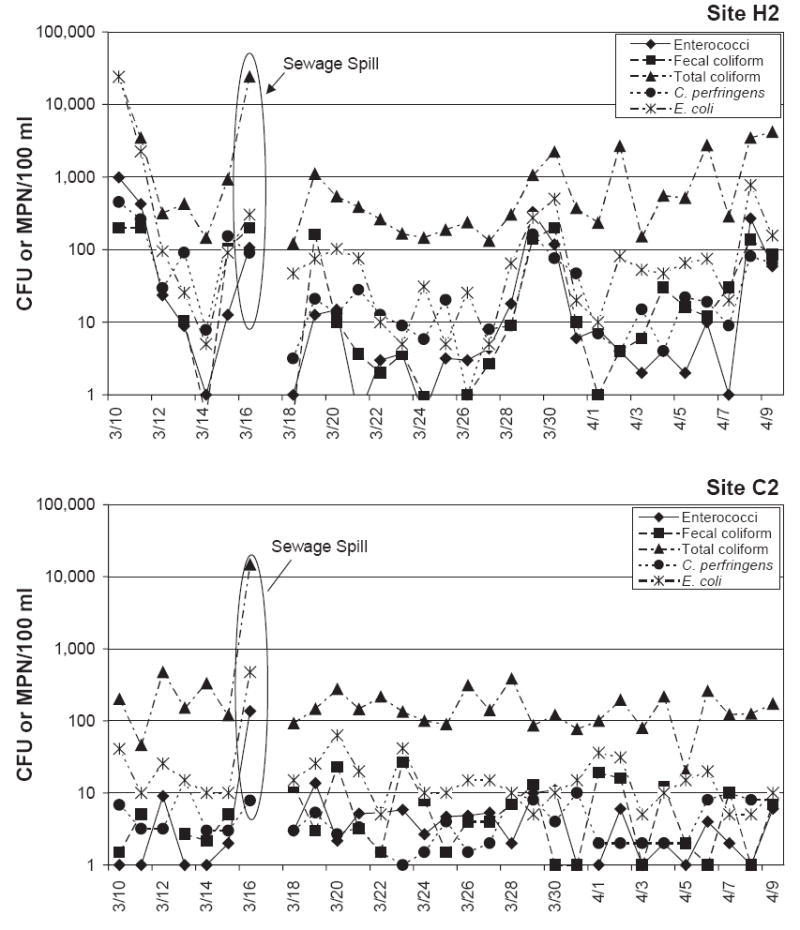
Daily monitoring results at H2 and C2 during the dry period.
On the day after the spill event only two out of four sites showed increased numbers of the microbial indicators (Table 3). Interestingly one of the two sites (C2) was located at the farthest point from the spill. At C2, enterococci, E. coli, and total coliform showed the highest numbers during the monitoring period while C. perfringens did not spike. The other site was H2, which was rated as having the poorest water quality among the study sites. The microbe concentrations at H2 after the spill were comparatively high but those concentrations were not the highest observed during the monitoring period.
Table 3.
Microbial indicator levels at each beach sampling site the day after the March 15, 2001 sewage spill
| Site | Enterococci (CFU/100 ml) | E. coli (MPN/100 ml) | Fecal coliform (CFU/100 ml) | Total coliform (MPN/100 ml) | C. perfringens (CFU/100 ml) |
|---|---|---|---|---|---|
| H1 | 17 | 42 | 6 | 7700 | 31 |
| H2 | 106 | 303 | TNTCa | >24,200 | 90 |
| C1 | 5 | 30 | 6 | 986 | 3 |
| C2 | 136 | 474 | INTb | 14,800 | 8 |
Too numerous to count.
Could not be counted due to excessive interfering material on filters.
Given the results from daily sampling, ratings were established for each beach based upon whether or not samples collected exceeded mean or daily water quality guidelines. A “good” rating was established when samples were below mean and maximum daily guidelines. A “moderate” rating was established when the mean water quality was below the mean guideline value but the daily guideline was exceeded during at least one occasion. A “poor” rating was established when the samples exceeded both the mean guideline and the maximum daily value on at least one occasion. Evaluations based on the overall data (both wet and dry season months) showed that different microbial indicators provide conflicting ratings (Table 4). The differences in the ratings were especially noticeable at Hobie Beach, which was evaluated as having “good” water quality based on fecal coliform, “moderate” based on enterococci, E. coli, and total coliform (except for H2 during the wet period), and “poor” based on C. perfringens and total coliform at H2 during the wet period. Crandon Beach was rated as “good” based on fecal coliform, total coliform and C. perfringens and was rated as “moderate” based upon enterococci and E. coli during the wet season.
Table 4.
Classification of water quality at each sampling site using multiple microbial indicators
| Microbial indicator | Season | Ratinga |
|||
|---|---|---|---|---|---|
| H1 | H2 | C1 | C2 | ||
| Enterococci | Dry | Moderate | Moderate | Good | Good |
| Wet | Moderate | Moderate | Moderate | Moderate | |
| Overall | Moderate | Moderate | Moderate | Moderate | |
| E. coli | Dry | Moderate | Moderate | Good | Good |
| Wet | Moderate | Moderate | Moderate | Moderate | |
| Overall | Moderate | Moderate | Moderate | Moderate | |
| Fecal coliform | Dry | Good | Good | Good | Good |
| Wet | Good | Good | Good | Good | |
| Overall | Good | Good | Good | Good | |
| Total coliform | Dry | Moderate | Moderate | Good | Good |
| Wet | Moderate | Poor | Good | Good | |
| Overall | Moderate | Moderate | Good | Good | |
| C. perfringens | Dry | Poor | Poor | Good | Good |
| Wet | Poor | Poor | Good | Good | |
| Overall | Poor | Poor | Good | Good | |
Good: both mean and daily water quality were below the guideline; Moderate: mean water quality was below the guideline but daily guideline was exceeded; Poor: both mean and daily water quality exceeded the guideline.
3.1.2. Physical–chemical parameters
Some physical–chemical parameters changed noticeably between seasons. During the wet season, more rainfall was measured (7 mm/d vs. 3 mm/d), the water temperature was warmer (30.7°C vs. 25.6°C), and salinity was lower (30.0‰ vs. 34.4‰) on average than during the dry season. No significant differences were observed between tidal stage and turbidity between each of the seasons.
The range in microbial indicator numbers were considerably large and the concentrations varied by orders-of-magnitude day to day while the physical–chemical parameter values were more uniform. In order to compare these extremely different numbers, the base-10 logarithm of the microbe concentrations and physical–chemical parameter values were utilized for calculation of Pearson correlation coefficients (r) between physical parameters and indicator microbe concentrations. “r ” values greater than 0.500 were considered to represent strong correlations. Overall correlations between microbe concentrations during the two season monitoring effort (240 samples) showed that only the concentration of C. perfringens and total coliform correlated strongly with turbidity (r = 0:60 and 0.57) (Table 5). This correlations table also indicates that E. coli was correlated with total coliform and fecal coliform (r = 0:70 and 0.64, respectively). Correlations with physico-chemical parameters were also evaluated for various subsets of the microbial data (e.g. by site and by season) (Table 6). A listing of the significant correlations (r > 0:5) for this analysis shows that many subsets of the microbial data were correlated with turbidity. This correlation can be observed from time series plots of C. perfringens versus turbidity (Fig. 3) which shows a similar pattern between these two variables. In general when turbidity was elevated, C. perfringens concentrations were also elevated. Enterococci was correlated with tidal stage for 3 data subsets. A representative time series plot of this data is shown in Fig. 4 which again shows that both parameters follow a similar pattern. Subsets of the microbial concentration data were also found to be correlated with rainfall and temperature.
Table 5.
Correlations (r) between physico-chemical parameters and microbe concentrations for daily monitoring at four beach sites
| Total | Rain | Tide | Temp | pH | Salinity | Turbidity | TC | FC | E .coli | ENT | CP |
|---|---|---|---|---|---|---|---|---|---|---|---|
| Rain | 1.000 | ||||||||||
| Tide | −0.012 | 1.000 | |||||||||
| Temp | 0.192 | −0.180 | 1.000 | ||||||||
| PH | −0.041 | −0.067 | −0.293 | 1.000 | |||||||
| Salinity | −0.215 | −0.051 | −0.639 | 0.419 | 1.000 | ||||||
| Turbidity | 0.087 | 0.204 | 0.036 | −0.196 | −0.261 | 1.000 | |||||
| TCa | 0.168 | 0.264 | −0.013 | −0.100 | −0.295 | 0.566 | 1.000 | ||||
| FCb | 0.008 | 0.260 | −0.137 | −0.064 | −0.139 | 0.389 | 0.507 | 1.000 | |||
| E. coli | 0.094 | 0.177 | −0.113 | −0.047 | −0.113 | 0.463 | 0.702 | 0.642 | 1.000 | ||
| ENTc | 0.171 | 0.343 | −0.079 | −0.152 | −0.204 | 0.465 | 0.585 | 0.463 | 0.539 | 1.000 | |
| CPd | −0.027 | 0.264 | −0.254 | 0.085 | 0.001 | 0.604 | 0.541 | 0.516 | 0.521 | 0.527 | 1.000 |
Results correspond to a total of 240 samples collected during wet and dry seasons.
Total coliform.
Fecal coliform.
Enterococci.
C. perfringens.
Table 6.
Correlations (>0.50) between microbial indicators and physical-chemical parameters obtained from evaluating subset of the daily monitoring results at four beach sites
| Microbe (no. per 100 ml) | Rainfall (mm) preceding 24 h | Temperature (°C) | Tidal stage (m) | Turbidity (NTU) |
|---|---|---|---|---|
| Total coliform | 0.522 (H1:Wet) | −0.660 (H1: Wet and Dry) | 0.602 (H1:Wet and Dry) | |
| −0.508 (H2:Wet and Dry) | 0.505 (H2:Wet and Dry) | |||
| 0.546 (C1:Wet and Dry) | ||||
| 0.500 (C2:Wet and Dry) | ||||
| Fecal coliform | −0.565 (C1:Dry) | 0.544 (C1:Dry) | ||
| E. coli | 0.570 (H1:Dry) | −0.560 (H1:Wet) | 0.637 (H1:Dry) | |
| Enterococci | 0.528 (H1:Dry) | |||
| 0.522 (C1:Wet) | ||||
| 0.528 (C2:Wet) | ||||
| C. perfringens | −0.596 (C1:Dry) | 0.675 (H2:Wet) | 0.629 (H1:Dry) | |
| 0.685 (H2:Dry) | ||||
| 0.738 (H1:Wet) | ||||
| 0.702 (H2:Wet) |
Fig. 3.
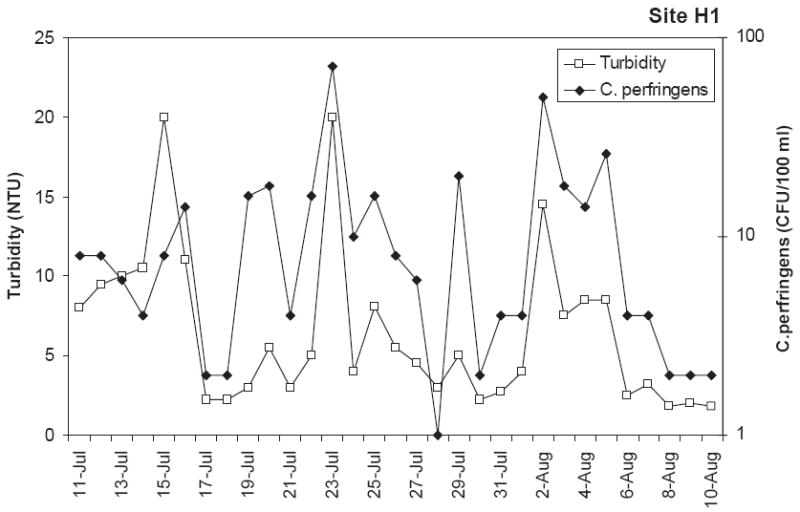
Relationship between turbidity and C. perfringens at H1 during daily monitoring in the wet season.
Fig. 4.
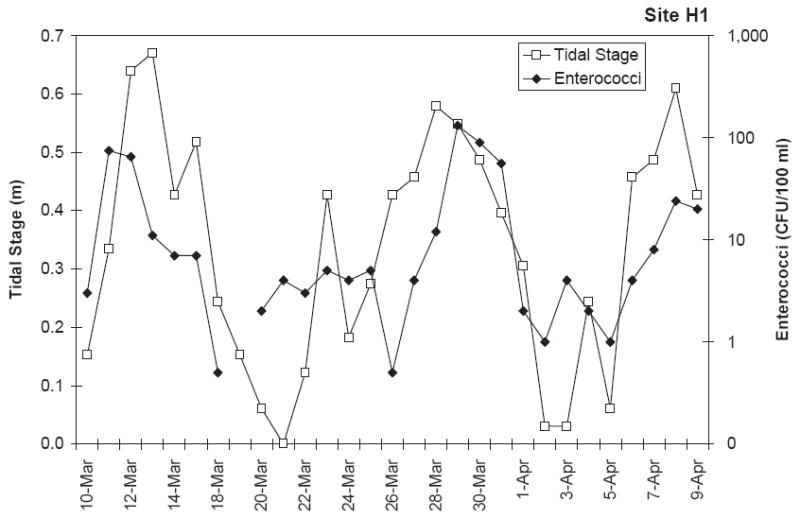
Relationship between tidal stage and enterococci at H1 during daily monitoring in the dry season.
3.2. Spatially intensive water quality
Results from the spatially intensive monitoring effort showed that concentrations of indicator microbes were highest during high tide with “hot spots” at various points along the shoreline. None of the off-shore sampling points had detectable levels of indicator microbes. The waters around the Miami Seaquarium generally showed low levels of microbes. These results suggest that the shoreline is the primary source of indicator microbes and this source is most pronounced during high tide when the water level reaches its highest point along the shore. As shown in Figs. 5 and 6, which were representative of the other indicator microbes evaluated, the concentrations of enterococci and C. perfringens were elevated at the shore line during high tide with spikes of 306 and 270 CFU/100 ml for enterococci on the west and east sides of the beach, respectively. A spike of 94 CFU/100 was observed on the east end of the beach for C. perfringens. The small area of elevated concentrations on the east side of the Miami Seaquarium during low tide was due to a stormwater channel which apparently was discharging low but measurable concentrations of indicator microbes.
Fig. 5.
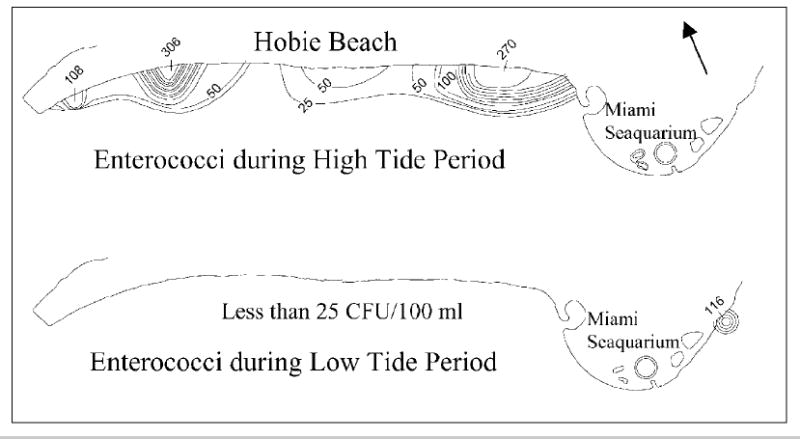
Distribution of enterococci during high tide and low tide (contour interval of 25 CFU/100 ml).
Fig. 6.
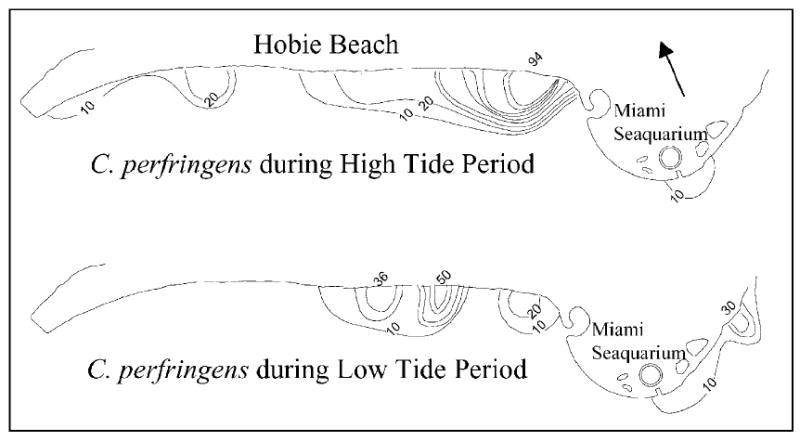
Distribution of C. perfringens during high tide and low tide (contour interval of 10 C. perfringens per 100 ml).
3.3. Beach sand survey
Indicator microbes were detected at all sand sampling sites and in all sand conditions: sand under seaweed on the beach, uncovered sand between the water’s edge and the seaweed line, and submerged sand at knee height (Table 7). The largest concentration of enterococci (37 CFU/g of dry sand) and fecal coliform (49 CFU/g of dry sand) were detected from submerged sand near the east end of the beach. The largest concentration of C. perfringens (33 CFU/g of dry sand) and total coliform (654 MPN/g of dry sand) were detected from the east end of the beach but from the sand under seaweed. The largest concentration of E. coli was detected from the sand under seaweed but at the center of the beach. The concentrations of the microbes were noticeably different in each condition at the same site. On average, the highest levels of each microbe were observed in sand under seaweed or in submerged sand Uncovered sand did not have the highest average levels of microbes for any of the indicators. Total coliform, E. coli, and enterococci were highest, on average, in the “under seaweed” condition. The concentration of total coliform in sand under seaweed on the beach was significantly larger than submerged and uncovered sand (p = 0:011). The concentration of C. perfringens in submerged sand was significantly larger than uncovered sand (p = 0:004).
Table 7.
Microbial indicators in different sand conditions at Hobie beach
| Sample
|
Water content (%) | Total coliform (MPN/g)b | Fecal coliform (CFU/g) | E. coli (MPN/g) | Enterococci (CFU/g) | C. perfringens (CFU/g) | |
|---|---|---|---|---|---|---|---|
| Location | Conditiona | ||||||
| 1 | NDc | ND | ND | ND | ND | ND | |
| West end | 2 | 9.8 | 6 | 1 | 2 | 1 | 8 |
|
|
3 | 19.4 | 3 | CFd | <1 | 4 | 10 |
| 1 | 6.4 | 156 | 4 | <1 | 11 | 24 | |
| 2 | 18.9 | 19 | CF | <1 | 1 | 6 | |
| 3 | 22.3 | 10 | 3 | <1 | 5 | 9 | |
| 1 | 19.6 | 62 | 1 | <1 | 2 | 3 | |
| 2 | 21.2 | 16 | 2 | 1 | <1 | 3 | |
| 3 | 23.6 | 32 | 12 | <1 | 2 | 13 | |
| 1 | 19.7 | 620 | 31 | 42 | 14 | 5 | |
| 2 | 19.3 | 168 | 7 | 2 | 3 | 1 | |
| 3 | 29.2 | 67 | 4 | 3 | 4 | 16 | |
| 1 | 13.1 | 301 | 5 | 4 | 3 | 9 | |
| 2 | 20.1 | 282 | 13 | 12 | 6 | 6 | |
| 3 | 27.2 | 69 | 3 | 4 | 4 | 28 | |
| 1 | 14.8 | 183 | 5 | 4 | 9 | 1 | |
| 2 | 20.5 | 348 | 15 | 7 | 12 | 3 | |
| 3 | 22.0 | 38 | 3 | <1 | 1 | 10 | |
| 1 | 10.3 | 654 | 0 | 5 | 12 | 6 | |
| 2 | 21.8 | 179 | 15 | 5 | 8 | 3 | |
| 3 | 24.3 | 190 | 49 | 2 | 37 | 21 | |
| 1 | 21.6 | 397 | 15 | 3 | 9 | 33 | |
| East end | 2 | 20.6 | 37 | 6 | 1 | 5 | 3 |
| 3 | 25.1 | 12 | 0 | <1 | 2 | 29 | |
Sand conditions: 1=in sand under seaweed, 2=uncovered sand on beach between the wave and the seaweed line at high tide, 3=submerged sand under water at a depth of knee height.
Unit: MPN or CFU/g of dry sand.
ND: No data.
CF: Confluent growth.
4. Discussion
This study emphasizes that the concentration of indicator microbes in recreational marine waters is highly variable in time and space. Some correlations were observed between indicator microbes; however, the variations in concentrations did not vary consistently between one indicator microbe and another, suggesting that the levels of indicator microbes observed at the beach sites were not due to simply the dilution of sewage. Rather the results suggest that there may be an additional source(s) of indicator microbes. Given the variability observed between microbes, water quality ratings for a particular beach depended upon which microbial indicator was used, and which sampling site was chosen. The indicator used prior to 2001 by regulatory agencies (Miami-Dade County Department of Health) was fecal coliform. During 2001, both fecal coliform and enterococci were used. As shown in this study the use of enterococci provided a lower rating for the beach sites. As a result, it is likely that beach advisories will be posted more frequently in the future. This change in rating is not necessarily due to a change in water quality, but simply due to a change in indicator microbe chosen for monitoring beach water quality. Results thus indicated that different ratings can be obtained for the same beach site depending upon the indicator microbe chosen. This finding is consistent with those conducted at other sites [23,24].
Data collected during the spatially intense water sampling efforts indicated that the source of indicator microbes comes from the shoreline, as evidenced by the higher indicator microbe concentrations as the shore was approached. The shoreline concentrations were highest at high tide. This trend was strongly supported by the results of the intensive monitoring effort and by the positive correlations observed between enterococci and tidal stage within subsets of the daily monitoring data. Thus tidal stage plays an important role in affecting microbe levels within this area. The observation of elevated indicator levels at high tide suggested that the wash zone that is exposed between low and high tide was the likely origin of the indicator microbes.
The shoreline, and subsequently the wash zone, was associated with many possible sources of microbes. Possible sources include plants, humans, and animals. As mentioned earlier Hobie Beach is the only beach in Miami-Dade County that allows pets. These pets plus direct contributions from humans can serve as a source of indicator microbes to this zone. Another possible source may include the sand itself, especially given that other studies [12,25,26] including those conducted in South Florida have found that indicator microbes are capable of multiplying in soil, in particular within soils subjected to tidal action [10,13]. Moisture was found to be a key factor in controlling the regrowth of the indicator microbes within these previous studies. One can envision that the sand within the wash zone between low and high tide is characterized by a gradient of moisture content, with the highest moisture content near the ocean side and the lowest moisture near the beach side. It is very possible for optimum moisture conditions to occur within this zone. Also of importance is that C. perfringens concentrations were observed to correlate with turbidity for some data sets. The source of turbidity could be from the resuspension of sand. This resuspension can be enhanced by wave action and human activities near the shoreline. Results from the sand survey indicate that indicator microbes were observed in all sand samples collected from the shoreline at Hobie Beach. The largest concentrations of C. perfringens and total coliform were obtained from below seaweed. It is hypothesized that the seaweed provides nutrients, protection from UV light, and helps to maintain moist conditions so that microbes could flourish or survive longer. Such a hypothesis is consistent with other studies that focused the impact of seaweed [27] and other aquatic plants [28] and is likely associated with local climate conditions.
This study also provided an opportune situation to observe relationships between microbial water quality and actual human fecal contamination during a sewage spill (approximately 1 km away from the study sites) during the monitoring period. However, it was not certain if the spill affected the study sites. Some hypotheses can be established to explain such phenomenon. The spill might have impacted only two sites due to ocean currents or it may have reached all sites and then microbes at two sites of four decreased. Another scenario includes the possibility that nutrients from the spill might have reached all the sites and local conditions favored regrowth of certain indicator microbes at two of the sites. Of interest, C. perfringens did not show spikes perhaps due to its relatively low concentration in human feces. The typical concentration of C. perfringens in adult human feces is about 105–106 CFU/g, which is comparatively lower than other indicator microbes, such as 108 CFU/g for enterococci and E. coli [29]. C. perfringens also could have been deposited closer to the spill location than the other microbes. Therefore, C. perfringens did not spike at any site during the spill. In addition, all of the microbes except for C. perfringens are capable of multiplication under aerobic conditions typical of the ocean water in the area. Perhaps the nutrients from the sewage spill resulted in the regrowth of the other indicator microbes, causing a spike in these other indicators but not for C. perfringens.
Further study is recommended in this tropical region given the variability observed among the different indicators. Whether or not a beach advisory is issued would depend highly upon which indicator microbe was chosen for evaluation. Given this discrepancy, a full scale epidemiologic study and monitoring for pathogens is recommended in order to determine which indicator microbe correlates with increased human illness and/or pathogen levels within the water column. Additional study should also focus on identifying the local sources of contamination and a determination of whether the indicator microbes are of human, animal or environmental origin (i.e. bacteria source tracking study). Human and animal populations on the beaches should be documented to determine if correlations exist with indicator or pathogen levels within the water column. Also, it is of interest to evaluate the role of sand and seaweed on the survival and the multiplication of the indicator microbes at this particular site.
Acknowledgments
Funding and other support for this project were provided from the National Institute of Environmental Health Sciences (NIEHS) Marine and Freshwater Biomedical Science Center (Rosenstiel School of Marine and Atmospheric Science, University of Miami) Pilot Project and COEP Programs (NIEHS project P30ES05705). Matching funds were provided by Miami-Dade County Department of Health. In addition, student support was provided by a grant from National Institute of General Medicine Science (NIH-NIGMS). We gratefully acknowledge the Miami-Dade County Department of Health and the Department of Environmental Resources Management for their assistance in collecting and analyzing samples during the spatially intensive water sampling effort. We also acknowledge the assistance received from the numerous students and FDOH employees who volunteered to work on this project.
References
- 1.U.S. Environmental Protection Agency. Quality Criteria for Water. Washington, DC: U. S. Environmental Protection Agency; 1976. EPA-440976023. [Google Scholar]
- 2.U.S. Environmental Protection Agency. Ambient water quality criteria for bacteria. Washington, DC: U. S. Environmental Protection Agency; 1986. EPA A440/5-84-002. [Google Scholar]
- 3.U.S. Environmental Protection Agency. EPA’s BEACH Watch Program: 2000 Update. Washington, DC: U. S. Environmental Protection Agency; 2000. EPA-823-F-00-012. [Google Scholar]
- 4.Florida State Department of Health. Florida Health Beaches Program. http://apps3.doh.state.fl.us/env/beach/2001.
- 5.Florida Department of Environmental Protection. Surface water quality standards. Florida Department of Environmental Protection; Tallahassee: 1996. Florida administrative code; pp. 62–302. [Google Scholar]
- 6.Mark WN. Total coliform bacteria. American Society for Testing and Materials. 1977:59–64. [Google Scholar]
- 7.Carillo J, Estrada E, Hazen TC. Survival and enumeration of the fecal indicators Bifidbacterium adolescents and Escherichia coli in a tropical rainforest watershed. Appl Environ Microbiol. 1985;50:468–76. doi: 10.1128/aem.50.2.468-476.1985. [DOI] [PMC free article] [PubMed] [Google Scholar]
- 8.Rivera SC, Hazen TC, Toranzos GA. Isolation of fecal coliforms from pristine sites in a tropical rain forest. Appl Environ Microbiol. 1988;54:513–7. doi: 10.1128/aem.54.2.513-517.1988. [DOI] [PMC free article] [PubMed] [Google Scholar]
- 9.Wright RC. The seasonality of bacterial quality of water in a tropical developing country. Vol. 96. J Hygiene; Cambridge: 1986. pp. 75–82. Sierra Leone. [DOI] [PMC free article] [PubMed] [Google Scholar]
- 10.Desmarais TR, Solo-Gabriele HM, Palmer CJ. Influence of soil on fecal indicator organisms in a tidally influenced subtropical environment. Appl Environ Microbiol March. 2002:1165–1172. doi: 10.1128/AEM.68.3.1165-1172.2002. [DOI] [PMC free article] [PubMed] [Google Scholar]
- 11.Hardina CM, Fujioka RS. Soil: the environmental source of Escherichia coli and enterococci in Hawaii’s stream. Environ Toxicol Water Quality. 1991;6:185–95. [Google Scholar]
- 12.Roll BM, Fujioka RS. Source of fecal indicator bacteria in a brackish. Tropical stream and their impact on recreational water quality. Water Sci Technol. 1997;35(11–12):179–86. [Google Scholar]
- 13.Solo-Gabriele HM, Wolfert MA, Desmarais TR, Palmer CJ. Sources of Escherichia coli in a coastal subtropical environment. Appl Environ Microbiol. 2000;66(1):230–7. doi: 10.1128/aem.66.1.230-237.2000. [DOI] [PMC free article] [PubMed] [Google Scholar]
- 14.Wright RC. The survival patterns of selected faecal bacteria in tropical fresh waters. Epdiem Inf. 1989;103:606–11. doi: 10.1017/s0950268800031009. [DOI] [PMC free article] [PubMed] [Google Scholar]
- 15.Hawaii Department of Health. Water Quality Standards 11-54-08. Honolulu; Hawaii: 2000. Hawaii Administrative Rules. [Google Scholar]
- 16.Maier RM, Pepper IL, Gerba CP. Environmental microbiology. New York: Academic Press; 2000. [Google Scholar]
- 17.Fleming LE, Solo-Gabriele H, Elmir S, Shibata T, Squicciarini D, Quirino W, Arguello M, Van de Bogart G. A pilot study of microbial contamination of subtropical recreational waters. Florida Journal of Public Health. (March):29–33. [PMC free article] [PubMed] [Google Scholar]
- 18.National Climatic Data Center (NCDC) Normal Daily Mean Temperature (1971–2000) http://lwf.ncdc.noaa.gov/oa/climate/online/ccd/meantemp.html2002.
- 19.Henry JA. Weather and climate. In: Fernald EA, Purdum ED, editors. Water resources atlas of Florida. Tallahassee, FL: Institute of Science and Public Affairs, Florida State University; 1998. pp. 16–37. [Google Scholar]
- 20.U.S. Environmental Protection Agency. Method 1600: membrane filter test method for enterococci in water. Washington, DC: U.S. Environmental Protection Agency; 1997. EPA 821/R-97/004. [Google Scholar]
- 21.American Public Health Association. Microbiological examination: Fecal coliform membrane filter procedure. 9222 D. Washington, DC: American Public Health Association; 1995. [Google Scholar]
- 22.U.S. Environmental Protection Agency. Method for detection and enumeration of C perfringens in water and sediments by membrane filtration. Washington, DC: U.S. Environmental Protection Agency; 1995. EPA 600/R-95/03O. [Google Scholar]
- 23.Crowther J, Kay D, Wyer MD. Relationships between microbial water quality and environmental conditions in coastal recreational waters: the Fylde coast, UK. Water Res. 2001;35(17):4029–38. doi: 10.1016/s0043-1354(01)00123-3. [DOI] [PubMed] [Google Scholar]
- 24.Noble RT, Moore DF, Leecaster MK, McGee CD, Weisberg SB. Comparison of total coliform, fecal coliform, and enterococcus bacterial indicator response for ocean recreational water quality testing. Water Res. 2003;37:1637–43. doi: 10.1016/S0043-1354(02)00496-7. [DOI] [PubMed] [Google Scholar]
- 25.World Health Organization. Health-based monitoring of recreational waters: The feasibility of a new approach (The ‘Annapolis protocol). Protection of the human environment water, sanitation and health series. 1999 WHO/SDE/WSG/99.1. [Google Scholar]
- 26.Byappanahalli M, Fowler M, Shively D, Whitman R. Ubiquity and persistence of Escherichia coli in a Midwestern coastal stream. Appl Environ Microbiol. 2003;69(8) doi: 10.1128/AEM.69.8.4549-4555.2003. [DOI] [PMC free article] [PubMed] [Google Scholar]
- 27.Anderson SA, Turner SJ, Lewis GD. Enterococci in the New Zealand environment: implications for water quality monitoring. Water Sci Technol. 1997;35(11–12):325–31. [Google Scholar]
- 28.Whitman RL, Shively DA, Pawlik H, Nevers M, Byappanahalli MN. Occurrence of Escherichia coli and enterococci in Cladophora (Chlorophyta) in near water and beach sand of lake sand of Lake Michigan. Appl Environ Microbiol. 2003;69(8):4714–9. doi: 10.1128/AEM.69.8.4714-4719.2003. [DOI] [PMC free article] [PubMed] [Google Scholar]
- 29.Leclerc H, Mossel DA, Trinel PA, Gavini F. Microbiological monitoring—A new test for fecal contamination. Bacterial Indicators/Health Hazards Associated With Water, ASTM STP 635, American Society for Testing and Materials. 1977:21–31. [Google Scholar]
- 30.Fujioka RS, Shisumura LK. Clostridium perfringens, a reliable indicator of stream water quality. J Water Pollut Control Fed. 1985;57(10):986–92. [Google Scholar]