

Abstract
Suppose that the variability in our movements1–9 is caused not by noise in the motor system itself, nor by fluctuations in our intentions or plans, but rather by errors in our sensory estimates of the external parameters that define the appropriate action. For tasks in which precision is at a premium, performance would be optimal if no noise were added in movement planning and execution: motor output would be as accurate as possible given the quality of sensory inputs. Here we use visually guided smooth-pursuit eye movements in primates10 as a testing ground for this notion of optimality. In response to repeated presentations of identical target motions, nearly 92% of the variance in eye trajectory can be accounted for as a consequence of errors in sensory estimates of the speed, direction and timing of target motion, plus a small background noise that is observed both during eye movements and during fixations. The magnitudes of the inferred sensory errors agree with the observed thresholds for sensory discrimination by perceptual systems, suggesting that the very different neural processes of perception and action are limited by the same sources of noise.
Smooth-pursuit eye movement is the familiar ‘tracking’ behaviour elicited by the motion of small targets across the visual field (Fig. 1). It is convenient to describe pursuit eye movements as depending on the speed and direction of target motion. However, the brain has no independent knowledge of these parameters, and must estimate them visually if experiments are designed to remove opportunities for prediction. Furthermore, although tracking over long timescales involves feedback and is driven by a combination of retinal and extra-retinal signals, the eye trajectory in the ~125-ms time interval before feedback can arrive is generated purely from estimates of the target’s motion, using visual inputs present before the onset of the response11. At least for perception, these estimates are not perfect: humans and non-human primates can make reliable visual discriminations only among trajectories that differ by ~10% in speed and ~2–3° in direction12–17. Perceptual discrimination thresholds are limited by noise in neural activity in sensory areas: estimates of speed and direction will fluctuate from trial to trial as the brain tries to decode this noisy representation18,19.
Figure 1. Example of the variability in pursuit for a given target motion.
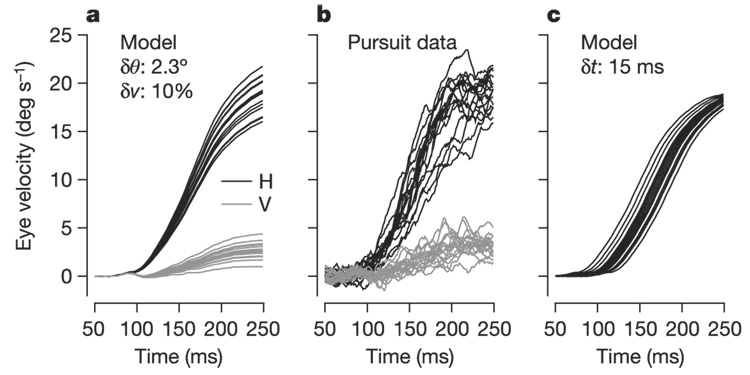
a, Model data created from the mean pursuit-velocity time course, averaged over 184 repetitions of the same target motion. For each trace, the mean trajectory was rotated and scaled by a gaussian distributed ‘noise’ value, the standard deviation of which matches perceptual discrimination threshold values for direction and speed in human subjects (2.3° and 10%). b, Actual data showing 18 individual pursuit trials. c, Model data created by taking the same mean pursuit trajectory and jittering its start time by a gaussian distributed shift value with a standard deviation of 15 ms. Black and grey lines in a and b distinguish the horizontal (H) and vertical (V) components of eye velocity; only horizontal eye velocity is shown in c. Time is measured relative to target motion onset.
If the brain’s estimate of speed on one trial is larger than the mean (as the result of noise), then the goal of the movement on this trial will be indistinguishable from that for a genuinely faster target speed, and the corresponding commands to the eyes will drive proportionately larger eye accelerations and velocities. Similar considerations apply to errors in direction. Figure 1a shows an ensemble of eye-velocity trajectories generated by random scalings and rotations of the mean trajectory of eye velocity for target motion that steps from 0 to 20° s−1 in a rightward direction rotated 9° above the horizontal; the standard deviations of these scalings and rotations were chosen to match the sensory noise levels of 10% and 2.3°. For comparison, in Fig. 1b we show an ensemble of actual pursuit trajectories in response to repeated presentations of the same direction of target motion; these trials are interspersed with target motions in other directions to eliminate the possibility of prediction and to force pursuit to be guided by estimates of visual motion. Comparison of the synthetic and actual trajectories reveals that noise on the scale that limits perceptual discrimination is sufficient to generate variation in motor output that is close to what we see experimentally.
To generate appropriate motor outputs, the brain must represent when the target starts moving, in addition to estimating the speed and direction of target motion. In our experiments, target motion begins at a random time relative to the onset of a fixation spot. On average, the trajectory of smooth pursuit seems to be locked to the trajectory of the target. On a given single trial, however, the brain lacks a perfect marker of the time of target motion onset, and so it must be estimated. In contrast to direction and speed, little is known about the limits of perceptual discrimination of motion timing. In Fig. 1c we illustrate the consequences of errors in timing estimation. A standard deviation of just 15 ms produces a variation in eye movement trajectories that is larger than we see in experiments (Fig. 1b), suggesting that the timing of target motion must be represented with a precision of better than 15 ms.
The results of Fig 1a–c motivate the hypothesis that variability in smooth-pursuit trajectories is dominated by errors in sensory estimation. More formally: imagine that there is an ideal (vector) eye-velocity trajectory videal(t; t0, ν, θ) in response to a target that starts to move at time t0 at speed ν and in direction θ. On any single trial, the brain has access only to noisy estimates of these parameters so that it makes errors δt0, δν and δθ. Then, the actual eye movements will be videal(t; t0 + δt, ν + δν, θ + δθ). We assume that errors are small, so that we can approximate the consequences of changing parameters just by the first term in a Taylor series. Also, closer inspection of Fig. 1b reveals that the trial-to-trial fluctuations in trajectory include a more rapidly fluctuating component that is ‘background noise’, visible even before the initiation of pursuit: δvback(t). Putting the terms together, we formalize the predicted trajectory in a natural, sensory space for a single trial as:
| (1) |
In equation (1), videal can be recovered by averaging the actual trajectories over many trials, and the various derivatives can be extracted from the data without any further assumptions (see Methods for details).
The predictions of equation (1) can be tested by examining the covariance matrix of trial-to-trial fluctuations in eye velocity, shown in Fig. 2d. At times before the initiation of pursuit (yellow square), the covariance matrix should describe the background noise δvback(t). After the initiation of pursuit (green square), there should be exactly three additional components that reflect the variances in δt0, δθ and δν. Experimentally (see Methods), we sampled the horizontal and vertical components of the vector velocity v(t) with 1-ms resolution throughout a 125-ms window after the initiation of pursuit, so that a single trajectory is described by 250 numbers. The covariance matrix of the background noise has the symmetric structure expected for stationary fluctuations, with ~80 eigenvalues that are significantly different from zero. In the time domain, the noise has significant components with a correlation time of less than 10 ms (Fig. 2a) and the distribution of noise velocities is nearly gaussian (Fig. 2b). In contrast, the matrix ΔC formed by subtracting the background covariance matrix (Fig. 2d, yellow box) from that for the first 125 ms of pursuit (Fig. 2d, green box) has just three eigenvalues that are significantly different from zero (Fig. 2c). The eigenvectors corresponding to these eigenvalues span the same three-dimensional space defined by the three derivatives of videal(t) in equation (1). As summarized in Table 1, 93 ± 1.4% of the variance in trajectories is captured by these three eigenvectors, which in turn have 96–99% overlap with axes corresponding to errors in estimating target speed, direction and timing.
Figure 2. Analysis of variation in pursuit trajectory for a single day’s experiment.

a, Temporal structure of correlation in eye-velocity variations before the onset of pursuit. Colours in key and traces labelled hh, vv and hv compare horizontal or vertical eye velocity to themselves or to each other (hv). b, Logarithm of probability density (red) and the best-fitting Gaussian curve (black) for the variations in eye velocity (in units of standard deviation, σ) before the onset of target motion. Error bars are s.d. divided by the mean. c, Rank order of the 250 normalized eigenvalues for ΔC. Standard deviations are smaller than the size of the symbols. d, Covariance matrix showing how the variation in horizontal eye velocity at any given time was related to that at all other times.
Table 1.
Relationship between the eigenvectors of the covariance matrix ΔC and the axes of target direction, speed and motion-onset time
| Fraction of total variance | Fractional overlap with rotation vdir(t) (direction noise) | Fractional overlap with scaling vspeed(t) (speed noise) | Fractional overlap with time shifts vtime(t) (timing noise) | |
|---|---|---|---|---|
| Mode 1 | 0.7409 ± 0.0064 | 0.0001 ± 0.0002 | 0.9343 ± 0.005 | 0.8684 ± 0.0068 |
| Mode 2 | 0.1150 ± 0.004 | 0.0062 ± 0.0057 | 0.0604 ± 0.005 | 0.1141 ± 0.0064 |
| Mode 3 | 0.0586 ± 0.0026 | 0.9594 ± 0.0093 | 0.0013 ± 0.0008 | 0.0000 ± 0.0006 |
| Total (3 modes) | 0.9145 ± 0.0523 | 0.9657 ± 0.0062 | 0.9960 ± 0.0071 | 0.9825 ± 0.0093 |
| Average (n = 9) | 0.9326 ± 0.0143 | 0.9557 ± 0.0255 | 0.9961 ± 0.0097 | 0.9725 ± 0.0152 |
The top four rows show the analysis of the thee eigenvectors or ‘modes’ that accounted for the largest percentage of the variance of pursuit, and the totals across the three largest modes for a single experiment. The bottom row shows the average of the totals across the three largest modes for nine experiments. From left to right, columns give the percentage of the total variance, and the projections from the natural axes describing errors in the estimates of direction, speed and time onto the eigenvectors of the covariance matrix ΔC. Errors indicate standard deviations.
The observation of just three significantly non-zero eigenvalues for ΔC means that the variability of smooth-pursuit trajectories is effectively limited to three dimensions. As explained in the Methods, this collapse of dimensionality is enormously unlikely to have occurred by chance. Even though a number of motor behaviours have been shown to have similar low-dimensional structures5–7, several aspects of our results seem novel. First, the low dimensionality cannot be interpreted as a limitation of the motor system itself, as the eye movement motor system is observed to generate trajectories that fill ~80 dimensions under the different conditions of fixation before the onset of pursuit. Second, the particular three dimensions in which the system operates are not arbitrary, but in fact are those predicted in advance. Finally, the magnitudes of the fluctuations in the three relevant directions have a clear physical and biological meaning in relation to the parameters used to specify visual motion.
In Fig. 3, we show how the three dimensions corresponding to speed, direction and timing errors can be used to synthesize the eye-movement trajectory on a single trial. Starting with the mean trajectory (Fig. 3a, dashed traces), we add components for each of the three natural modes (Fig. 3b), scaled by particular values of δν, δθ and δt0 (arrowheads in Fig. 3c) to create accurate predictions (Fig. 3a, red and blue traces) of eye-velocity responses from individual trials (Fig. 3a, solid black and grey traces). We derived distributions of the values of δν, δθ, and δt0 by performing the same projection for each individual pursuit response in the data set onto the natural modes (Fig. 3c); the distributions are approximated well by gaussians. Furthermore, the residual differences between actual and predicted responses have a distribution that agrees substantially with the distribution of background noise (grey versus black distributions in Fig. 3d). The agreement between the distributions of the background noise and the residuals of trial-by-trial reconstructions from the three natural modes is a restatement of our results on the eigenvalues and eigenvectors of ΔC, but presents the results in a different, and perhaps more intuitive, form.
Figure 3. Reconstruction of individual pursuit trials from the model described by equation (1).
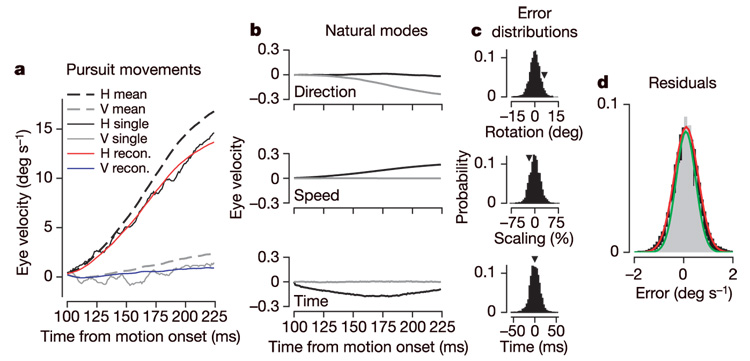
a, Eye velocity as a function of time for the mean trajectory, and for the actual and reconstructed trajectory for a single trial. b, Time courses of the sensory noise modes (vdir, vspeed, vtime) in units of eye velocity per equivalent sensory error. c, Distributions of δθ, δν and δt0 for 184 responses to the same target trajectory. Arrowheads indicate the values of the errors used to reconstruct the single trial in a. d, Distributions of difference between actual and predicted eye velocity during pursuit (black) and the total noise present during fixation (grey), along with best-fitting gaussian functions (red, green).
In a total of nine experiments with three monkeys (pk, yo and wt) direction and speed errors had standard deviations of 2.1–3.5° and 11–18%, respectively. Each daily experiment involved a total of more than 1,000 trials, so statistical errors within a single experiment are much smaller than variations among experiments. The precision of pursuit behaviour correlates well with the results from perceptual experiments15,20. For brief stimulus presentations like the ones used here (~125 ms), human subjects12–13 have thresholds of Δθ ≈ 2.3° in direction and Δν/ν ≈ 10% in speed. Longer stimulus presentations have been used for perceptual experiments in monkeys, yielding thresholds nearly identical to those in humans16–17. Within the bounds of measurement error and differences in stimulus presentation, we conclude that the limits in precision for pursuit and perception are very similar.
For 200-ms stimulus presentations, human discrimination thresholds12,14–15 and the limits to precision inferred from the variability of pursuit trajectories improve, and are even more similar. However, on timescales longer than the ~125 ms we have considered, the sensory–motor feedback loop for pursuit has been closed, complicating the comparison. For example, studies of perceptual and closed-loop motor variability in smooth pursuit reach opposite conclusions: both find that perception and pursuit have similar degrees of variability, but one addressing motion direction finds evidence for a common noise source20, whereas another experiment addressing motion speed errors does not15. Because steady-state tracking is driven largely by extra-retinal signals, the absence (or presence) of covariation between perceptual and pursuit errors during steady-state tracking does not speak to the question of whether the errors in perceptual and motor readouts of visual motion arise from the same noise source.
The analysis of timing errors deserves special consideration. As hinted at by the results in Fig. 1c, the standard deviation of these timing errors is quite small, 7–10 ms across our set of nine experiments (Table 2). This is much smaller than the range of reaction times for discrete movements such as saccades21. Thus, even though the time of onset of target motion is not known to the brain a priori, the pursuit system is able to estimate that time with remarkable precision. Given the small number of spikes that are emitted by neurons in the MT region of the visual cortex in response to the first 100 ms of target motion22, the neural mechanisms that decide when to initiate a movement23,24 must be able to do so on the basis of the timing of just a few spikes.
Table 2.
Limits to precision in the sensory estimates driving smooth pursuit
| Experiment | Target speed (° s−1) | Fraction of variance | δθrms (°) | δvrms/v | δtrms (ms) | C(δv; δt) |
|---|---|---|---|---|---|---|
| pk121603 | 20 | 0.915 ± 0.002 | 2.48 ± 0.04 | 0.129 ± 0.002 | 8.3 ± 0.1 | 0.09 ± 0.02 |
| pk032404 | 20 | 0.904 ± 0.005 | 2.34 ± 0.05 | 0.123 ± 0.002 | 7.9 ± 0.1 | 0.23 ± 0.01* |
| pk041004 | 20 | 0.924 ± 0.002 | 2.99 ± 0.05 | 0.158 ± 0.002 | 10.8 ± 0.2 | 0.25 ± 0.02* |
| wt112102 | 20 | 0.894 ± 0.004 | 2.86 ± 0.1 | 0.173 ± 0.005 | 10.2 ± 0.3 | 0.29 ± 0.03* |
| yo082603 | 15 | 0.932 ± 0.005 | 2.40 ± 0.07 | 0.177 ± 0.004 | 9.4 ± 0.3 | 0.10 ± 0.03 |
| yo082203 | 10 | 0.936 ± 0.005 | 3.5 ± 0.1 | 0.181 ± 0.003 | 9.5 ± 0.3 | 0.07 ± 0.03 |
| yo082703 | 25 | 0.929 ± 0.003 | 2.33 ± 0.06 | 0.172 ± 0.002 | 10.8 ± 0.2 | 0.22 ± 0.02* |
| pk021504 | 30 | 0.915 ± 0.002 | 2.14 ± 0.03 | 0.112 ± 0.002 | 8.3 ± 0.1 | 0.29 ± 0.02* |
| pk032504 | 10 | 0.913 ± 0.01 | 3.45 ± 0.08 | 0.162 ± 0.003 | 8.4 ± 0.2 | − 0.08 ± 0.03 |
Each row shows data for one experiment analysing 125 ms of pursuit initiation. Columns show the target speed for the experiment; the fraction of the total variance accounted for by the noise attributed to sensory estimates of target direction, speed and the time of motion onset; the limits to precision in direction, speed and time defined by the root mean squared (rms) variation along the axis defined by each parameter; and the correlation between speed and timing noise (statistical significance indicated by asterisk). Target directions ranged within ±9° for all experiments except wt112102, which had a range of ±6°. Correlations were zero between direction and speed noise, and between direction and timing noise. Errors indicate standard deviations.
We can think of the timing error δt0 as a measure of latency relative to the mean that looks for the best fit of a template to the whole 125-ms open-loop segment of the eye-velocity trajectory rather than (for example) the traditional measure of latency as the moment at which the eye velocity rises significantly above background noise. Although correlations between variations in direction and speed would imply a ‘handedness’ to the pursuit system that seems implausible, there is no symmetry that forbids correlations between variations in timing and speed. Indeed, we observe significant speed–timing correlations in many experiments (Table 2). The sign of the correlations corresponds to ‘start later–go faster’, but because we are analysing the open-loop response of pursuit, there is no feedback signal to ensure that late starts are compensated for by larger eye accelerations. Thus, it seems likely that the correlation between variations in speed and timing is intrinsic to the estimation or representation of motion in the visual system. In decomposing errors into direction, speed and timing components, it is important to account (as we do) for the fact that although direction and speed errors make orthogonal contributions to the pursuit trajectory, speed and timing errors do not. Instead, they point oppositely along similar axes in the three-dimensional space. This explains why speed and time have similar magnitude projections onto modes 1 and 2 of ΔC, but with a sign difference that disambiguates ‘moving faster’ from ‘starting earlier’.
Other studies have shown that eye movements and perception share neural pathways and have access to the same sensory estimates of visual motion13,14,16–18,20,25. Demonstrations of the limits to perceptual discrimination of target direction and speed have revealed that there is noise in the sensory inputs. We have shown that essentially the entire motor variation that is specific to pursuit lies along the axes of the sensory parameters of target direction, speed and timing, and that the limits to precision of pursuit are nearly the same as those for perception. An appealing and simple conclusion is that the initial response of the pursuit system adds little additional noise beyond the variations in sensory estimates, and thus its precision is defined by the noise in the sensory representations. Our findings do not indicate whether the precision of sensory representations of visual motion is limited by noise arising in the retina, or whether it accumulates along motion-sensitive neural pathways. Whatever its origin, we imagine that the variability we observe in pursuit initiation is reflected in the responses of cortical neurons (for example, in MT/V5).
We have predicted the structure of variations in the initiation of pursuit from first principles, and have provided data that are consistent with, but do not prove, the hypothesis that variation in initiation of pursuit arises largely from the sensory representation of visual motion. Further testing is needed to rule out alternatives in which a precise representation of target motion is degraded by noise that accumulates independently along perceptual and motor pathways. These alternatives require that noise added in the motor system preserve the sensory form and have a magnitude similar to that measured for perception. In the simplest concrete alternative, motor output variation is dominated by trial-by-trial fluctuation in the strength of commands sent to the eye muscles. But this model does not provide an explanation of the low-dimensionality of the noise, except by assuming a similar low dimensionality in the gain noise—that is, that the fluctuating components of the commands affect the entire 125-ms trajectory uniformly. More detailed computations show that the magnitude of the gain fluctuations must be tuned differently for each direction of motion to account quantitatively for the data. Finally, any model that ascribes the observed behavioural variability largely to the motor side of the nervous system must explain why the inferred gain variations are so large when the variability of motor neuron discharge is so small26.
The overlap of the significant dimensions of pursuit variation with those expected from the parameters of the motion trajectory may have important implications for the operating principles of the brain’s motor circuits. The agreement between the limits to precision in pursuit and perceptual behaviour biases us to think that sensory processing is the main contributor to variability in pursuit trajectory, and that other sources of noise in the system are effectively smaller, perhaps because motor strategies are selected to minimize other noise sources4,8. That variation in pursuit behaviour can be assigned largely to noise in representation of the sensory stimulus may fit with other examples in which the nervous system achieves optimal or near-optimal performance27–29.
METHODS
Eye movements were recorded11 from three male rhesus monkeys (Macaca mulata) that had been trained to fixate and track visual targets. Experiments lasted 2–3 h, during which the monkey sat in a specialized primate chair with its head immobilized, and received a juice or water reward for accurately tracking visual targets presented on a screen in front of it. All procedures had been approved by the Institutional Animal Care and Use Committee of the University of California, San Francisco and were in compliance with the National Institutes of Health Guide for the Care and Use of Laboratory Animals.
The visual target was typically a 0.8° square spot presented in a dimly lit room on a high-resolution analogue display oscilloscope that subtended a 48° by 38° visual angle. Experiments were presented as a series of trials, each representing a single target motion. Each trial began with the monkey fixating a stationary target at centre-screen for a random interval of 700–1,200 ms. The target then underwent a step-ramp motion11 with steps of 2.5–3.7° and ramped back towards the extinguished fixation point at a constant speed, typically 20° s−1. Directions were chosen randomly from up to 14 directions (that is, −9° to +9° relative to horizontal, in 3° increments). Parameters of target motion were varied so that they were presented in random order.
Vertical and horizontal eye-velocity signals were passed though an analogue double-pole, low-pass filter that differentiated frequencies below 25 Hz and rejected higher frequencies with a roll-off of 20 dB per decade. Eye-position and velocity signals were sampled and stored at 1 kHz. Before analysis, each trial record was inspected and rejected if a saccade occurred within the time-window chosen for analysis. Data sets consisted of eye velocity responses to 112–223 repetitions of target motion in each direction. The time-window for analyses of ‘background’ data began 125 ms before target motion and ended with the onset of target motion. The 125-ms time-window for pursuit analyses began at eye-movement onset, determined by the intersection of two lines each fitted to pre- and post-pursuit intervals of average responses. Standard deviations were computed from analyses based on 40–50 random draws of half of the data set.
To recover the ideal trajectory videal(t; t0, ν, θ) (equation (1)), we averaged eye velocity over many responses to the same target motion. To compute the derivatives in equation (1), we took advantage of symmetries. First, changing the onset time t0 should be equivalent to translating the response along the time axis of the ideal trajectory, so that vtime = ∂videal/∂t0 = −∂videal/∂t. Second, changes in target speed should produce ideal trajectories that are uniformly scaled to be proportionately faster or slower, at least over a narrow dynamic range11, so that vspeed = ∂/∂ν[(ν/ν0)videal]. Finally, changes in target motion direction should produce rotations of the ideal trajectory. We checked this last symmetry using principal component analysis of mean trajectories in response to (typically) 14 different directions. As expected if the changing target direction simply rotates the ideal response trajectory, there were just two principal components, corresponding roughly to horizontal and vertical pieces of the ideal trajectory. Furthermore, the reconstruction of the mean trajectories for different directions combined these components with coefficients that corresponded to the sines and cosines of the relevant directions. Therefore, we were able to identify vdir = ∂videal/∂θ with (∂R̂(θ)/∂θ)θ=0·videal, where R̂(θ) is the matrix representing rotation through an angle θ.
To analyse deviations from ideal behaviour on individual trials, we subtracted the mean response for a given target direction from each individual pursuit trial to form a noise vector. We computed the temporal covariance of pursuit noise across all trials (a 250 × 250 matrix), and then subtracted the covariance of the background to form ΔC. We tested alternative noise models to confirm that the low-dimensional structure we observed in ΔC did not arise from our choice of ‘background’ noise. First, we used a ‘white’ noise model in which errors were independent in 1-ms bins, and eye-velocity variance grew as a function of the mean eye velocity4: ΔC had 80 to 90 significant eigenvalues. Second, we preserved the form of temporal correlations in eye velocity during fixation (Fig. 2a), again with variances that scaled with the mean response: the three dominant eigenvalues captured only 67.5% of the variance and the axes defined by speed, direction and time accounted for less than half of the total variance. Statistical analysis of these models confirmed that the observed low-dimensional structure of trial-by-trial variations in the pursuit trajectory had a very low probability of occurring by chance ( < 10−5).
Acknowledgements
This work was supported in part by a National Institutes of Health Grant and by the Howard Hughes Medical Institute. We thank S. Tokiyama, E. Montgomery and K. MacLeod for assistance with animal monitoring and maintenance, and S. Ruffner for computer programming. W.B. thanks the Sloan-Swartz Center at UCSF for its hospitality during critical stages of this collaboration.
References
- 1.Fitts PM. The information capacity of the human motor system in controlling the amplitude of movement. J. Exp. Psychol. 1954;47:381–391. reprinted in. J. Exp. Psychol. 121, 262--269 (1992) [PubMed] [Google Scholar]
- 2.Gordon J, Ghilardi MF, Ghez C. Accuracy of planar reaching movements. I. Independence of direction and extent variability. Exp. Brain Res. 1994;99:97–111. doi: 10.1007/BF00241415. [DOI] [PubMed] [Google Scholar]
- 3.Messier J, Kalaska JF. Comparison of variability of initial kinematics and endpoints of reaching movements. Exp. Brain Res. 1999;125:129–152. doi: 10.1007/s002210050669. [DOI] [PubMed] [Google Scholar]
- 4.Harris CM, Wolpert DM. Signal-dependent noise determines motor planning. Nature. 1998;394:780–784. doi: 10.1038/29528. [DOI] [PubMed] [Google Scholar]
- 5.d'Avella A, Bizzi E. Low dimensionality of surpaspinally induced force fields. Proc. Natl Acad. Sci. USA. 1998;95:7711–7714. doi: 10.1073/pnas.95.13.7711. [DOI] [PMC free article] [PubMed] [Google Scholar]
- 6.Santello M, Flanders M, Soechting JF. Postural hand strategies for tool use. J. Neurosci. 1998;18:10105–10115. doi: 10.1523/JNEUROSCI.18-23-10105.1998. [DOI] [PMC free article] [PubMed] [Google Scholar]
- 7.Sanger TD. Human arm movements described by a low-dimensional superposition of principal components. J. Neurosci. 2000;20:1066–1072. doi: 10.1523/JNEUROSCI.20-03-01066.2000. [DOI] [PMC free article] [PubMed] [Google Scholar]
- 8.Todorov E, Jordan MI. Optimal feedback control as a theory of motor coordination. Nature Neurosci. 2002;5:1226–1235. doi: 10.1038/nn963. [DOI] [PubMed] [Google Scholar]
- 9.Donchin O, Francis JT, Shadmehr R. Quantifying generalization from trial-by-trial behaviour of adaptive systems that learn with basis functions: theory and experiments in human motor control. J. Neurosci. 2003;23:9032–9045. doi: 10.1523/JNEUROSCI.23-27-09032.2003. [DOI] [PMC free article] [PubMed] [Google Scholar]
- 10.Lisberger SG, Morris EJ, Tyschen L. Visual motion processing and sensory-motor integration for smooth pursuit eye movements. Annu. Rev. Neurosci. 1987;10:97–129. doi: 10.1146/annurev.ne.10.030187.000525. [DOI] [PubMed] [Google Scholar]
- 11.Lisberger SG, Westbrook LE. Properties of visual inputs that initiate horizontal smooth pursuit eye movements in monkeys. J. Neurosci. 1985;5:1662–1673. doi: 10.1523/JNEUROSCI.05-06-01662.1985. [DOI] [PMC free article] [PubMed] [Google Scholar]
- 12.de Bruyn B, Orban GA. Human velocity and direction discrimination measured with random dot patterns. Vision Res. 1988;28:1323–1335. doi: 10.1016/0042-6989(88)90064-8. [DOI] [PubMed] [Google Scholar]
- 13.Watamaniuk SNJ, Heinen SJ. Human smooth pursuit direction discrimination. Vision Res. 1999;39:59–70. doi: 10.1016/s0042-6989(98)00128-x. [DOI] [PubMed] [Google Scholar]
- 14.Kowler E, McKee SP. Sensitivity of smooth eye movement to small differences in target velocity. Vision Res. 1987;27:993–1015. doi: 10.1016/0042-6989(87)90014-9. [DOI] [PubMed] [Google Scholar]
- 15.Gegenfurter KR, Xing D, Scott BH, Hawken MJ. A comparison of pursuit eye movement and perceptual performance in speed discrimination. J. Vis. 2003;3:865–876. doi: 10.1167/3.11.19. [DOI] [PubMed] [Google Scholar]
- 16.Purushothaman G, Bradley DC. Neural population code for fine perceptual decisions in area MT. Nature Neurosci. 2005;8:99–106. doi: 10.1038/nn1373. [DOI] [PubMed] [Google Scholar]
- 17.Liu J, Newsome WT. Correlation between speed perception and neural activity in the medial temporal visual area. J. Neurosci. 2005;25:711–722. doi: 10.1523/JNEUROSCI.4034-04.2005. [DOI] [PMC free article] [PubMed] [Google Scholar]
- 18.Newsome WT, Britten KH, Movshon JA. Neuronal correlates of a perceptual decision. Nature. 1989;341:52–54. doi: 10.1038/341052a0. [DOI] [PubMed] [Google Scholar]
- 19.Green DM, Swets JA. Signal Detection Theory and Psychophysics. New York: Wiley; 1966. [Google Scholar]
- 20.Stone LS, Krauzlis RJ. Shared motion signals for human perceptual decisions and oculomotor actions. J. Vis. 2003;3:725–736. doi: 10.1167/3.11.7. [DOI] [PubMed] [Google Scholar]
- 21.Carpenter RHS. In: Eye Movements: Cognition and Visual Perception. Fisher DF, Monty RA, Senders JW, editors. Hillsdale, New Jersey: Lawrence Erlbaum Associates; 1981. pp. 237–246. [Google Scholar]
- 22.Osborne LC, Bialek W, Lisberger SG. Time course of information about motion direction in visual area MT. J. Neurosci. 2004;24:3210–3222. doi: 10.1523/JNEUROSCI.5305-03.2004. [DOI] [PMC free article] [PubMed] [Google Scholar]
- 23.Roitman JD, Shadlen MN. Response of neurons in the lateral intraparietal area during a combined visual discrimination reaction time task. J. Neurosci. 2002;22:9475–9489. doi: 10.1523/JNEUROSCI.22-21-09475.2002. [DOI] [PMC free article] [PubMed] [Google Scholar]
- 24.Hanes DP, Schall JD. Neural control of voluntary movement initiation. Science. 1996;274:427–430. doi: 10.1126/science.274.5286.427. [DOI] [PubMed] [Google Scholar]
- 25.Ross J, Morrone MC, Goldberg ME, Burr DC. Changes in visual perception at the time of saccades. Trends Neurosci. 2001;24:316–318. doi: 10.1016/s0166-2236(00)01685-4. [DOI] [PubMed] [Google Scholar]
- 26.Fuchs AF, Luschei ES. Firing patterns of abducens neurons of alert monkeys in relationship to horizontal eye movement. J. Neurophysiol. 1970;33:382–392. doi: 10.1152/jn.1970.33.3.382. [DOI] [PubMed] [Google Scholar]
- 27.Bialek W. In: Physics of Biomolecules and Cells: Les Houches Session LXXV. Flyvbjerg H, Julicher F, Ormos P, David F, editors. Les Ulis and Springer-Verlag, Berlin: EDP Sciences; 2002. pp. 485–577. [Google Scholar]
- 28.Bialek W. Physical limits to sensation and perception. Annu. Rev. Biophys. Biophys. Chem. 1987;16:455–478. doi: 10.1146/annurev.bb.16.060187.002323. [DOI] [PubMed] [Google Scholar]
- 29.Barlow HB. Critical limiting factors in the design of the eye and visual cortex. Proc. R. Soc. Lond. B. 1981;212:1–34. doi: 10.1098/rspb.1981.0022. [DOI] [PubMed] [Google Scholar]