

Abstract
Deficits in the ability to suppress automatic behaviors lead to impaired decision making, aberrant motor behavior, and impaired social function in humans with frontal lobe neurodegeneration. We have studied patients with different patterns of frontal lobe dysfunction resulting from frontotemporal lobar degeneration or Alzheimer's disease, investigating their ability to perform visually guided saccades and smooth pursuit eye movements and to suppress visually guided saccades on the antisaccade task. Patients with clinical syndromes associated with dorsal frontal lobe damage had normal visually guided saccades but were impaired relative to other patients and control subjects in smooth pursuit eye movements and on the antisaccade task. The percentage of correct antisaccade responses was correlated with neuropsychological measures of frontal lobe function and with estimates of frontal lobe gray matter volume based on analyses of structural magnetic resonance images. After controlling for age, gender, cognitive status, and potential interactions between disease group and oculomotor function, an unbiased voxel-based morphometric analysis identified the volume of a segment of the right frontal eye field (FEF) as positively correlated with antisaccade performance (less volume equaled lower percentage of correct responses) but not with either pursuit performance or antisaccade or visually guided saccade latency or gain. In contrast, the volume of the presupplementary motor area (pre-SMA) and a portion of the supplementary eye fields correlated with antisaccade latency (less volume equaled shorter latency) but not with the percentage of correct responses. These results suggest that integrity of the presupplementary motion area/supplementary eye fields is critical for supervisory processes that slow the onset of saccades, facilitating voluntary saccade targeting decisions that rely on the FEF.
Keywords: antisaccade, smooth pursuit, frontotemporal lobar degeneration, presupplementary motor area, supplementary eye field, frontal eye field, brain volume
Introduction
The ability to suppress reflexive or automatic behaviors is an important component of normal human brain function and is integral to a variety of cognitive, motor, and behavioral processes. The antisaccade task (Hallet, 1978) is a well understood task that models voluntary suppression of reflex behavior. It requires subjects to suppress a visually guided saccade and instead program a saccade to a nonexistent target in the opposite direction (Everling and Fischer, 1998). A better understanding of the neural mechanisms of antisaccade control would help to reveal the basic mechanisms of human executive function. Thus, antisaccades could provide a model system for understanding how aging and brain diseases impair the ability to perform cognitive tasks that are necessary for independent living (Buckner, 2004).
Suppression of visually guided saccades on the antisaccade task relies heavily on a neural network within the frontal cortex (Munoz and Everling, 2004). Studies of human patients with focal brain lesions strongly implicate dorsal prefrontal brain regions, particularly the dorsolateral prefrontal cortex (DLPFC), as necessary for antisaccade network function (Guitton et al., 1985; Pierrot-Deseilligny et al., 1991, 2003; Walker et al., 1998). Experiments using functional magnetic resonance imaging (fMRI) have identified the frontal eye fields (FEFs), supplementary eye fields (SEFs), presupplementary motor area (pre-SMA), superior frontal sulcus, and the DLPFC as nodes within the antisaccade circuit (Connolly et al., 2002; Curtis and D'Esposito, 2003; Ford et al., 2005). Why is such a large network of frontal lobe brain regions activated before antisaccades if only the DLPFC is necessary for accurate task performance (Pierrot-Deseilligny et al., 2003)? These two approaches are sensitive to different aspects of the operation of a neural circuit. Lesion studies define the degree to which a given area of the brain is necessary for a function but are limited in their ability to explore the interactions among all network nodes. In contrast, fMRI can identify multiple components of a neural network simultaneously but is more limited in its ability to determine the functional importance of each node.
Our goal was to explore whether deficits in antisaccade behavior could be assigned to degeneration of specific regions within the relevant circuit, using methods that directly correlate alterations in the structure of all potential components of the frontal lobe voluntary saccade network with measures of oculomotor performance. Impairment in the ability to perform the antisaccade task is a sensitive marker of dementia (Currie et al., 1991; Shafiq-Antonacci et al., 2003; Crawford et al., 2005; Mosimann et al., 2005) and has been recently described in one clinical variant of frontotemporal lobar degeneration (FTLD) (Meyniel et al., 2005). To expand on this observation, we compared the oculomotor abilities of patients with FTLD and Alzheimer's disease (AD), and correlated individual-by-individual variation in oculomotor performance with the pattern of brain atrophy measured on structural MRI scans of the brain. We found that the volume of a segment of the right FEF is positively correlated with the percentage of correct antisaccade responses while the volume of the pre-SMA and a portion of the SEF is negatively correlated with antisaccade latency.
Materials and Methods
Subjects.
All subjects were evaluated at the University of California, San Francisco Memory and Aging Center and gave informed consent to participate in the experimental procedures. For demented individuals who could not give informed consent because of their degree of cognitive impairment, a surrogate consenting procedure was used. Subjects underwent neurological examination, neuropsychological testing, and brain MRI scans within 3 months of eye movement evaluation and were categorized as control, AD, or FTLD subjects. FTLD is a common dementia that appears most frequently in patients <65 years old and is associated with degeneration of the frontal and anterior temporal lobes, with relative sparing of more posterior cortical regions. FTLD manifests as one of three clinical syndromes (Boxer et al., 2005): (1) a behavioral/dysexecutive syndrome or frontal lobe variant known as frontotemporal dementia (FTD), (2) a temporal lobe variant with semantic memory loss, known as semantic dementia (SD), or (3) a progressive nonfluent aphasia (PA). Each clinical syndrome is associated with a different pattern of brain atrophy that can be measured quantitatively on MRI scans. FTD is associated with prominent frontal lobe tissue loss that is more prominent on the right side; in SD, the damage is more restricted to anterior temporal and ventral frontal lobe structures; PA is associated with frontal lobe atrophy that is more prominent on the left side, often extending from anterior insular cortex to dorsolateral frontal lobe structures (Rosen et al., 2002; Gorno-Tempini et al., 2004; Boxer et al., 2005). Our FTLD subjects met the criteria of Neary et al. (1998) for FTD, SD, or PA. AD subjects met National Institute of Neurological and Communicative Disorders and Stroke–Alzheimer's Disease and Related Disorders Association criteria for probable AD (McKhann et al., 1984). Normal subjects had no neurological complaints, normal neurological and neuropsychological examinations, and clinical dementia rating (CDR) scores of 0 (Morris, 1993), except for one control subject with a CDR score of 0.5 but normal performance on neuropsychological tests. Our subject population contained 20 control, 14 FTD, 10 SD, 7 PA, and 18 AD subjects.
Eye movement recordings.
Movements of the right eye were recorded in a dark room, using a Dual Purkinje Image Eye Tracker (Generation 6.1; Fourward Systems, Roanoke, VA). The spatial and temporal resolutions of the eye tracker were 0.5 deg and 1 ms. Targets consisted of white spots of 0.1 deg visual angle presented on an analog oscilloscope situated 80 cm from the subject's head. The subject's head was stabilized using chin and forehead rests and a head strap. Data were sampled at 1000 Hz on each channel and stored for off-line analysis.
Experiments were conducted as a series of trials separated by intertrial intervals of 800–1000 ms, in which each trial might deliver a stimulus for smooth pursuit eye movements, saccades, or antisaccades in blocks with clear instructions to the subjects. Saccade trials consisted of randomly interleaved 5 and 10 degree targets presented up, down, left, or right of a central fixation point. Each trial began with illumination of a central fixation spot for a variable duration of 500–1000 ms. When the fixation light was extinguished targets appeared either immediately (overlap condition) or after a 200 ms gap (gap condition, horizontal trials only). At least seven responses were recorded for each stimulus. To minimize the contribution of lens shift artifacts from the Purkinje tracker (Deubel and Bridgeman, 1995), mean saccadic velocity was estimated as the change in eye position divided by the duration of the saccade. Analysis of selected data showed the same effects, but higher values, in measurements of peak eye velocity obtained by differentiation of the eye position record. Saccade latencies were computed as the duration of the interval from the appearance of an eccentric target to the onset of the saccade.
Pursuit eye movements were evaluated in blocks of trials that delivered step-ramp target motion (Rashbass, 1961) in each of four directions (up, down, left, or right). Each pursuit trial began when a fixation spot was presented in the center of the screen for 1200–1900 ms. The spot then underwent a step displacement of 5 deg and a smooth ramp motion toward the position of fixation for 600–1200 ms at 20 deg/s. Each target motion was presented 10–15 times.
Data analysis for pursuit trials began with removal from the eye velocity traces of the rapid deflections caused by saccades. A cursor was moved along each eye velocity trace to point out the start and end of the rapid deflections, which then were excised and replaced with straight-line segments connecting the eye velocity before and after the saccade. The responses to identical stimuli then were aligned on the onset of target motion and the mean and SD of eye velocity were calculated at each sample point.
The mean eye velocity responses were used to estimate the latency, initial eye acceleration, and two estimates of gain for each target direction. The latency to onset of pursuit was defined as the time at which the amplitude of eye velocity was more than three SDs from the baseline velocity during fixation. The average eye acceleration for the first 100 ms of pursuit was determined by calculating the difference between eye velocity 100 ms after pursuit onset and eye velocity at the initiation of pursuit, divided by 100 ms. Peak gain was computed as the average of 10 points either side of the maximum eye velocity divided by the target speed. Finally, we calculated the mean gain as the average eye velocity for the period the target was moving divided by the target speed.
Antisaccades were evoked in separate blocks of trials with subjects given the instruction to “look away from the lateral target at a corresponding spot on the other side of the fixation point, and correct erroneous saccades in the direction of the target if possible.” A minus sign appeared briefly after the central fixation target was extinguished to remind subjects to look in the direction opposite to the target stimulus. After a 200 ms gap, targets appeared 10 degrees to the right or left. Responses were considered to be successful antisaccades if the first saccade after target onset had an amplitude >3 degrees and was in the opposite direction from the target. Antisaccade corrections were recorded as antisaccades that occurred within 500 ms of an initial erroneous prosaccade. Responses in at least 18 antisaccade trials were recorded in each direction.
Neuropsychological testing.
General intellectual function was assessed using the Mini-Mental State Examination (MMSE) (Folstein et al., 1975). The California Verbal Learning Test–Mental Status Version (Delis et al., 2000) was used to evaluate verbal episodic memory, and a modified version of the Rey-Osterrieth complex figure with a 10 min free-recall delay trial was used to evaluate nonverbal episodic memory. Language assessment included the abbreviated (15 item) Boston Naming Test (Kaplan et al., 1983), comprehension of seven syntactically complex commands and questions, repetition of three phonemically complex phrases, semantic fluency (animals in 1 min) and phonemic fluency (D-words in 1 min). Visuospatial assessment included copying the modified Rey-Osterrieth figure as well as trial 1 of the Design Fluency subtest of the Delis-Kaplan Executive Functions Scale (Delis et al., 2000). Tests of executive functioning included a visuomotor set-shifting and sequencing task [a modified version of the Trails B test (Reitan, 1958)], backwards digit span to assess working memory, and the Stroop interference task (Golden, 1978) to assess inhibition of an overlearned response. Ability to perform five arithmetic calculations was also assessed. Psychological status was measured using the Geriatric Depression Scale (Yesavage et al., 1983).
Statistics.
Group comparisons of demographic, neuropsychological, and functional ratings were accomplished with ANOVA or χ2 statistics. Previous studies (Stuphorn and Schall, 2002) indicated that eye movement latencies do not follow a normal distribution. We confirmed that the saccade and antisaccade latency distributions were not normally distributed using Q-Q plots. For this reason, we used nonparametric statistics (Kruskal–Wallis test) to identify significant group effects on eye movement latencies. Because methods for nonparametric multiple-comparisons corrections are not well developed, significant group effects were followed up with ANOVA with Tukey post hoc to find specific group differences in saccade and pursuit latency. To correct for multiple comparisons in the neuropsychological-oculomotor correlation analysis, the false discovery rate procedure was applied (Nichols and Hayasaka, 2003). Statistical analyses were performed using SPSS for Windows (version 12.0, SPSS, Chicago, IL) and SAS (SAS Institute, Cary, NC).
Magnetic resonance images.
MRI scans were obtained on a 1.5 T Magnetom Vision system (Siemens, Iselin, NJ) at the San Francisco VA Magnetic Resonance Unit, as described in a previous report (Rosen et al., 2002). Three-dimensional T1-weighted scans (magnetization-prepared rapid-acquisition gradient echo) were used for both the BRAINS2 and voxel-based morphometry (VBM) analyses described below.
For use of the BRAINS2 software package [Mental Health–Clinical Research Center at the University of Iowa (Magnotta et al., 2002)], the T1-weighted images were spatially normalized and resampled to 1.0 mm3 voxels. Next, the outermost boundaries of the cortex, as well as the anterior commissure and posterior commissure, were identified to warp the Talairach grid (Tailarach and Tournoux, 1988) onto the current brain. The T2- and PD-weighted images were then realigned to the spatially normalized T1-weighted image using an automated image registration program (Woods et al., 1992). The resampled images were segmented into gray matter, white matter, and CSF using the coregistered images and a discriminant analysis method. A brain mask was generated using a previously trained artificial neural network, and lobar volumes were then calculated using an automated Talairach-based method of regional classification (Magnotta et al., 2002). Finally, the lobar volumes were normalized to correct for differences in overall head size: the absolute lobar volume was multiplied by the average total intracranial volume (TIV) of the patient sample and then divided by the individual's TIV.
For VBM, images were preprocessed and statistically analyzed using the SPM2 software package (http://www.fil.ion.ucl.ac.uk/spm), using standard procedures (Ashburner and Friston, 2000; Good et al., 2001). For spatial normalization, a customized template was constructed from 40 age-matched control subjects. Affine and nonlinear transformations were applied to spatially normalize patients' and controls' images to the template. To improve image spatial preprocessing, the “optimized” two-step procedure was applied (Good et al., 2001). First, patient and control images were segmented in native space. Each gray matter image then was normalized to a gray matter template. The normalization parameters obtained from the gray-matter normalization then were applied to the original T1-weighted image. Finally, normalized T1 images were segmented again. Gray and white matter voxel values were multiplied by the Jacobian determinants derived from the spatial normalization step to preserve the initial volumes. Images then were spatially smoothed with a 12 mm full-width half-maximum isotropic Gaussian kernel. Regions of gray matter volume that correlated with oculomotor measurements were assessed using the general linear model and the significance of each effect was determined using the theory of Gaussian fields. A statistical threshold of p < 0.05 at the voxel level, corrected for multiple comparisons (family-wise error), was accepted for the main contrasts.
The relationship between oculomotor performance on saccade tasks and regional brain atrophy (as a surrogate measure of disease-related pathology) was modeled as an ANCOVA with age, gender, cognitive status (MMSE or backward digit span), and TIV as covariates of no interest. To decrease the chance of type I error (i.e., a false positive result attributable to an interaction between underlying brain pathology caused by aging, FTLD, or AD and oculomotor function), the VBM analysis controlled for potential oculomotor function by group (normal, FTLD, or AD) interactions. We did not use the individual FTLD clinical subtypes in the VBM analysis because the pattern of brain atrophy is closely related to FTLD clinical subtype, so controlling for clinical subtype would have greatly increased the chance of type II error attributable to potential colinearity between patterns of brain atrophy and subtype-specific effects on oculomotor performance. A less stringent analysis, which did not account for potential interactions between group and oculomotor performance, produced similar results to those we describe (same regions, more statistically significant because of larger number of degrees of freedom).
Because there was an a priori hypothesis that the percentage of correct antisaccade responses is related to the integrity of dorsal frontal lobe structures, the VBM analysis was limited to the bilateral dorsal frontal lobes by creating a mask using the WFU pickatlas [www.fmri.wfubmc.edu (Maldjian et al., 2004)]. A second analysis with a mask that consisted of the bilateral basal ganglia/substantia nigra was also performed to increase sensitivity to possible subcortical volume change relationships to antisaccade control. Finally, to address whether volume changes in brain regions outside the frontal lobes were related to oculomotor abnormalities, we analyzed all brain gray or white matter voxels simultaneously, at a lower statistical threshold (p < 0.1, family-wise error multiple-comparisons corrected) to increase sensitivity. Localization of areas of significant cortical and subcortical gray matter loss was accomplished by superimposing the regions of significant atrophy on the averaged T1-weighted image used to create the template for spatial normalization and visual comparison with a cerebral atlas (Duvornoy, 1999). Regions of atrophy are reported in Montreal Neurological Institute (MNI) coordinates (Evans et al., 1993).
Results
Consistent with their status as demented individuals, all patients were significantly different from controls on the CDR total score and sum of boxes score (p < 0.03, ANOVA, Tukey post hoc) (Table 1). Mean MMSE scores were lower in the patients than in the control subjects, but only the SD and AD groups were significantly lower than controls. There were no differences in MMSE or CDR sum of boxes scores between the patient groups. There were no significant differences in age, gender, or education between any of the subject groups.
Table 1.
Subject demographics
| Control | FTD | SD | PA | AD | |
|---|---|---|---|---|---|
| n | 20 | 14 | 10 | 7 | 18 |
| Age | 64.4 (1.6) | 59.9 (1.5) | 60.3 (2.0) | 65.7 (3.0) | 58.4 (1.7) |
| Gender (m/f) | 7/13 | 9/6 | 8/2 | 2/5 | 12/6 |
| Education | 17 (0.54) | 16 (0.65) | 16.7(0.75) | 17(1.2) | 15.3 (0.84) |
| MMSE | 29.3 (0.5) | 25.7 (1.0) | 20.1 (2.4)* | 23.1 (2.0) | 18.7 (2.0)* |
| CDR Total | 0.03 (0.03) | 0.96 (0.1)** | 0.6 (0.12)* | 0.43 (0.13)* | 0.77 (0.1)* |
| CDR SOB | 0.03 (0.03) | 5.8 (0.5)* | 3.8 (0.65)* | 1.5 (0.45) | 5.0 (0.41)* |
Each entry shows mean values (± SEM).
*p < 0.001 and
**p < 0.03 versus control. CDR SOB, CDR sum of boxes score.
Prosaccades and smooth pursuit in FTLD and AD
Patients showed little deficit in saccades to single targets. There was a significant group effect on vertical saccade latency and a nonsignificant trend for a group effect on horizontal saccade latency (p = 0.041 for vertical, p = 0.058 for horizontal, Kruskal–Wallis). AD patients showed increased latency of vertical and horizontal 10 degree saccades relative to controls (Table 2). There were no differences in saccade latency between any of the FTLD groups and controls or AD patients. All groups showed a similar decrease in saccade latency when a 200 ms gap was introduced between fixation offset and target onset (Fig. 1C). There were no differences between groups in saccade gain or velocity (Fig. 1E, Table 2). There were no significant differences in symmetry (horizontal vs vertical, right vs left, or up vs down) of saccade latency, velocity, or gain between any of the subject groups.
Table 2.
Mean horizontal and vertical visually-guided saccade parameters for 10 degree saccade targets
| Control | FTD | SD | PA | AD | |
|---|---|---|---|---|---|
| n | 20 | 14 | 10 | 7 | 18 |
| Horiz. Latency, overlap (ms) | 241 (12) | 250 (14) | 293 (20) | 266 (22) | 294 (15)* |
| Horiz. latency, gap (ms) | 214 (12) | 196 (9) | 255 (24) | 216 (19) | 245 (12) |
| Horiz. gain (deg) | 10.2 (0.2) | 9.9 (0.1) | 9.9 (0.2) | 9.7 (0.2) | 9.8 (0.2) |
| Horiz. velocity (deg/s) | 321 (14) | 280 (8) | 290 (22) | 291 (31) | 316 (18) |
| Vert. latency, overlap (ms) | 262 (15) | 309 (19) | 307 (19) | 311 (21) | 339 (17)** |
| Vert. gain (deg) | 9.9 (0.2) | 9.2 (0.6) | 9.6 (0.3) | 9.6 (0.7) | 9.4 (0.1) |
| Vert. velocity (deg/s) | 278 (13) | 267 (21) | 277 (24) | 268 (25) | 291 (15) |
Each entry gives the mean (± SEM) values. In the left column, ′gap′ versus ′overlap′ indicates the presence or absence of a 200 ms gap between fixation offset and target onset.
*p = 0.07 versus controls, ANOVA, Tukey post-hoc;
**p = 0.008 versus controls. Horiz., Horizontal; Vert., vertical.
Figure 1.
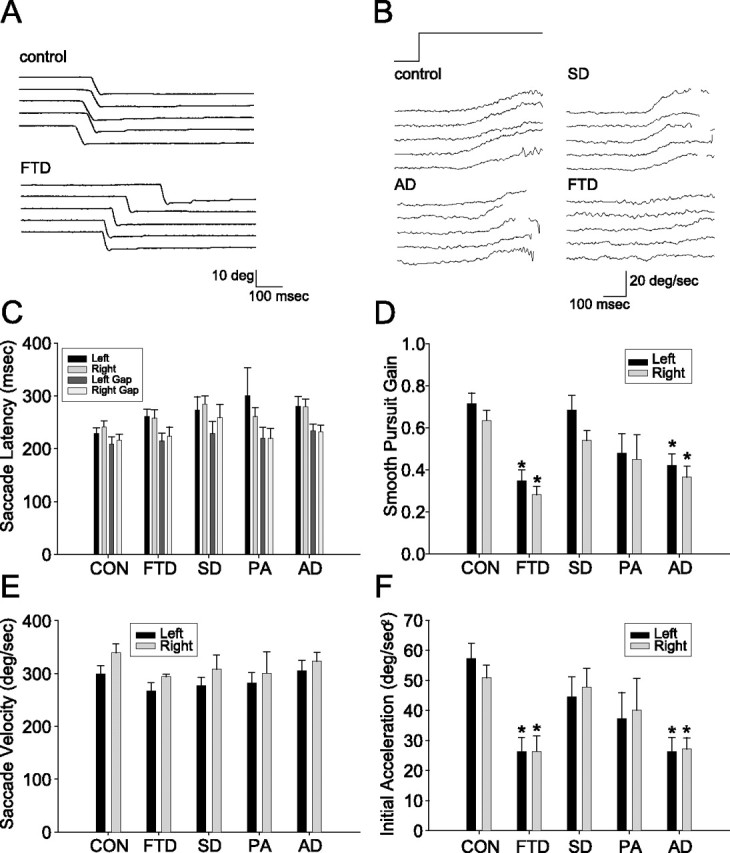
Visually guided saccades and smooth pursuit eye movements in FTLD and AD. A, Eye position traces showing examples of five successive downward saccades in a control subject and an FTD subject. B, Eye velocity traces showing examples of five consecutive pursuit responses from individual subjects from the control, AD, SD, and FTD groups. Target motion was 20 deg/s to the right. The rapid deflections of eye velocity associated with catch-up saccades have been removed. C–F, Bar graphs summarizing the oculomotor behavior of controls (CON) and all patient groups. In all graphs, black and gray bars show responses to rightward and leftward targets. Error bars show SDs across subject within each group. Asterisks indicate effects that were statistically significant relative to controls (p < 0.05, ANOVA, Tukey post hoc). C, Horizontal saccade latencies under overlap conditions and when a 200 ms gap is introduced between fixation offset and saccade onset. D, Mean gain of smooth pursuit eye movements. E, Mean velocity of horizontal saccades. F, Initial eye acceleration of horizontal smooth pursuit eye movements.
For smooth pursuit of targets moving at 20 degrees/s, both the FTD and AD group were impaired relative to controls and SD subjects on multiple aspects of horizontal and vertical smooth pursuit (Table 3). Compared with controls and the SD group, the FTD group had reduced mean gain (Fig. 1B,D) and initial eye acceleration (Fig. 1F). Similarly, the AD group had lower smooth pursuit gains and initial acceleration as compared with controls and SD patients. There were no significant differences in smooth pursuit performance in the PA group relative to controls or SD patients.
Table 3.
Smooth pursuit performance for step-ramp target motion at 20 degrees/s
| Control | FTD | SD | PA | AD | |
|---|---|---|---|---|---|
| Horiz. latency (ms) | 203 (8) | 216 (9) | 217 (9) | 204 (16) | 217 (14) |
| Horiz. maximum gain | 0.67 (0.05) | 0.31 (0.04)**† | 0.61 (0.05) | 0.47 (0.11) | 0.39 (0.04)**† |
| Horiz. mean gain | 0.31 (0.02) | 0.14 (0.02)**† | 0.27 (0.03) | 0.22 (0.06) | 0.16 (0.02)**† |
| Horiz. initial accel. (deg/s2) | 54 (4) | 26 (5)**† | 46 (5) | 39 (10) | 27 (4)**† |
| Vert. latency (ms) | 234 (8) | 270 (14) | 245 (11) | 250 (26) | 267 (9) |
| Vert. maximum gain | 0.47 (0.02) | 0.29 (0.03)*† | 0.45 (0.06) | 0.39 (0.08) | 0.28 (0.03)**† |
| Vert. mean gain | 0.21 (0.02) | 0.13 (0.02)*† | 0.21 (0.04) | 0.16 (0.04) | 0.11 (0.01)**† |
| Vert. initial accel. (deg/s2) | 46 (3.9) | 25 (3.1)*† | 45 (8.6) | 30 (6.8) | 21 (2.9)**† |
Each entry gives the mean (± SEM) values.
*p < 0.05 versus control, ANOVA with Tukey post hoc;
**p ≤ 0.005 versus control;
†p < 0.05 versus SD. Horiz., Horizontal; Vert., vertical; accel., acceleration.
Antisaccade performance in FTLD and AD
There was a significant effect of diagnostic group on the percentage of correct responses in the antisaccade task (Kruskal–Wallis, p < 0.001). The FTD, PA, and AD groups had lower percentages of correct responses than controls and SD subjects when all antisaccade trials were analyzed together (p < 0.001 vs control, p < 0.006 vs SD; ANOVA with Tukey post hoc). Group differences persisted when trials with targets presented to the left and right visual field were analyzed separately (Fig. 2A,B).
Figure 2.

Antisaccade performance in FTLD and AD. A, Eye position records showing examples of five consecutive antisaccade trials in a 53-year-old female control and a 54-year-old female FTD subject. A correct antisaccade response would have been a downward deflection of the eye position trace. Note the initial errors followed by rapid corrections in all five traces for the FTD subject. The images at the left of the panel show coronal sections through the frontal cortex from T1-weighted MRI scans. B–D, Bar graphs summarizing antisaccade performance in controls (CON) and patient groups. In B and D, black and gray bars show responses to rightward and leftward targets. Error bars show SDs across subject within each group. Asterisks indicate effects that were statistically significant relative to controls (p < 0.05). B, Percentages of correct antisaccade trials. C, Antisaccade error correction rates. D. Antisaccade latency.
The percentage of error trials that were corrected (p = 0.013, Kruskal–Wallis) as well as the mean latency of antisaccade errors (p = 0.016) also differed among diagnostic groups (Fig. 2C,D). The effect was statistically significant only for the AD group, which had a lower percentage of corrected error trials than controls and longer mean antisaccade latencies than controls on trials during which an error was made (Fig. 2D). There were no differences between patient groups on either of these measures. Likewise, the mean latency of correct antisaccade trials did not differ between any of the subject groups. The high percentage of antisaccade errors that were corrected provides evidence that subjects in all groups understood the antisaccade task, although the AD patients were less able to convert that understanding into actions to correct erroneous prosaccades.
Because there was a similar pattern of performance on the antisaccade task and smooth pursuit measures between the different subject groups (FTD and AD impaired relative to controls and SD), we asked whether deficits in the performance of both tasks might be related in individual subjects. We found a strong correlation between the percentage of correct antisaccade responses and multiple horizontal smooth pursuit variables when all subjects were analyzed together (Table 4). We did not identify a correlation between antisaccade performance and vertical pursuit in either direction.
Table 4.
Correlations between antisaccade and smooth pursuit performance
| Antisac. cor. (L) | Antisac. cor. (R) | Antisac. lat. (L) | Antisac. lat. (R) | |
|---|---|---|---|---|
| Antisaccade cor. (L) | 1 | 0.782** | 0.414* | 0.286* |
| Antisaccade cor. (R) | 0.782** | 1 | 0.297* | 0.503** |
| Antisaccade lat. (L) | 0.414* | 0.297* | 1 | 0.648** |
| Antisaccade lat. (R) | 0.286* | 0.503** | 0.648** | 1 |
| Pursuit max gain (R) | 0.396* | 0.302* | −0.033 | −0.024 |
| Pursuit mean gain (R) | 0.413* | 0.320* | −0.160 | −0.195 |
| Pursuit initial accel. (R) | 0.382* | 0.295* | −0.072 | −0.149 |
| Pursuit max gain (L) | 0.468** | 0.394* | 0.074 | 0.125 |
| Pursuit mean gain (L) | 0.480** | 0.372* | −0.039 | −0.067 |
| Pursuit initial accel. (L) | 0.496** | 0.415* | −0.029 | −0.083 |
Each entry gives Pearson correlation coefficients for the relationship between antisaccade and smooth pursuit variables in all subjects combined. Gain and acceleration values are for smooth pursuit of targets traveling at 20 degrees/s to the L or R.
*p < 0.05;
**p < 0.001. Antisac. cor., Percentage of correct antisaccade responses; Antisac. lat., latency of antisaccade responses; R, right; L, left; accel., acceleration.
Relationship between antisaccade performance and cognitive measures
Studies of antisaccade performance in AD have identified strong relationships with measures of cognitive function (Shafiq-Antonacci et al., 2003; Crawford et al., 2005). We found that antisaccade performance (percentage of correct responses and percentage of correct responses plus corrected errors) was correlated with cognitive measures but not functional measures of dementia severity in both patient groups. Performance was most strongly related to neuropsychological tests of frontal lobe/executive functions in both FTLD and AD subjects (Table 5). In both groups, a measure of set-shifting ability, the modified trails task (correct responses), the number of inhibition errors on the Stroop task, and the ability to perform five simple calculations, were correlated with performance on the antisaccade task (both directions averaged, corrected for multiple comparisons using false discovery rate). The number of sequencing errors on the trails task was strongly correlated with antisaccade performance in the FTLD group but not the AD group, whereas the time required to complete the trails task was correlated with antisaccade performance in the AD group but not the FTLD group. A general measure of cognitive function, the MMSE score, measures of immediate verbal episodic memory, and verbal fluency (number of D words and animals generated per minute) were correlated with antisaccade function in the AD group only. Including corrected antisaccade responses plus initially correct responses in the analysis led to stronger correlations between antisaccade function and tasks with a strong visual component: in FTLD, the number of designs generated per minute and Stroop errors, and in AD, the ability to copy a complex figure were better correlated with this measure.
Table 5.
Relationship of antisaccade performance to cognitive test scores
| Domain | Test | FTLD |
AD |
||||
|---|---|---|---|---|---|---|---|
| Mean | Correct | Total | Mean | Correct | Total | ||
| General | MMSE | 23.2 (1.1) | −0.072 | 0.135 | 18.9 (1.5) | 0.631 | 0.586 |
| CDR | 0.73 (0.08) | −0.136 | −0.270 | 0.77 (0.06) | −0.072 | −0.096 | |
| CDR SOB | 4.2 (0.44) | −0.003 | −0.192 | 5.0 (0.41) | 0.170 | 0.170 | |
| Memory | List recall (30″) | 3.5 (0.54) | −0.241 | −0.210 | 2.2 (0.61) | 0.760 | 0.805 |
| List recall (10′) | 2.8 (0.52) | −0.347 | −0.050 | 1.5 (0.70) | 0.602 | 0.575 | |
| Figure recall (10′) | 8.3 (0.85) | 0.219 | 0.288 | 5.0 (1.7) | 0.422 | 0.514 | |
| Spatial | Figure copy | 15.5 (0.57) | −0.023 | 0.281 | 11.5 (1.6) | 0.517 | 0.598 |
| Designs/min | 5.9 (0.75) | 0.413 | 0.570 | 4.4 (1.5) | 0.346 | 0.247 | |
| Language | Animals/min | 8.2 (1.1) | −0.335 | −0.141 | 10.1 (2.0) | 0.720 | 0.687 |
| D words/min | 7.4 (1.5) | 0.081 | −0.126 | 8.5 (1.6) | 0.687 | 0.621 | |
| Mod. BNT | 7.6 (1.3) | −0.361 | −0.050 | 7.7 (2.0) | 0.467 | 0.536 | |
| Executive | Calculations | 3.9 (0.26) | 0.505 | 0.405 | 2.9 (0.45) | 0.555 | 0.797 |
| Digits backward | 3.9 (0.30) | 0.704 | 0.293 | 2.6 (0.52) | 0.502 | 0.517 | |
| Trails (s) | 64.2 (8.0) | −0.277 | −0.523 | 95.7 (11) | −0.813 | −0.826 | |
| Trails (# correct) | 11.3 (0.9) | 0.526 | 0.543 | 6.6 (2.0) | 0.906 | 0.887 | |
| Trails (# errors) | 1.4 (0.40) | −0.677 | −0.605 | 0.9 (0.50) | 0.383 | −0.311 | |
| Stroop (# correct) | 32.6 (3.8) | 0.038 | 0.302 | 20.9 (5.6) | 0.929 | 0.619 | |
| Stroop (errors) | 1.0 (0.43) | −0.173 | −0.601 | 5.9(3.5) | −0.916 | −0.868 | |
For both FTLD and AD, the column labeled ′Mean′ shows mean (± SEM) values for each neuropsychological measure. The columns labeled ′Correct′ and ′Total′ give the Spearman correlation coefficients for each measure as related to the percentage of correct antisaccade responses (correct) or the percentage of correct responses plus corrected error responses (total). Bold values for correlations indicate p < 0.05, two-tailed, multiple comparisons corrected with false discovery rate procedure. CDR SOB, CDR sum of boxes; Mod. BNT, modified Boston Naming Test.
One prediction of these results would be that AD patients with high MMSE scores should have minimal antisaccade impairments, whereas FTLD patients with high MMSE scores should be more impaired. To test this prediction, we compared antisaccade performance in a subgroup of our subjects with high MMSE scores (>22). As predicted, antisaccade performance was impaired in the FTLD group relative to controls (percentage correct responses, 38.9 ± 9% FTLD vs 82.9 ± 4.3% control, p < 0.001, ANOVA) but not in the AD group (67.1 ± 11%, p = 0.541 vs control).
Oculomotor and brain volume correlations
Previous functional imaging and lesion studies have implicated regions in both the frontal and parietal lobes as important for performing smooth pursuit and the antisaccade task. To address whether there was a similar brain-behavior relationship in our subjects, we first used a low spatial resolution, region of interest approach (BRAINS2) to ask whether the volume of frontal or parietal lobe gray matter predicted smooth pursuit or antisaccade performance across all subject groups. Smooth pursuit performance (latency, gain, or acceleration) was not predicted by lobar brain volume. However, a model that included right and left frontal lobe gray matter volumes as well as diagnostic group (control, AD, FTD, PA, or SD), age, gender, and MMSE score predicted the percentage of correct antisaccade responses (right and left directions averaged, r = 0.814, p < 0.001). Of these variables, diagnostic status as FTD (β = −0.595, p < 0.001), PA (β = −0.384, p = 0.009) or AD (β = −0.456, p = 0.017), left frontal lobe gray matter volume (β = 0.873, p = 0.01), and right frontal lobe gray matter volume (β = −0.665, p = 0.033) significantly predicted antisaccade performance.
To better localize the frontal lobe brain regions involved in antisaccade control, a higher spatial resolution technique, VBM, was used to identify frontal lobe regions in which there was a correlation between the percentage of correct responses on the antisaccade task and brain volume (Table 6). An ANCOVA was used, configured to control for age, gender, cognitive status (MMSE), and total intracranial volume. In addition, potential interactions between diagnostic group and oculomotor performance were controlled by using the following groups: controls, AD, and a combined FTLD (FTD, SD, and PA) group. The combined FTLD group was used instead of each individual FTLD subtype to increase sensitivity to correlations between frontal lobe gray matter loss and antisaccade performance [i.e., to decrease the chance of type II error attributable to colinearity between regional frontal lobe brain atrophy patterns in FTLD subtypes and patterns of antisaccade performance in FTLD (Rosen et al., 2002; Boxer et al., 2003; Gorno-Tempini et al., 2004)].
Table 6.
Regional brain atrophy correlated with saccade performance
| Functional region | Anatomic description | BA | x | y | z | Z-score | p value |
|---|---|---|---|---|---|---|---|
| Covariate: percentage correct antisaccade responses | |||||||
| Right FEF | middle frontal gyrus/ precentral sulcus | 6 | 61 | 4 | 42 | 4.76 | 0.007 |
| Covariate: antisaccade latency | |||||||
| Right SEF > pSMA | Medial superior frontal gyrus | 6 | 0 | 19 | 58 | 5.50 | <0.001 |
| Left pSMA > SEF | Inferior/medial superior frontal gyrus | 6 | −1 | 26 | 48 | 5.47 | <0.001 |
| Covariate: visually guided saccade latency (overlap condition) | |||||||
| Unknown | Rostral left superior frontal gyrus | 6 | −15 | 46 | 36 | 4.59 | 0.015 |
Columns labeled x, y, and z indicate MNI (Evans et al., 1993) coordinates. Z-score and p value indicate the statistical significance of the best voxel identified from each VBM correlation. p value is corrected for multiple comparisons (family-wise error). Many oculomotor variables were not correlated with brain atrophy in any region: correct antisaccade responses plus corrected errors, antisaccade gain, latency of correct antisaccade responses, latency of antisaccade errors, proportion of corrected antisaccade errors, visually-guided saccade latency (gap task), visually-guided saccade velocity, visually-guided saccade gain, pursuit parameters. BA, Brodmann's area; pSMA, pre-SMA.
The mean percentage of correct antisaccade responses (left and right targets combined) was correlated with the volume of multiple gray matter voxels in the inferior portion of the right FEF: poor performance correlated with decreased brain volume (Brodmann's area 6) (Fig. 3A,C). A VBM analysis of antisaccade latency (left targets, right targets, correct trials, error trials, or all trials averaged) did not identify the right FEF (Table 6). Furthermore, after controlling for multiple comparisons, there was no correlation between the volume of this region and the latency of antisaccade responses (all averaged) (Fig. 3D). Because MMSE may underestimate the degree of dementia in FTLD (Rosen et al., 2004) and antisaccade performance is related to working memory load in normal subjects (Mitchell et al., 2002), we asked whether working memory might serve as an intervening variable to confound the antisaccade brain volume analysis. However, inclusion of backward digit span, a measure of working memory that was correlated with antisaccade performance (Table 5), as a covariate of no interest in the VBM analysis did not affect the results.
Figure 3.

Relationship between regional gray matter volume and saccade parameters. A, B, Structural images of frontal lobe regions using black patches surrounded by a white border to indicate where gray matter volume is correlated (p < 0.1, corrected for multiple comparisons, family-wise error) with percentage of correct antisaccade responses (A) or antisaccade latency (B) from the VBM analysis. Dashed line indicates region on which statistics are based. C–F, Scatter plots showing the relationship between gray matter volume and oculomotor performance, where each symbol shows measurements from a different subject. Filled circles, open circles, and upside down triangles show data from control, FTLD, and AD subjects. Brain volume is expressed in arbitrary units from the VBM analysis at the most significantly correlated voxel in the regions displayed in A and B. C–E show data for the right FEF region indicated in A (MNI coordinates: x = 61, y = 4, z = 42). F–H show data for the pre-SMA region indicated in B (MNI coordinates: x = 0, y = 19, z = 58). C, F, Percentage of correct antisaccade responses. D, G, Antisaccade latencies combined across directions. E, H, Visually guided saccade latencies in the overlap condition.
To test whether damage to the right FEF may have an effect on the latency of visually guided saccades similar to that identified in focal lesion studies (Pierrot-Deseilligny et al., 2003), we attempted to correlate saccade latency with the volume of the peak voxel that was identified in the analysis of antisaccade performance. We found no significant correlation for either the overlap or gap conditions, or for rightward, leftward, or both directions together (Table 6). In addition, when controlling for multiple comparisons, there was no relationship between the volume of the peak right FEF voxel identified in the analysis of antisaccade performance and the latency for visually guided saccades to simple targets, without the antisaccade instruction (Fig. 3E). We also found no significant correlation with measures of the performance of smooth pursuit eye movements.
There was a strong correlation between antisaccade latency, averaged across correct and incorrect trials, and the volume of bilateral regions within the pre-SMA and SEF: such that shorter antisaccade latencies were associated with smaller volumes in the pre-SMA/SEF (Table 6, Fig. 3B,G). This region was not identified in the VBM analysis of percentage of correct antisaccade responses (Table 6), and there was no correlation between the volume of the peak voxel identified in this region and the percentage of correct antisaccade responses, after controlling for multiple comparisons (Fig. 3D). Likewise, there was no correlation between visually guided saccade latency and the volume of this region (Fig. 3H). Interestingly, there was a correlation between visually guided saccade latency in the overlap condition and the volume of an anterior and lateral superior frontal gyrus region that is contiguous with the region identified in the antisaccade latency analysis (Table 6).
The VBM analysis failed to reveal any correlations between the volume of dorsal frontal lobe brain regions and any of the other eye movement parameters we measured. These included the following: the gain of correct antisaccades, the total percentage of correct antisaccade trials (initially correct responses plus corrected errors), the latency of correct antisaccade responses, the latency of incorrect antisaccade responses, the proportion of antisaccade errors that were corrected, and all measures of the performance of smooth pursuit eye movements.
FTLD is associated with atrophy of the basal ganglia, which have strong connections to the frontal lobe regions we identified. To address whether damage to these regions might play a role in the effects we observed we repeated the VBM analysis, limiting the search volume to the bilateral basal ganglia and substantia nigra to increase sensitivity to atrophy in these regions. There was no correlation between the volume of these brain regions and the oculomotor abnormalities we identified. Finally, as other cortical regions in addition to the dorsal frontal lobes might be more important for mediating antisaccade performance in these subjects, we repeated the VBM analysis, this time analyzing all brain regions simultaneously using a less stringent statistical threshold (p < 0.1, corrected for multiple comparisons). This analysis failed to identify any other brain regions whose volume was correlated with the percentage of correct or latency of antisaccade responses.
Discussion
Our paper describes the relationship between structural degeneration in different regions of the brain and oculomotor abnormalities associated with a spectrum of clinical phenotypes of frontotemporal lobar degeneration or FTLD. Individuals with degeneration that prominently involves dorsal frontal lobe structures (FTD and PA) are less able to perform the antisaccade task correctly and have deficits in smooth pursuit eye movements, whereas FTLD subjects with damage limited to ventral frontal and anterior temporal lobe structures (SD) have performance similar to that of age-matched normal control subjects. Quantitative comparison of the magnitude of the oculomotor disorders with the loci of degeneration within the dorsal frontal lobes revealed an interesting double dissociation. The volume of a segment of the right FEF was positively correlated with the percentage of correct responses on the antisaccade task, whereas the volume of the pre-SMA and SEFs was strongly correlated with the latency of antisaccades. The volumes of neither of these regions was correlated with other aspects of antisaccade performance or with the properties of visually guided saccades or smooth pursuit. The absence of a correlation with the performance of pursuit strengthens the case for a specific interaction between these areas and antisaccade performance, because pursuit performance itself was correlated significantly with antisaccade performance. We suggest that the FEF and pre-SMA form two nodes with independent but related functions in the neural circuits responsible for the rapid inhibition of saccades to explicit visual targets.
Localization of oculomotor abnormalities in FTLD and relationship to lesion models and functional imaging studies
The oculomotor deficits in our group of patients are not, themselves, surprising in light of previous focal lesion studies that implicate the frontal lobes in antisaccade function (Guitton et al., 1985; Thurston et al., 1988; Rivaud et al., 1994; Pierrot-Deseilligny et al., 1995, 2003; Walker et al., 1998). However, data obtained with either lesion studies or measures of human brain activity pose a problem of interpretation: because normal behavior is generated by the operation of a neural circuit, neither lesion nor recording studies provide definitive localization of function within that circuit. We have been able to go one step further than lesion or functional imaging studies by showing a correlation between the magnitude of specific oculomotor deficits and the degeneration of specific brain areas.
We have identified a direct relationship between the percentage of correct responses on the antisaccade task and frontal lobe gray matter volume: the frontal lobe region most strongly related to the antisaccade correct responses lay near the intersection of the right middle frontal gyrus and precentral sulcus, in Brodmann's area 6. This region is near the inferior boundary of the regions of peak activity related to visually guided saccades in fMRI experiments and has been identified as the FEF by histopathology, fMRI, and cortical stimulation experiments in humans (Berman et al., 1999; Milea et al., 2002; Rosano et al., 2002, 2003; Blanke and Seeck, 2003; Yamamoto et al., 2004). On one hand, it is a concern that the volume of the right but not the left FEF was related to the performance on the antisaccade task; on the other, our results are similar to those from similar analyses of the relationship of antisaccade correct responses to brain volume in normal adults as well as the laterality of results of some fMRI experiments (Ettinger et al., 2005; DeSouza et al., 2003). Our study primarily focused on the frontal cortex because our demented subjects had prominent damage to this region, and an initial lobar analysis suggested that integrity of this region was most related to antisaccade performance. Although separate whole brain, basal ganglia, and white matter analyses confirmed that the strongest correlations between antisaccade performance and brain volume were in the frontal gray matter, we cannot rule out damage to other components of this network as partially mediating the effects that we observed.
Focal lesion studies have produced slightly different results than those reported here. In two studies, damage to a subregion within the DLPFC (Brodmann's area 46), has been found to be most strongly associated with increased antisaccade error rate (Pierrot-Deseilligny et al., 2003; Ploner et al., 2005). The same lesion studies also suggest that damage to the FEF leads to increased latency of saccades and decreased gain of saccades (Pierrot-Deseilligny et al., 2003). Although the region we identified as being most highly correlated with the percentage of correct antisaccade responses resembles the inferior boundary of the FEF (Paus, 1996), its volume was not correlated with the latency of visually guided saccades. Thus, with regard to saccades, the region that is correlated with antisaccade performance in our patients behaves more like the DLPFC described in focal lesion studies. Perhaps the region we have identified is a subregion within or bordering on the FEF that is involved in withholding visually guided saccades. The existence of such a region in the inferior portion of the FEF is consistent with the ability to suppress saccades with direct FEF stimulation in humans (Milea et al., 2002).
In nonhuman primates, the “pre-FEF” is an area that is anterior and inferior but adjacent to the FEF and contains large numbers of “don't look” neurons whose activity signals suppression of a saccade toward visual targets in tasks such as the antisaccade task (Hasegawa et al., 2004). Given its anatomical relationship to the FEF and functional significance in the antisaccade task, the region identified in our study whose volume is correlated with antisaccade performance may represent a human homolog of the monkey pre-FEF.
Relationship between oculomotor deficit-correlated regions of brain atrophy and patterns of brain damage in other dementias
Impaired antisaccade performance is a feature of dementia caused by a variety of etiologies, including AD, Parkinson's disease-related dementias, HIV/AIDS, and schizophrenia (Everling and Fischer, 1998). Our antisaccade results are similar to those reported for the frontal variant of FTLD (Meyniel et al., 2005). Consistent with other reports of antisaccade impairments in AD (Currie et al., 1991; Abel et al., 2002; Shafiq-Antonacci et al., 2003; Crawford et al., 2005), we found a strong correlation between antisaccade performance and general cognitive status as measured by MMSE score (Table 5). There was no correlation between MMSE score and antisaccade performance in FTLD. Furthermore, analysis of patients with milder cognitive deficits (MMSE >22) revealed impairments of antisaccade performance in the FTLD group but not the AD group. Because frontal lobe damage is an early feature of FTLD (Broe et al., 2003) but occurs later in the course of disease in AD (Thompson et al., 2003), these findings suggest that our AD patients with high MMSE scores may not yet have acquired sufficient dorsal frontal lobe damage to result in antisaccade impairments. Because a small percentage of clinically diagnosed FTLD subjects may be found to have AD pathology at autopsy, these results will need to be confirmed in pathologically diagnosed FTLD. However, because both FTLD and AD area are associated with brain atrophy, our imaging results would not be expected to change as a result of a reclassification of our subjects based on pathological diagnosis.
Consistent with our identification of dorsal frontal lobe integrity as related to antisaccade performance, cortical thickness measurements in HIV-infected individuals reveal prominent damage to this region early in the course of disease. (Thompson et al., 2005) Moreover, antisaccade performance is highly correlated with the volume of right dorsal frontal lobe structures (including the FEF) in schizophrenia (Bagary et al., 2004; Ettinger et al., 2004), and measurements of cortical thickness reveal that the region surrounding the FEF is severely atrophied in schizophrenics (Cannon et al., 2002). Consistent with our inability to detect a correlation between basal ganglia damage and antisaccade performance in our FTLD subjects, patients with Parkinson's disease do not have measurable antisaccade abnormalities unless they also have dementia caused by extensive cortical pathology (Mosimann et al., 2005).
Mechanistic implications of lateral (FEF) versus medial (SEF/pre-SMA) frontal lobe regions for antisaccade control
We identified a strong relationship between the latency of antisaccade trials and the volume of the pre-SMA and SEF, such that larger volumes of these regions were associated with longer latencies of both correct antisaccades and antisaccade errors. These regions may exert their effects through high-level supervisory processes that signal previous probability and urgency and are engaged before saccade onset. Such supervisory processes may delay the onset of saccades (Schlag-Rey et al., 1997; Stuphorn et al., 2000; Carpenter, 2004). With damage to the SEF and pre-SMA, these processes would not operate, leading to more rapid implementation of programs for visually guided saccades, generated in the FEF and other dorsolateral prefrontal regions.
The results of recent fMRI studies of antisaccade performance suggest that early pre-SMA activity before the onset of an antisaccade cue reflects an abstract, directionally undetermined eye movement goal that biases the activity in other oculomotor areas and reduces the likelihood of a visually guided saccade to an exogenous cue (Curtis and D'Esposito, 2003; Ford et al., 2005). Our findings provide a potential mechanism for this effect through control of latency. Our data suggest that the pre-SMA and SEF slow the generation of saccades that require a choice between two visual cues (in this case, a fixation point and eccentric target), and facilitate the decision to initiate a saccade that occurs (at least in part) within the FEF. This close interaction is supported by a multivariate fMRI analysis of antisaccade-related activity in the frontal lobe, in which there is increased coherence in the activity of the pre-SMA and FEF before the generation of antisaccades (Miller et al., 2005).
Footnotes
This work was supported by The John Douglas French Foundation, National Institutes of Health Grants K23 NS48855 (A.L.B.), P50 AG-03-006-01 (B.L.M.), P01 AG019724 (B.L.M.), The Larry Hillblom Foundation (B.L.M.), and the Howard Hughes Medical Institute (S.G.L.). We thank David Dean, Vincent Magnotta, and Joel Kramer for providing Brains2 data and Howard Rosen and Steve Allison for helpful discussions.
References
- Abel LA, Unverzagt F, Yee RD (2002). Effects of stimulus predictability and interstimulus gap on saccades in Alzheimer's disease. Dement Geriatr Cogn Disord 13:235–243. [DOI] [PubMed] [Google Scholar]
- Ashburner J, Friston KJ (2000). Voxel-based morphometry–the methods. NeuroImage 11:805–821. [DOI] [PubMed] [Google Scholar]
- Bagary MS, Hutton SB, Symms MR, Barker GJ, Mutsatsa SH, Barnes TR, Joyce EM, Ron MA (2004). Structural neural networks subserving oculomotor function in first-episode schizophrenia. Biol Psychiatry 56:620–627. [DOI] [PubMed] [Google Scholar]
- Berman RA, Colby CL, Genovese CR, Voyvodic JT, Luna B, Thulborn KR, Sweeney JA (1999). Cortical networks subserving pursuit and saccadic eye movements in humans: an FMRI study. Hum Brain Mapp 8:209–225. [DOI] [PMC free article] [PubMed] [Google Scholar]
- Blanke O, Seeck M (2003). Direction of saccadic and smooth eye movements induced by electrical stimulation of the human frontal eye field: effect of orbital position. Exp Brain Res 150:174–183. [DOI] [PubMed] [Google Scholar]
- Boxer AL, Rankin KP, Miller BL, Schuff N, Weiner M, Gorno-Tempini ML, Rosen HJ (2003). Cinguloparietal atrophy distinguishes Alzheimer disease from semantic dementia. Arch Neurol 60:949–956. [DOI] [PubMed] [Google Scholar]
- Boxer AL, Trojanowski JQ, Lee VY-M, Miller BL (2005). Frontotemporal lobar degeneration. In: Neurodegenerative diseases: neurobiology, pathogenesis and therapeutics (Beal MF, Lang AE, Ludolph AC, eds) pp. 481–493. Cambridge, UK: Cambridge UP.
- Broe M, Hodges JR, Schofield E, Shepherd CE, Kril JJ, Halliday GM (2003). Staging disease severity in pathologically confirmed cases of frontotemporal dementia. Neurology 60:1005–1011. [DOI] [PubMed] [Google Scholar]
- Buckner RL (2004). Memory and executive function in aging and AD: multiple factors that cause decline and reserve factors that compensate. Neuron 44:195–208. [DOI] [PubMed] [Google Scholar]
- Cannon TD, Thompson PM, van Erp TG, Toga AW, Poutanen VP, Huttunen M, Lonnqvist J, Standerskjold-Nordenstam CG, Narr KL, Khaledy M, Zoumalan CI, Dail R, Kaprio J (2002). Cortex mapping reveals regionally specific patterns of genetic and disease-specific gray-matter deficits in twins discordant for schizophrenia. Proc Natl Acad Sci USA 99:3228–3233. [DOI] [PMC free article] [PubMed] [Google Scholar]
- Carpenter RH (2004). Supplementary eye field: keeping an eye on eye movement. Curr Biol 14:R416–R418. [DOI] [PubMed] [Google Scholar]
- Connolly JD, Goodale MA, Menon RS, Munoz DP (2002). Human fMRI evidence for the neural correlates of preparatory set. Nat Neurosci 5:1345–1352. [DOI] [PubMed] [Google Scholar]
- Crawford TJ, Higham S, Renvoize T, Patel J, Dale M, Suriya A, Tetley S (2005). Inhibitory control of saccadic eye movements and cognitive impairment in Alzheimer's disease. Biol Psychiatry 57:1052–1060. [DOI] [PubMed] [Google Scholar]
- Currie J, Ramsden B, McArthur C, Maruff P (1991). Validation of a clinical antisaccadic eye movement test in the assessment of dementia. Arch Neurol 48:644–648. [DOI] [PubMed] [Google Scholar]
- Curtis CE, D'Esposito M (2003). Success and failure suppressing reflexive behavior. J Cogn Neurosci 15:409–418. [DOI] [PubMed] [Google Scholar]
- Delis D, Kaplan EB, Kramer J (2001). In: The Delis–Kaplan executive function system San Antonio, TX: The Psychological Corporation.
- DeSouza JF, Menon RS, Everling S (2003). Preparatory set associated with pro-saccades and anti-saccades in humans investigated with event-related FMRI. J Neurophysiol 89:1016–1023. [DOI] [PubMed] [Google Scholar]
- Deubel H, Bridgeman B (1995). Fourth Purkinje image signals reveal eye-lens deviations and retinal image distortions during saccades. Vision Res 35:529–538. [DOI] [PubMed] [Google Scholar]
- Duvornoy HM (1999). In: The human brain: surface, three-dimensional sectional anatomy with MRI, and blood supply New York: Springer Wein.
- Ettinger U, Kumari V, Chitnis XA, Corr PJ, Crawford TJ, Fannon DG, O'Ceallaigh S, Sumich AL, Doku VC, Sharma T (2004). Volumetric neural correlates of antisaccade eye movements in first-episode psychosis. Am J Psychiatry 161:1918–1921. [DOI] [PubMed] [Google Scholar]
- Ettinger U, Antonova E, Crawford TJ, Mitterschiffthaler MT, Goswani S, Sharma T, Kumari V (2005). Structural neural correlates of prosaccade and antisaccade eye movements in healthy humans. NeuroImage 24:487–494. [DOI] [PubMed] [Google Scholar]
- Evans AC, Collins DL, Mills SR, Brown ED, Kelley RL, Peters TM (1993). 3D statistical neuroanatomical models from 305 MRI volumes. Proc IEEE Nucl Sci Symp Med Imaging Conf 3: pp. 1813–1817. [Google Scholar]
- Everling S, Fischer B (1998). The antisaccade: a review of basic research and clinical studies. Neuropsychologia 36:885–899. [DOI] [PubMed] [Google Scholar]
- Folstein MF, Folstein SE, McHugh PR (1975). “Mini-mental state.” A practical method for grading the cognitive state of patients for the clinician. J Psychiatr Res 12:189–198. [DOI] [PubMed] [Google Scholar]
- Ford KA, Goltz HC, Brown MR, Everling S (2005). Neural processes associated with antisaccade task performance investigated with event-related FMRI. J Neurophysiol 94:429–440. [DOI] [PubMed] [Google Scholar]
- Golden C (1978). In: Stroop color and word test: manual for clinical and experimental uses Chicago: Stoelting.
- Good CD, Johnsrude IS, Ashburner J, Henson RNA, Friston KJ, Frackowiak RSJ (2001). A voxel-based morphometric study of ageing in 465 normal adult human brains. NeuroImage 14:21–36. [DOI] [PubMed] [Google Scholar]
- Gorno-Tempini ML, Dronkers NF, Rankin KP, Ogar JM, Phengrasamy L, Rosen HJ, Johnson JK, Weiner MW, Miller BL (2004). Cognition and anatomy in three variants of primary progressive aphasia. Ann Neurol 55:335–346. [DOI] [PMC free article] [PubMed] [Google Scholar]
- Guitton D, Buchtel HA, Douglas RM (1985). Frontal lobe lesions in man cause difficulties in suppressing reflexive glances and in generating goal-directed saccades. Exp Brain Res 58:455–472. [DOI] [PubMed] [Google Scholar]
- Hallet PE (1978). Primary and secondary saccades to goals defined by instructions. Vision Res 18:1279–1296. [DOI] [PubMed] [Google Scholar]
- Hasegawa RP, Peterson BW, Goldberg ME (2004). Prefrontal neurons coding suppression of specific saccades. Neuron 43:415–425. [DOI] [PubMed] [Google Scholar]
- Kaplan E, Goodglass H, Wintraub S (1983). In: The Boston naming test Philadelphia: Lea and Febiger.
- Magnotta VA, Harris G, Andreasen NC, O'Leary DS, Yuh WT, Heckel D (2002). Structural MR image processing using the BRAINS2 toolbox. Comput Med Imaging Graph 26:251–264. [DOI] [PubMed] [Google Scholar]
- Maldjian JA, Laurienti PJ, Burdette JH (2004). Precentral gyrus discrepancy in electronic versions of the Talairach atlas. NeuroImage 21:450–455. [DOI] [PubMed] [Google Scholar]
- McKhann G, Drachman D, Folstein M, Katzman R, Price D, Stadlan E (1984). Clinical diagnosis of Alzheimer disease: report of the NINCDS-ARDA Work Group under the auspices of Department of Health and Human Services Task Force on Alzheimer's Disease. Neurology 34:939–944. [DOI] [PubMed] [Google Scholar]
- Meyniel C, Rivaud-Pechoux S, Damier P, Gaymard B (2005). Saccade impairments in patients with fronto-temporal dementia. J Neurol Neurosurg Psychiatry 76:1581–1584. [DOI] [PMC free article] [PubMed] [Google Scholar]
- Milea D, Lobel E, Lehericy S, Duffau H, Rivaud-Pechoux S, Berthoz A, Pierrot-Deseilligny C (2002). Intraoperative frontal eye field stimulation elicits ocular deviation and saccade suppression. NeuroReport 13:1359–1364. [DOI] [PubMed] [Google Scholar]
- Miller LM, Sun FT, Curtis CE, D'Esposito M (2005). Functional interactions between oculomotor regions during prosaccades and antisaccades. Hum Brain Mapp 26:119–127. [DOI] [PMC free article] [PubMed] [Google Scholar]
- Mitchell JP, Macrae CN, Gilchrist ID (2002). Working memory and the suppression of reflexive saccades. J Cogn Neurosci 14:95–103. [DOI] [PubMed] [Google Scholar]
- Morris JC (1993). The Clinical Dementia Rating (CDR): current version and scoring rules. Neurology 43:2412–2414. [DOI] [PubMed] [Google Scholar]
- Mosimann UP, Muri RM, Burn DJ, Felblinger J, O'Brien JT, McKeith IG (2005). Saccadic eye movement changes in Parkinson's disease dementia and dementia with Lewy bodies. Brain 128:1267–1276. [DOI] [PubMed] [Google Scholar]
- Munoz DP, Everling S (2004). Look away: the anti-saccade task and the voluntary control of eye movement. Nat Rev Neurosci 5:218–228. [DOI] [PubMed] [Google Scholar]
- Neary D, Snowden JS, Gustafson L, Passant U, Stuss D, Black S, Freedman M, Kertesz A, Robert PH, Albert M, Boone K, Miller BL, Cummings J, Benson DF (1998). Frontotemporal lobar degeneration: a consensus on clinical diagnostic criteria. Neurology 51:1546–1554. [DOI] [PubMed] [Google Scholar]
- Nichols T, Hayasaka S (2003). Controlling the familywise error rate in functional neuroimaging: a comparative review. Stat Methods Med Res 12:419–446. [DOI] [PubMed] [Google Scholar]
- Paus T (1996). Location and function of the human frontal eye-field: a selective review. Neuropsychologia 34:475–483. [DOI] [PubMed] [Google Scholar]
- Pierrot-Deseilligny C, Rivaud S, Gaymard B, Agid Y (1991). Cortical control of reflexive visually-guided saccades. Brain 114:1473–1485. [DOI] [PubMed] [Google Scholar]
- Pierrot-Deseilligny C, Rivaud S, Gaymard B, Muri R, Vermersch AI (1995). Cortical control of saccades. Ann Neurol 37:557–567. [DOI] [PubMed] [Google Scholar]
- Pierrot-Deseilligny C, Muri RM, Ploner CJ, Gaymard B, Demeret S, Rivaud-Pechoux S (2003). Decisional role of the dorsolateral prefrontal cortex in ocular motor behaviour. Brain 126:1460–1473. [DOI] [PubMed] [Google Scholar]
- Ploner CJ, Gaymard BM, Rivaud-Pechoux S, Pierrot-Deseilligny C (2005). The prefrontal substrate of reflexive saccade inhibition in humans. Biol Psychiatry 57:1159–1165. [DOI] [PubMed] [Google Scholar]
- Rashbass C (1961). The relationship between saccadic and smooth tracking eye movements. J Physiol (Lond) 159:326–338. [DOI] [PMC free article] [PubMed] [Google Scholar]
- Reitan RM (1958). Validity of the Trailmaking Test as an indication of organic brain damage. Percept Mot Skills 8:271–276. [Google Scholar]
- Rivaud S, Muri RM, Gaymard B, Vermersch AI, Pierrot-Deseilligny C (1994). Eye movement disorders after frontal eye field lesions in humans. Exp Brain Res 102:110–120. [DOI] [PubMed] [Google Scholar]
- Rosano C, Krisky CM, Welling JS, Eddy WF, Luna B, Thulborn KR, Sweeney JA (2002). Pursuit and saccadic eye movement subregions in human frontal eye field: a high-resolution fMRI investigation. Cereb Cortex 12:107–115. [DOI] [PubMed] [Google Scholar]
- Rosano C, Sweeney JA, Melchitzky DS, Lewis DA (2003). The human precentral sulcus: chemoarchitecture of a region corresponding to the frontal eye fields. Brain Res 972:16–30. [DOI] [PubMed] [Google Scholar]
- Rosen HJ, Gorno-Tempini ML, Goldman WP, Perry RJ, Schuff N, Weiner M, Feiwell R, Kramer JH, Miller BL (2002). Patterns of brain atrophy in frontotemporal dementia and semantic dementia. Neurology 58:198–208. [DOI] [PubMed] [Google Scholar]
- Rosen HJ, Narvaez JM, Hallam B, Kramer JH, Wyss-Coray C, Gearhart R, Johnson JK, Miller BL (2004). Neuropsychological and functional measures of severity in Alzheimer disease, frontotemporal dementia, and semantic dementia. Alzheimer Dis Assoc Disord 18:202–207. [PubMed] [Google Scholar]
- Schlag-Rey M, Amador N, Sanchez H, Schlag J (1997). Antisaccade performance predicted by neuronal activity in the supplementary eye field. Nature 390:398–401. [DOI] [PubMed] [Google Scholar]
- Shafiq-Antonacci R, Maruff P, Masters C, Currie J (2003). Spectrum of saccade system function in Alzheimer disease. Arch Neurol 60:1272–1278. [DOI] [PubMed] [Google Scholar]
- Stuphorn V, Schall JD (2002). Neuronal control and monitoring of initiation of movements. Muscle Nerve 26:326–339. [DOI] [PubMed] [Google Scholar]
- Stuphorn V, Taylor TL, Schall JD (2000). Performance monitoring by the supplementary eye field. Nature 408:857–860. [DOI] [PubMed] [Google Scholar]
- Tailarach J, Tournoux P (1988). Co-planar stereotaxic atlas of the human brain: 3-dimensional proportional system. In: An approach to cerebral imaging Stuttgart, Germany: Geroge Thieme Verlag.
- Thompson PM, Hayashi KM, de Zubicaray G, Janke AL, Rose SE, Semple J, Herman D, Hong MS, Dittmer SS, Doddrell DM, Toga AW (2003). Dynamics of gray matter loss in Alzheimer's disease. J Neurosci 23:994–1005. [DOI] [PMC free article] [PubMed] [Google Scholar]
- Thompson PM, Dutton RA, Hayashi KM, Toga AW, Lopez OL, Aizenstein HJ, Becker JT (2005). Thinning of the cerebral cortex visualized in HIV/AIDS reflects CD4+ T lymphocyte decline. Proc Natl Acad Sci USA 102:15647–15652. [DOI] [PMC free article] [PubMed] [Google Scholar]
- Thurston SE, Leigh RJ, Crawford T, Thompson A, Kennard C (1988). Two distinct deficits of visual tracking caused by unilateral lesions of cerebral cortex in humans. Ann Neurol 23:266–273. [DOI] [PubMed] [Google Scholar]
- Walker R, Husain M, Hodgson TL, Harrison J, Kennard C (1998). Saccadic eye movement and working memory deficits following damage to human prefrontal cortex. Neuropsychologia 36:1141–1159. [DOI] [PubMed] [Google Scholar]
- Woods RP, Cherry SR, Mazziotta JC (1992). Rapid automated algorithm for aligning and reslicing PET images. J Comput Assist Tomogr 16:620–633. [DOI] [PubMed] [Google Scholar]
- Yamamoto J, Ikeda A, Satow T, Matsuhashi M, Baba K, Yamane F, Miyamoto S, Mihara T, Hori T, Taki W, Hashimoto N, Shibasaki H (2004). Human eye fields in the frontal lobe as studied by epicortical recording of movement-related cortical potentials. Brain 127:873–887. [DOI] [PubMed] [Google Scholar]
- Yesavage JA, Brink TL, Rolse TL, Lum O, Huang V, Adey M, Leiter VO (1983). Development and validity of a geriatric depression scale: a preliminary report. J Psychiatr Res 17:37–49. [DOI] [PubMed] [Google Scholar]