Abstract
While studying the intracellular calcium dynamics in cells of the macula densa, the observation was made that tubular epithelial cells located near the macula densa and associated with the renal arterioles exhibit spontaneous Ca2+ oscillations. In this study, the cortical thick ascending limb–distal tubule, with attached glomerulus, was isolated and perfused. At a low luminal sodium chloride concentration, Ca2+ oscillations at a frequency of 63 mHz were observed in tubular cells that were within 100 μm of the macula densa plaque using four-dimensional multiphoton microscopy and wide-field fluorescence microscopy with fura-2. The Ca2+ oscillations were absent in the macula densa cells. Spontaneous oscillations in basolateral membrane potential suggested that Ca2+ oscillations occurred, at least in part, through depolarization-induced increases in Ca2+ entry. The amplitude of these Ca2+ oscillations was significantly enhanced by the activation of the Ca2+-sensing receptor. Increasing the luminal sodium chloride concentration or luminal flow resulted in a significant increase in both the amplitude of Ca2+ oscillations and the intracellular Ca2+ concentration in perimacular cortical thick ascending limb cells. In addition, luminal furosemide attenuated the [NaCl]L-dependent changes in intracellular Ca2+ concentration, but hydrochlorothiazide had no effect. These findings demonstrate that tubular epithelial cells at the perimeter of the macula densa exhibit spontaneous oscillations in intracellular Ca2+ concentration, enhanced by tubular flow and luminal sodium chloride. These oscillatory patterns may play a role in juxtaglomerular signaling.
As first recognized by Golgi,1 the cortical thick ascending limb (cTAL) of the loop of Henle contacts the vascular pole of its parent glomerulus, creating a structural connection between tubules and vessels that has at least two functional consequences. Flow-dependent changes in tubular fluid composition produce changes in the vascular tone of the associated glomerular arterioles (a phenomenon known as tubuloglomerular feedback [TGF]) and also alter the rate of renin release from granular cells.2 Anatomically, the most prominent contact point between tubules and glomerulus occurs at the macula densa. Basolateral membranes of macula densa cells are in direct contact with the underlying mesangial cells, and it has generally been thought that communication between tubule and glomerular structures is the domain of these highly specialized and unique cells; however, as described by Barajas et al.,3 tubular–vascular interactions are more complex, and there are in fact other areas of contact between renal tubular epithelium and vasculature.
In work to characterize further the intracellular calcium dynamics in macula densa cells and its potential role in TGF signaling, we observed spontaneous calcium oscillations in renal epithelial cells that were near or adjacent to the macula densa plaque. Because intracellular calcium concentration ([Ca2+]i) is an important cell signaling pathway, we were compelled to investigate these cells, which we now designate as “perimacular” cells, and to characterize the pattern and possible mechanism for these calcium oscillations.
RESULTS
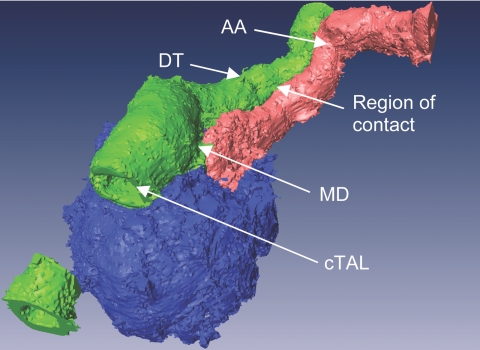
In early electronic microscopic studies by Barajas et al.,4 an extensive region of contact was shown to exist between the terminal segment of cTAL and the efferent arteriole; however, the possible juxtaposition of the initial portion of the distal tubule (DT) with the afferent arteriole has not been shown in rabbits. To study further the possible functional association of the DT and afferent arteriole, we isolated cTAL-DT-glomerular preparations with the afferent arteriole from rabbit kidney taking care to maintain the arteriole–tubular relationship intact. As shown in the representative intensity-segmented and pseudocolored three-dimensional reconstruction in Figure 1, there is an approximately 100-μm-long area of contact between the early DT and the terminal portion of the afferent arteriole.
Figure 1.
Representative three-dimensional segmented image demonstrating extensive region of contact between DT and afferent arteriole (AA). Portion of the cTAL has been optically removed to gain insight into the tubule. The macula densa (MD) is hidden beneath the tubular segments.
Epithelial Cells in the Juxtaglomerular Apparatus Demonstrate Spontaneous Oscillations in [Ca2+]i and Basolateral Membrane Potential
In the course of measuring [Ca2+]i in macula densa cells, we observed the presence of epithelial cells that seem to exhibit large spontaneous oscillations in [Ca2+]i. To characterize this activity, we used ratiometric fluorescence imaging with fura-2 under baseline conditions of low luminal sodium chloride concentration ([NaCl]L) of 20 mmol/L. Interestingly, in 78% of the 55 preparations studied, a group of cells in the initial DT and/or terminal cTAL demonstrated spontaneous oscillations in [Ca2+]i (Figure 2). Oscillations were also observed in more proximal segments of the cTAL or more distally in the DT (Supplemental Movie 2).
Figure 2.
Wide-field fura-2 imaging of the isolated perfused cTAL-DT preparation with attached glomerulus. (A) Bright-field photomicrograph demonstrating the cTAL, the DT, the MD plaque, and the glomerulus (G). The tubule was cannulated and perfused from the cTAL end. (B) Cumulative increases in [Ca2+]i during the course of the experiment. (C) Representative [Ca2+]i recording from a cell in the terminal cTAL. (D) Representative power spectrum density (PSD) plot of the [Ca2+]i recordings in the frequency domain. Inset demonstrates the position of power spectrum peaks on the frequency domain.
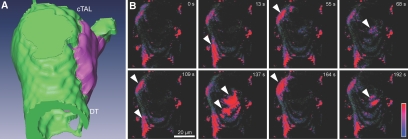
To characterize further the intracellular Ca2+ signaling in the epithelial cells of the early DT, we performed four-dimensional imaging. As shown in Figure 3 and in Supplemental Movie 1, the cells of the tubular epithelium in the proximity of the macula densa plaque in the DT, cTAL, and also the region opposite the macula densa plaque demonstrated spontaneous oscillations in [Ca2+]I; however, macula densa cells did not exhibit oscillations (Figure 2B). In 28 of the 39 preparations, oscillations were highly regular and monomorph, similar to that shown in Figure 2C. Analysis of the Ca2+ recordings in the frequency domain (Figure 2D) revealed a dominant oscillatory frequency of 63 ± 15 mHz (n = 8). Oscillations in [Ca2+]i in the perimacular cTAL cells were abolished by omission of Ca2+ from the bath solution (data not shown).
Figure 3.
Four-dimensional multiphoton fluorescence imaging of isolated perfused tubular preparation (A) Schematic segmentation image showing the topography of the preparation in B. MD is indicated in purple. (B) Snapshots from four-dimensional reconstruction (see Supplemental Movie 1) showing spontaneous intracellular Ca2+ spikes (arrowheads) in the tubular epithelial cells in the perimeter of MD.
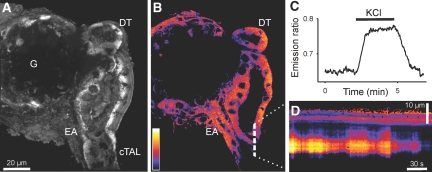
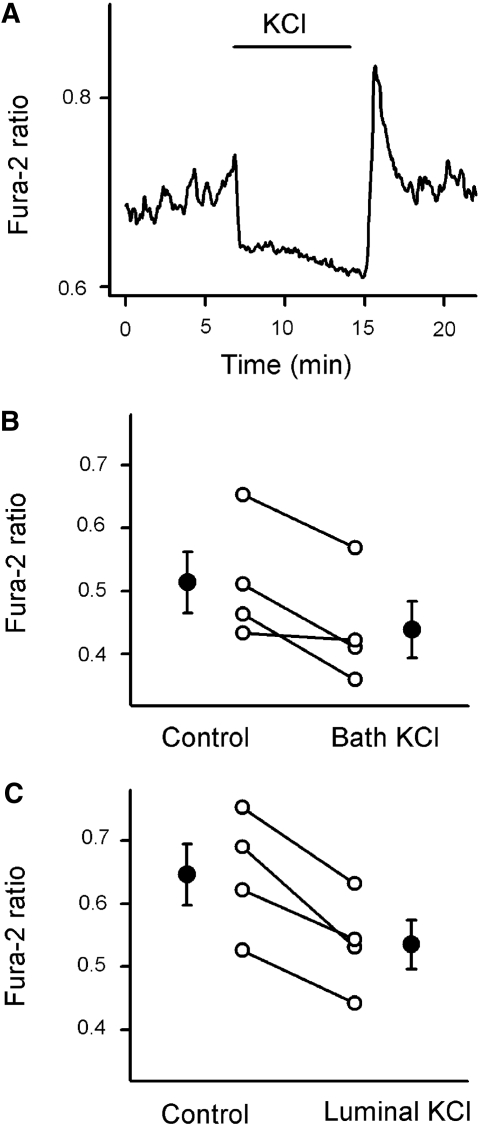
We then used the voltage-sensitive dye bis-(1,3-dibutylbarbituric acid) trimethine oxonol [DiBAC4(3)] to determine whether the oscillatory intracellular calcium signaling is associated with changes in membrane potential. The partition of this particular dye in the plasma membrane depends on the transmembrane potential and by addition to the bath solution only can be used to detect changes in basolateral membrane potential (Vbl) using emission ratiometric fluorescence imaging. As shown in Figure 4C, membrane depolarization with basolateral application of 100 mmol/L potassium chloride led to rapid, reversible increases in fluorescence ratio values. Using this electrical potential sensing dye, we detected cyclic changes in Vbl in the perimacular cTAL cells (Figure 4D). To determine whether [Ca2+]i signaling in perimacular cTAL cells depends on changes in Vbl, we administered 100 mmol/L KCl in the luminal perfusate or in the bath to depolarize epithelial cells. As shown in Figure 5, depolarizing the basolateral membrane with potassium chloride reduced [Ca2+]i in perimacular cTAL cells and abolished oscillations in five of the eight preparations. Interestingly, in half of the experiments, the withdrawal of potassium chloride was followed by a large calcium spike, as shown in Figure 5A.
Figure 4.
Confocal imaging of membrane potential changes in the isolated perfused cTAL-DT preparation. (A and B) Three-dimensional reconstructed (A) and confocal emission ratio images (B) of the preparation loaded with the membrane potential–sensitive DiBAC4(3) dye. Note the efferent arteriole (EA) and glomerulus (G). (C) Graph demonstrating the effect of membrane depolarization by application of KCl in the bath on the emission ratio values obtained from a preparation. (D) Pseudolinescan image along the dashed line in B demonstrating spontaneous oscillations in the membrane potential of a tubular cell in the cTAL.
Figure 5.
Effect of membrane depolarization on the [Ca2+]i in the perimacular oscillatory cells. (A) Representative fura-2 ratio recording demonstrating the effect of KCl (from the lumen) on [Ca2+]i in a perimacular cTAL cell located in the terminal portion of the cTAL. (B and C) Effect of bath (B) and luminal KCl (C) on [Ca2+]i in perimacular tubular epithelial cells. ○, Fura-2 ratio values from individual cells; •, average values (n = 4, the values in the control and KCl groups were different from each other; P < 0.05).
Intracellular Calcium Signaling in Perimacular cTAL Cells Is Affected by Activation of Calcium-Sensing Receptor
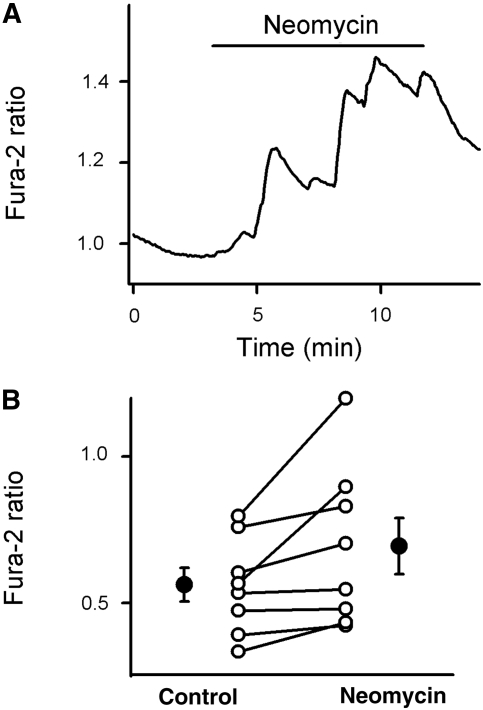
Previous immunohistologic studies concluded that the calcium-sensing receptor is preferentially expressed in the basolateral membrane of the macula densa plaque and in the epithelial cells around it.5 We hypothesized that the calcium-sensing receptor might play a role in the generation of calcium oscillations in perimacular epithelial cells. As shown in Figure 6, basolateral application of 5 × 10⁻⁴ mol/L neomycin, an activator of calcium-sensing receptor, produced robust increases in [Ca2+]i in perimacular cTAL cells. Also, we observed a marked increase in perimacular cell oscillation amplitude in 10 of the 14 experiments.
Figure 6.
Effect of activation of calcium-sensing receptor on [Ca2+]i in the perimacular oscillatory cells. (A) Representative fura-2 ratio recording demonstrating the effect of neomycin, an activator of calcium-sensing receptor (5 × 10⁻⁴ mol/L from the bath), on [Ca2+]i in a perimacular cTAL cell located in the terminal portion of the cTAL. (B) Effect of neomycin on [Ca2+]i in perimacular tubular epithelial cells. ○, Fura-2 ratio values from individual cells; •, average values (n = 8, one cell each from every preparation; the values in the control and neomycin groups were different from each other; P < 0.05).
Luminal Flow and Luminal [NaCl]L-Dependent Intracellular Calcium Signaling in the Perimacular Cells
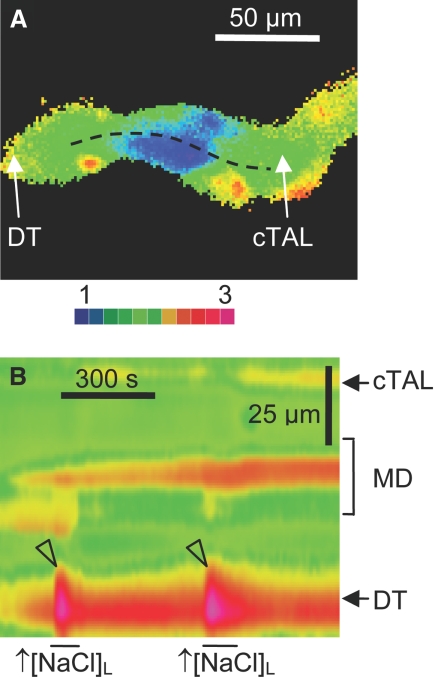
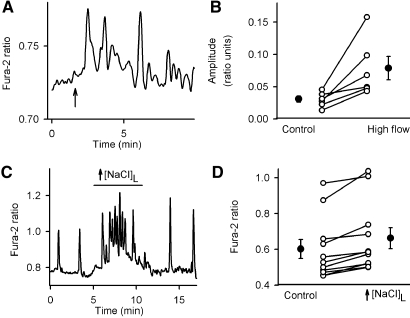
Because elevations in [NaCl]L have been considered an important initiator of juxtaglomerular signaling, we characterized its effect on perimacular cTAL cell intracellular calcium signaling. As shown in Figure 7, an increase in [NaCl]L from 20 to 80 mmol/L (and a concomitant increase in luminal osmolality from 98 to 210 mOsm/kg H2O) resulted in robust, reversible increases in [Ca2+]i, especially in those perimacular cTAL cells located in the DT, and very modest changes in macula densa. Also, a reversible increase in oscillation frequency/and intracellular calcium salve (Figure 8C) was observed upon application of elevated [NaCl]L. The magnitude of [NaCl]L-dependent changes in [Ca2+]i in the perimacular cTAL cells was slightly smaller with constant luminal osmolality than with concomitant changes in [NaCl]L and osmolality, but the difference was not large enough to reach statistical significance (72 ± 69% of control; n = 5; P = 0.35). Luminal administration of furosemide, an inhibitor of the Na+:2Cl−:K+ co-transporter (10−4 mol/L), produced marked attenuation of [NaCl]L-dependent calcium responses (44 ± 8% of control), whereas luminal hydrochlorothiazide, an inhibitor of Na+:Cl− co-transporter (10−4 μmol/L), had no effect (101 ± 6% of control).
Figure 7.
Characteristics of [NaCl]L-dependent changes in [Ca2+]i in macula densa and perimacular cTAL cells. (A and B) Wide-field fura-2 ratio (A) and pseudolinescan image (B) obtained along the line illustrated in A. Note the robust increases in [Ca2+]i in the early DT upon increases in [NaCl]L from 20 to 80 mmol/L (arrowheads).
Figure 8.
Effect of tubular flow and luminal [NaCl]L on [Ca2+]i in perimacular oscillatory cells. (A) Representative fura-2 ratio recording demonstrating the effect of elevated tubular flow from 20 to 40 nl/min (onset at the time point indicated by arrow) on the intracellular calcium dynamics in a perimacular cTAL cell located in the terminal portion of the cTAL. (B) Effect of elevations in tubular flow on the amplitude of oscillations in [Ca2+]i in perimacular tubular epithelial cells. ○, Fura-2 ratio oscillation amplitude values from individual cells at different tubular flow conditions; •, average values (n = 6, one cell each from every preparation; the values in the control and high-flow groups were different from each other; P < 0.05). (C) Representative fura-2 ratio recording demonstrating the effect of an increase in [NaCl]L and osmolality (from 20 to 80 mmol/L and from 98 to 210 mOsm/kg H2O) on [Ca2+]i in a perimacular cTAL cell located in the early portion of the DT. (D) Effect of elevations in [NaCl]L and osmolality on [Ca2+]i in perimacular tubular epithelial cells of the early DT. ○, Fura-2 ratio values from individual cells; •, average values (n = 12, one cell each from every preparation; the values in the control and high-NaCl groups were different from each other; P < 0.05).
Figure 8, A and B, shows the effect of an increase in luminal flow on [Ca2+]i in perimacular cTAL cells. Changing from low to high flow resulted in a significant increase in the amplitude of calcium oscillations in perimacular cTAL cells in every preparation. In case of macula densa cells, the increased tubular flow did not produce oscillations, but produced a significant increase in fura-2 ratio in 4 of 8 experiments.
DISCUSSION
In previous work from our laboratory, we used a photometry-based fluorescence system to assess [NaCl]L-dependent changes in [Ca2+]i from macula densa cells.6 We observed increases in [Ca2+]i with elevations in [NaCl]L, although the responses were at best modest. One disadvantage of this Ca2+-measuring system is that it involved placing a photometry window over the macula densa plaque, so it was not possible to glean information simultaneously from surrounding cells or other elements of the juxtaglomerular apparatus (JGA). This limitation is resolved by the use of either wide-field or confocal imaging, whereby information can be simultaneously obtained from a variety of structures from the JGA. In these studies, the application of imaging technologies resulted in two significant findings. First, macula densa [Ca2+]i was significantly lower compared with cTAL cells or other surrounding JGA structures. The reason for this finding is, at the present time, unclear. The second finding of this study was the novel observation that certain tubular cells surrounding the macula densa plaque and other epithelial cells in the cTAL and early DT exhibited a pattern of Ca2+ oscillations. This observation led us to focus on the characterization of these oscillating cells as a potential new element in JGA signaling.
One reason that these oscillating tubular cells may be of interest in JGA signaling is based on ultrastructural studies by Barajas et al.3 that suggested that the intimate tubulovascular connection described originally at the macula densa extends beyond the borders of the macula densa plaque by approximately 100 μm; whereas Dorup et al.7 found a close anatomic association between the late DT/connecting tubular segment and afferent arteriole in rat superficial cortex. As shown in Figure 1, we observed that the region of contact between the tubular epithelium and the afferent arteriole, in rabbit, is not limited to the macula densa plaque: The afferent arteriole is positioned next the early DT for approximately 100 μm. It should be noted that the initial post–macula densa tubular epithelium consists of the DT and the connecting tubule. There seems to be some variability among nephrons and between species in terms of distance between transitions from one tubular segment to another. In this work, post–macula densa tubule is collectively referred to as DT.
To characterize Ca2+ oscillations in epithelial cells adjacent to the macula densa, we used wide-field ratiometric imaging with fura-2 as well as four-dimensional imaging using multiphoton confocal microscopy. The tubular epithelial cells in the perimeter of the macula densa before and after the glomerulus and on the opposite side of the macula densa demonstrated large spontaneous oscillations in [Ca2+]i. Similar to a recent study reporting spontaneous [Ca2+]i oscillations in isolated medullary thick ascending limbs,8 occasionally we were able to detect spontaneous [Ca2+]i oscillations in the cTAL cells several hundred micrometers upstream from the macula densa. The finding that cells in the perimeter of the macula densa also demonstrate spontaneous oscillations in membrane potential and that depolarization of the apical or basolateral membrane led to the cessation of [Ca2+]i oscillations suggest that the generation of oscillations involves cyclic changes in membrane potential that drive depolarization-induced calcium entry. This scenario is further supported by the fact that Ca2+ oscillations depended on the presence of extracellular Ca2+; however, for technical reasons, we were not able to monitor [Ca2+]i and membrane potential concurrently, so although it seems unlikely, we cannot exclude the possibility that [Ca2+]i oscillations and membrane potential oscillations were occurring in different cells or that they were not associative.
The functional expression of calcium-sensing receptor has been implicated in the generation of oscillatory calcium signaling.9,10 Immunohistochemical studies indicated a high level of expression of the calcium-sensing receptor in renal tubules that are at or near the glomerular pole, including the macula densa segment.5 In these studies, we found that activation of the calcium-sensing receptor produced increases in Ca2+ oscillations and elevations in [Ca2+]i, suggesting that calcium-sensing receptor contributes to Ca2+ signaling in the perimacular tubular cells.
Because increases in [NaCl]L have been implicated in the initiation of TGF responses, we investigated the effect of changes in luminal environment on [Ca2+]i in perimacular cTAL cells. We found that elevations in [NaCl]L resulted in marked increases in the amplitude of oscillations and increases in average [Ca2+]i in the perimacular oscillatory cells. The finding that luminal administration of furosemide produced marked attenuation of [NaCl]L-dependent calcium responses whereas luminal hydrochlorothiazide had no effect suggests that the cells, including the perimacular cTAL cells, are reminiscent of the TAL cells in terms of their apical salt-sensing/transport characteristics, and their [NaCl]L-dependent intracellular calcium responses are at least partially mediated through apical Na+:2Cl−:K+ co-transport. Interestingly, there was also an effect of luminal flow to increase the amplitude of Ca2+ oscillations in perimacular cTAL cells. This finding is consistent with recent studies that investigated the mechanosensory function of apically located primary cilia. It has been shown that the bending of cilia that occurs in response to changes in luminal flow induces increases in [Ca2+]i as a result, at least in part, of Ca2+ entry via polycystin-2.11 All renal epithelial cells (with the possible exception of intercalated cells of the collecting duct) possess cilia, and this is therefore consistent with the flow-dependent alterations in [Ca2+]i in perimacular cells.
Interestingly, the frequency of oscillations in perimacular cTAL cell [Ca2+]i is remarkably close to that of TGF-dependent oscillations in tubular fluid flow and renal blood flow in anesthetized animals.12–17 We do not have evidence that the increases in DT [Ca2+]i contributed to or were associated with the activation of afferent arteriole smooth muscle cell [Ca2+]I; however, these new findings are at least suggestive and should stimulate future research efforts in understanding communication processes between tubule and glomerular structures.
CONCISE METHODS
Materials
All materials were purchased from Sigma (St. Louis, MO) unless otherwise stated. Fluo-4/AM, fluo-3/AM, and DiBAC4(3) were obtained from Molecular Probes (Eugene, OR); fura-2 was from Teflabs (Austin, TX).
Isolated Perfused cTAL-DT with Attached Glomerulus and Simultaneously Perfused Afferent Arteriole
The animal protocol used in these studies was approved by the Institutional Animal Care and Use Committee at the Medical University of South Carolina (Charleston, SC). Superficial afferent arterioles with glomeruli and associated tubular segments containing the cTAL and DT were microdissected from rabbit kidneys (New Zealand white rabbits; 0.5 to 1.0 kg; Myrtle's Rabbitry, Thompson Station, TN; n = 41 animals in total) and perfused in vitro using methods similar to those described previously.18 All experiments were conducted at 37°C.
Experimental Procedures
Luminal perfusion and the exchange of solutions were achieved as described previously.18 The estimated baseline tubular flow was 20 nl/min. For assessment of the effect of changes in [NaCl]L on the epithelial calcium signaling, the perfusate was changed from low-salt to high-salt solution with concomitant alterations in osmolality (Table 1) and then back to control.
Table 1.
Composition of experimental solutionsa
| Parameter | Dissection | Perfusion
|
Bath | |
|---|---|---|---|---|
| Low Salt | High Salt | |||
| NaCl | 25 | 20 | 80 | 150 |
| KCl | 5 | – | – | 5 |
| Na2HPO4 | 1.6 | 1.6 | 1.6 | 1.6 |
| NaH2PO4 | 0.4 | 0.4 | 0.4 | 0.4 |
| CaCl2 | 1.5 | – | – | 1.5 |
| MgSO4 | 1 | 1 | 1 | 1 |
| Glucose | 5 | 5 | 5 | 5 |
| K gluconate | – | 5 | 5 | – |
| Ca gluconate | – | 3 | 3 | – |
| N-methyl-d-glucamine cyclamate | 125 | – | – | – |
| Mannitol | – | – | – | – |
| Urea | – | – | – | – |
| HEPES | 10 | 25 | 25 | 10 |
| Osmolality (mOsm/kg H2O) | 325 | 98 | 210 | 305 |
Concentrations are given in mmol/L. The pH of the dissection and bathing solutions was set to 7.4 with NaOH, whereas that of the perfusion solutions was adjusted to 7.2 with NMDG at 37°C. Osmolality of solutions was set with mannitol using a freezing-point depression osmometer.
Multiphoton Fluorescence Microscopy
The preparations were loaded with the acetoxymethyl ester conjugates of the intracellular calcium-sensing dyes fluo-4 or fluo-3 (10−5 mol/L) added to the arterial and tubular perfusates and to the bath. The dyes were excited at 800 nm using a Mira 900 mode-locked titanium-sapphire femtosecond pulsed laser (Coherent, Santa Clara, CA), coupled to a confocal imaging system (Leica Microsystems, Heidelberg, Germany). Fluorescence emission was detected using a ×100 objective at 515 nm. In other experiments, the preparation was loaded with the membrane potential–sensitive dye DiBAC4(3), added to the bath (10−5 mol/L), and imaged at emission wavelengths of 500 and 600 nm.19
Wide-Field Fluorescence Microscopy
cTAL-DT tubular segments were loaded with intracellular calcium-sensing dye fura-2 by adding fura-2/AM (10−5 mol/L) to the luminal perfusate. Loading required approximately 15 min. [Ca2+]i was measured in fura-2–loaded epithelial cells with dual-excitation wavelength fluorescence microscopy (PTI, Lawrenceville, NJ), as described previously.20
Image Analyses
Volume rendering and segmentation were performed with a custom-compiled version of Voxx21 and Amira software, respectively. Matlab was used for frequency domain analysis.22
Statistical Analysis
Data are expressed as individual values and means ± SEM. Statistical analysis was performed with paired t test.
DISCLOSURES
None.
Acknowledgments
This work was supported by grant 32032 from the National Institute of Diabetes and Digestive and Kidney Diseases, Department of Health and Human Services (Bethesda, MD) to P.D.B. and Scientist Development grant 0630096N from the American Heart Association (Dallas, TX) to P.K.
Published online ahead of print. Publication date available at www.jasn.org.
Supplemental information for this article is available online at http://www.jasn.org/.
REFERENCES
- 1.Golgi C: Notes on the histology of human and mammalian kidney and on the histogenesis of the nephron. Atti della Reale Accademia dei Lincei 5: 334–342, 1889 [Google Scholar]
- 2.Schnermann J, Briggs JP: Function of the juxtaglomerular apparatus: Control of glomerular hemodynamics and renin secretion. In: The Kidney Physiology & Pathophysiology, 3rd Ed., edited by Seldin DW, Giebisch G, Philadelphia, Lippincott Williams & Wilkins, 2000, pp 945–980
- 3.Barajas L, Salido EC, Liu L, Powers KV: The juxtaglomerular apparatus: A morphologic perspective. In: Hypertension: Pathophysiology, Diagnosis, and Management, 2nd Ed., edited by Laragh JH, Brenner BM, New York, Raven Press, Ltd., 1995, pp 1335–1348
- 4.Barajas L: Anatomy of the juxtaglomerular apparatus. Am J Physiol 237: F333–F343, 1979 [DOI] [PubMed] [Google Scholar]
- 5.Riccardi D, Hall AE, Chattopadhyay N, Xu JZ, Brown EM, Hebert SC: Localization of the extracellular Ca2+/polyvalent cation-sensing protein in rat kidney. Am J Physiol 274: F611–F622, 1998 [DOI] [PubMed] [Google Scholar]
- 6.Peti-Peterdi J, Bell PD: Cytosolic [Ca2+] signaling pathway in macula densa cells. Am J Physiol 277: F472–F476, 1999 [DOI] [PubMed] [Google Scholar]
- 7.Dorup J, Morsing P, Rasch R: Tubule-tubule and tubule-arteriole contacts in rat kidney distal nephrons: A morphologic study based on computer-assisted three-dimensional reconstructions. Lab Invest 67: 761–769, 1992 [PubMed] [Google Scholar]
- 8.Geyti CS, Odgaard E, Overgaard MT, Jensen ME, Leipziger J, Praetorius HA: Slow spontaneous [Ca(2+)] (i) oscillations reflect nucleotide release from renal epithelia. Pflugers Arch 455: 1105–1117, 2007 [DOI] [PubMed] [Google Scholar]
- 9.Breitwieser GE, Gama L: Calcium-sensing receptor activation induces intracellular calcium oscillations. Am J Physiol Cell Physiol 280: C1412–C1421, 2001 [DOI] [PubMed] [Google Scholar]
- 10.Gerbino A, Ruder WC, Curci S, Pozzan T, Zaccolo M, Hofer AM: Termination of cAMP signals by Ca2+ and G(alpha)i via extracellular Ca2+ sensors: A link to intracellular Ca2+ oscillations. J Cell Biol 171: 303–312, 2005 [DOI] [PMC free article] [PubMed] [Google Scholar]
- 11.Nauli SM, Alenghat FJ, Luo Y, Williams E, Vassilev P, Li X, Elia AE, Lu W, Brown EM, Quinn SJ, Ingber DE, Zhou J: Polycystins 1 and 2 mediate mechanosensation in the primary cilium of kidney cells. Nat Genet 33: 129–137, 2003 [DOI] [PubMed] [Google Scholar]
- 12.Holstein-Rathlou NH: A closed-loop analysis of the tubuloglomerular feedback mechanism. Am J Physiol 261: F880–F889, 1991 [DOI] [PubMed] [Google Scholar]
- 13.Holstein-Rathlou NH, Marsh DJ: Renal blood flow regulation and arterial pressure fluctuations: A case study in nonlinear dynamics. Physiol Rev 74: 637–681, 1994 [DOI] [PubMed] [Google Scholar]
- 14.Yip KP, Holstein-Rathlou NH, Marsh DJ: Mechanisms of temporal variation in single-nephron blood flow in rats. Am J Physiol 264: F427–F434, 1993 [DOI] [PubMed] [Google Scholar]
- 15.Holstein-Rathlou NH, Leyssac PP: TGF-mediated oscillations in the proximal intratubular pressure: Differences between spontaneously hypertensive rats and Wistar-Kyoto rats. Acta Physiol Scand 126: 333–339, 1986 [DOI] [PubMed] [Google Scholar]
- 16.Leyssac PP, Baumbach L: An oscillating intratubular pressure response to alterations in Henle loop flow in the rat kidney. Acta Physiol Scand 117: 415–419, 1983 [DOI] [PubMed] [Google Scholar]
- 17.Layton HE, Pitman EB, Moore LC: Spectral properties of the tubuloglomerular feedback system. Am J Physiol 273: F635–F649, 1997 [DOI] [PubMed] [Google Scholar]
- 18.Komlosi P, Fintha A, Bell PD: Unraveling the relationship between macula densa cell volume and luminal solute concentration/osmolality. Kidney Int 70: 865–871, 2006 [DOI] [PubMed] [Google Scholar]
- 19.Burns DM, Stehno-Bittel L, Kawase T: Calcitonin gene-related peptide elevates calcium and polarizes membrane potential in MG-63 cells by both cAMP-independent and -dependent mechanisms. Am J Physiol Cell Physiol 287: C457–C467, 2004 [DOI] [PubMed] [Google Scholar]
- 20.Komlosi P, Peti-Peterdi J, Fuson AL, Fintha A, Rosivall L, Bell PD: Macula densa basolateral ATP release is regulated by luminal [NaCl] and dietary salt intake. Am J Physiol Renal Physiol 286: F1054–F1058, 2004 [DOI] [PubMed] [Google Scholar]
- 21.Clendenon JL, Phillips CL, Sandoval RM, Fang S, Dunn KW: Voxx: A PC-based, near real-time volume rendering system for biological microscopy. Am J Physiol Cell Physiol 282: C213–C218, 2002 [DOI] [PubMed] [Google Scholar]
- 22.Uhlen P: Spectral analysis of calcium oscillations. Sci STKE 2004: 115, 2004 [DOI] [PubMed] [Google Scholar]


