Abstract
OBJECTIVE—To investigate potential mechanisms of oxidative DNA damage in a rat model of type 1 diabetes and in murine proximal tubular epithelial cells and primary culture of rat proximal tubular epithelial cells.
RESEARCH DESIGN AND METHODS—Phosphorylation of Akt and tuberin, 8-oxo-7,8-dihydro-2′-deoxyguanosine (8-oxodG) levels, and 8-oxoG-DNA glycosylase (OGG1) expression were measured in kidney cortical tissue of control and type 1 diabetic animals and in proximal tubular cells incubated with normal or high glucose.
RESULTS—In the renal cortex of diabetic rats, the increase in Akt phosphorylation is associated with enhanced phosphorylation of tuberin, decreased OGG1 protein expression, and 8-oxodG accumulation. Exposure of proximal tubular epithelial cells to high glucose causes a rapid increase in reactive oxygen species (ROS) generation that correlates with the increase in Akt and tuberin phosphorylation. High glucose also resulted in downregulation of OGG1 protein expression, paralleling its effect on Akt and tuberin. Inhibition of phosphatidylinositol 3-kinase/Akt significantly reduced high glucose–induced tuberin phosphorylation and restored OGG1 expression. Hydrogen peroxide stimulates Akt and tuberin phosphorylation and decreases OGG1 protein expression. The antioxidant N-acetylcysteine significantly inhibited ROS generation, Akt/protein kinase B, and tuberin phosphorylation and resulted in deceased 8-oxodG accumulation and upregulation of OGG1 protein expression.
CONCLUSIONS—Hyperglycemia in type 1 diabetes and treatment of proximal tubular epithelial cells with high glucose leads to phosphorylation/inactivation of tuberin and downregulation of OGG1 via a redox-dependent activation of Akt in renal tubular epithelial cells. This signaling cascade provides a mechanism of oxidative stress–mediated DNA damage in diabetes.
Systemic complications are the major causes of morbidity and mortality in patients with diabetes (1). Oxidative stress leads to protein, lipid, and DNA modifications that cause cellular dysfunction and contribute to the pathogenesis of macro- and microvascular complications of diabetes, including diabetic nephropathy (2–6). Mitochondrion and nucleus, two major targets of oxidative stress, contain a variety of DNA repair enzymes to repair oxidant-induced DNA modifications (7,8). Damage most likely occurs when the endogenous antioxidant network and DNA repair systems are overwhelmed (9–11). However, it is essential for the cell to repair DNA damage induced by oxidants.
8-Oxo-7,8-dihydro-2′-deoxyguanosine (8-oxodG) is a sensitive marker of reactive oxygen species (ROS)–induced DNA damage (12,13). There is an increase in 8-oxodG levels in tissue of diabetic rats and in the urine of patients with type 1 and type 2 diabetes (13–15), with the levels being significantly higher in patients with albuminuria or with other diabetic complications (16). The steady-state level of 8-oxodG in DNA reflects its rate of generation and of repair. 8-OxodG in DNA is repaired primarily via the DNA base excision repair pathway (17). The DNA repair enzyme that recognizes and excises 8-oxodG is 8-oxoG-DNA glycosylase (OGG1) (18). Deficiency in DNA repair enzyme OGG1 has important functional consequences, compromising the ability of cells to repair DNA. The steady-state levels of 8-oxodG are significantly higher in tissues of OGG1 knockout mice compared with wild-type animals (19). OGG1 expression in the kidney of rats heterozygotes for tuberin is lower than that in wild-type rats (20). Moreover, treatment of tuberin-deficient rats with an oxidative DNA damaging agent greatly decreases renal OGG1 expression, with concomitant increase in 8-oxodG levels compared with wild-type rats (20). We have recently shown that OGG1 is regulated by tuberin, the product of the tumor suppressor gene, TSC-2 (21). Tuberin normally exists in an active state physically bound to hamartin, the product of TSC-1 gene, to form a stable complex (22). These two proteins function within the same pathway(s) regulating cell cycle, cell growth, adhesion, and vesicular trafficking (23,24). Activation of phosphatidylinositol 3-kinase (PI 3-kinase) and phosphorylation of serine/threonine kinase Akt/protein kinase B (PKB) by certain agonists lead to inactivation of tuberin (25–28). The PI 3-kinase/Akt pathway is activated in diabetes (29), and there is evidence that this activation is redox dependent in different cell types (30–32), including renal cells.
Little is known about DNA repair disturbances potentially contributing to DNA damage in diabetes. In the present study, we determined a potential mechanism by which ROS result in 8-oxodG accumulation and explored the role of tuberin phosphorylation and OGG1 in the kidney cortex of rats with type 1 diabetes. We also investigated the effect of high glucose on tuberin phosphorylation, OGG1 expression, and 8-oxodG accumulations in proximal tubular epithelial cells.
RESEARCH DESIGN AND METHODS
Two-month-old male Long Evans rats, weighing between 200 and 225 g, were purchased from Charles River Laboratories (Wilmington, MA). The animals were allowed food and water ad libitum before and during the experiments. The rats were divided into two groups of six rats per group. Group 2 was injected intravenously via the tail vein with 55 mg/kg body wt streptozotocin (STZ) (Sigma, St. Louis, MO) in sodium citrate buffer (0.01 mol/l, pH 4.5) under isofluorane inhalation anesthesia (Abbott, Abbott Park, IL) to induce type 1 diabetes. Group 1 (controls) was injected with an equivalent amount of sodium citrate buffer alone. Average serum glucose levels and body weight of both groups were measured at 4 weeks of diabetes. Animals were killed at 4 weeks, and the kidneys were removed rapidly. Cortical tissue was used for isolation of primary proximal tubular epithelial (RPTE) cells, and samples of cortical tissue were used for biochemical analysis.
Isolation and culture of RPTE cells.
Primary RPTE cells were isolated and cultured following the method of Glynne (33) with minor modifications. Renal cortical tissue was collected in cooled Hanks’ balanced salt solution (HBSS) containing 50 units/ml penicillin, 50 μg/ml streptomycin, and 0.125 μg/ml amphoterecin B. After the capsule was removed, the cortex was cut into small pieces, and the tissue fragments were suspended in 1 mg/ml (in HBSS) of type II collagenase (Worthington Biochemical) and incubated for 1 h at 37°C. The cells were centrifuged (200 × g, 5 min, 4°C) and seeded into 75-cm2 tissue culture flasks that had been coated with collagen S. The cells were grown in serum-free medium (Dulbecco's modified Eagle's medium [DMEM]/F-12; glucose concentration, 17 mmol/l) containing 15 mmol/l HEPES buffer, l-glutamine, and pyridoxine hydrochloride. The medium was supplemented with 10 ng/ml epidermal growth factor, 10 μg/ml insulin, 5 μg/ml transferrin, 5 ng/ml selenium, 36 ng/ml hydrocortisone, 4 pg/ml triodothyronin, 50 units/ml penicillin, 50 μg/ml streptomycin, and 0.125 μg/ml amphoterecin B. The cells were incubated at 37°C in humidified 5% CO2 in air.
SV-40 immortalized murine proximal tubular epithelial cells.
The murine proximal tubular epithelial (MCT) cells (provided by Dr. Eric Neilson, Vanderbilt University, Nashville, TN) were grown in DMEM containing 7% fetal bovine serum, 5 mmol/l glucose, 100 units/ml penicillin, 100 μg/ml streptomycin, and 2 mmol/l glutamine. Confluent cells were growth-arrested for 24 h in serum-free DMEM before experiments. MCT cells express in vivo properties of proximal tubular epithelial cells (34).
Reagents.
N-acetylcysteine (NAC), hydrogen peroxide, and Wortmannin were purchased from Sigma. LY294002 and Akt inhibitor IV were obtained from Calbiochem (La Jolla, CA).
In vivo experiments.
Homogenates of kidney cortex were prepared in radioimmune precipitation assay buffer (1× PBS, 1% Nonidet P-40, 0.5% sodium deoxycholate, 0.1% SDS containing phenylmethylsulfonyl fluoride, aprotinin, sodium orthovanadate, and protease inhibitor tablet [complete Mini; Boehringer-Mannheim] containing 50 mg/ml antipain dihydrochloride, 40 mg/ml bestatin, 60 mg/ml chymostatin, 10 mg/ml E-64, 0.5 mg/ml leupeptin, 0.7 mg/ml pepstatin, 300 mg/ml phosphoramidon, 1 mg/ml pefabloc SC, 0.5 mg/ml EDTA disodium salt, and 2 mg/ml aprotinin).
The tissue was centrifuged at 14,000 × g for 30 min at 4°C, and protein concentrations were determined with the Bradford assay (35) using BSA as a standard. For immunoblotting, 100 μg protein was subjected to 8% SDS-PAGE. Proteins were transferred to polyvinylidene difluoride (PVDF) membranes at a constant voltage of 200 V for 16 h. The PVDF membranes were blocked for 1 h in 5% nonfat dried milk in Tris-buffered saline-0.1% Tween buffer (25 mmol/l Tris-HCl, 0.2 mmol/l NaCl, and 0.1% Tween 20 [vol/vol] pH 7.6; TBST). The membrane was washed twice with TBST and then incubated overnight at 4°C with the respective primary antibodies. Phospho-tuberin, phospho-Akt, and Akt antibodies were from Cell Signaling (Beverly, MA), OGG1 antibody was from Novus Biologicals, and tuberin and glyceraldehyde-3-phosphate dehydrogenase (GAPDH) antibodies were obtained from Santa Cruz Biotechnology. After extensive washing of membrane with TBST buffer, anti-rabbit immunoglobulin conjugated with horseradish peroxidase was added at a 1:5,000 dilution and incubated for 1 h at room temperature. An enhanced chemiluminescence kit (Amersham, Piscataway, NJ) was used to identify protein expression. Expression of each protein was quantified by densitometry using NIH Image 1.62 software and normalized to a loading control.
In vitro experiments.
MCT and primary RPTE cells were seeded at a density of 0.5 × 10⁶ cells on 60-mm Petri dishes in 5 mmol/l glucose (normal glucose). When cells reached 90% confluency, serum was withdrawn for 24 h, and cells were treated with high glucose (25 mmol/l glucose), hydrogen peroxide, and/or PI 3-kinase and Akt inhibitors under serum-free conditions for various time points as indicated. The cells were lysed in radioimmune precipitation assay buffer.
Measurement of intracellular ROS production.
The peroxide-sensitive fluorescent probe 2′,7′-dichlorodihydrofluorescein diacetate (DCF-DA; Molecular Probes, Carlsbad, CA) was used to assess the generation of intracellular ROS as described previously (30). This compound is converted by intracellular esterases to DCF, which is then oxidized by hydrogen peroxide to the highly fluorescent DCF. MCT cells were grown in chamber slides. Serum-deprived cells were washed with HBSS loaded with 10 μmol/l DCF-DA and incubated for 30 min at 37°; 25 mmol/l glucose was added for the indicated time periods. Differential interference contrast images were obtained simultaneously using an Olympus inverted microscope with ×40 Aplanfluo objective and an Olympus fluoview confocal laser-scanning attachment. The DCF fluorescence was measured with an excitation wavelength of 488 nm of light, and its emission was detected using a 510- to 550-nm band pass filter. Alternatively, cells were grown in six-well plates and serum-deprived for 24 h. Immediately before the experiments, cells were washed with Hanks’ balanced salt solution without phenol red and then incubated for 30 min in the dark at 37°C with the same solution containing the peroxide-sensitive fluorophore DCF-DA (Molecular Probes) at 5 μmol/l. They were then incubated with 25 mmol/l glucose for various time points. DCF-DA fluorescence was detected at excitation and emission wavelengths of 488 and 520 nm, respectively, as measured with a multiwell fluorescence plate reader (Wallac 1420 Victor2; Perkin-Elmer Life Sciences), as described previously (31).
Immunostaining of OGG1.
OGG1 expression was also assessed by immunofluorescence histochemistry as previously described (36). Acetone-fixed frozen kidney sections (4 μm) were incubated with nonimmune donkey IgG to block nonspecific binding and then incubated with rabbit anti-OGG1 primary antibodies followed by fluorescein isothiocyanate (FITC)–labeled donkey anti-rabbit IgG (Chemicon International, Temecula, CA) as secondary antibodies for signal detection. All incubations of primary and secondary antibodies were for 30 min, with three washes with PBS containing 0.1% BSA and 5 min each between steps. Controls consisted of PBS/BSA in place of primary antibody followed by detection procedures as outlined above. Kidney sections were viewed and photographed using an Olympus Research microscope equipped for epifluorescence with excitation and band pass filters. FITC red signals for OGG1 were detected using a filter with excitation at 535 nm.
Immunostaining of 8-oxodG.
A double fluorescent labeling method was used as previously described (20) with minor modifications. MCT cells in chamber slides were serum-starved for 24 h and incubated with 25 mmol/l glucose for indicated time periods. The cells were washed with PBS, fixed, and stained with mouse antibody against 8-oxodG (Biodesign International) followed by treatment with anti-mouse IgG (1:200) conjugated with FITC. The slides were reacted with Vectashield mounting medium with propidium iodide (Vector Laboratories, Burlingame, CA). In this assay, DNA was labeled with propidium iodide, and 8-oxodG was identified by the primary monoclonal antibody and FITC-conjugated secondary antibody. FITC green signals for 8-oxodG were detected using a filter with excitation range 450–490 nm and propidium iodide red signals for nuclear DNA using a filter with excitation at 535 nm. FITC and propidium iodide were detected using Olympus FV-500 Laser Scanning Confocal microscopy. To demonstrate staining specificity, control cells were stained without primary antibody.
8-OxodG assay.
Mitochondria and nuclear DNA fractions were isolated from rat kidney cortex using a mitochondria and nuclear fractionation kit according to the manufacturer's instructions (Pierce, Rockford, IL). Detection of deoxyguanosine and 8-oxodG was performed on DNA hydrolyzed with nuclease P1 and alkaline phosphatase as previously described and validated (20). Aliquots (90 μl) of DNA hydrolysates were injected onto a Partisil 5-μm ODS-3 reverse-phase analytical column for high-performance liquid chromatography (HPLC) analysis with the eluate monitored with a UV photodiode array (SPD M10A; Shimadzo) and electrochemical detectors (ESA Coul Array). Authentic standards of 8-oxodG and deoxyguanosine were analyzed along with every batch of samples. Salmon sperm DNA (5–50 μg) was used as a positive control for DNA digestion reactions. Standard curves for deoxyguanosine and 8-oxodG were prepared and quantitation was performed by linear regression analyses. Data were expressed as picomoles 8-oxodG/dG × 10−5 in 90 μl DNA hydrolysate.
Statistics.
Data are presented as mean ± SE. Statistical differences were determined using ANOVA followed by Student Dunnett's (experimental vs. control) test using one trial analysis. P values <0.05 and <0.01 were considered statistically significant.
RESULTS
Diabetes is associated with an increase in Akt and tuberin phosphorylation and OGG1 downregulation in the renal cortex.
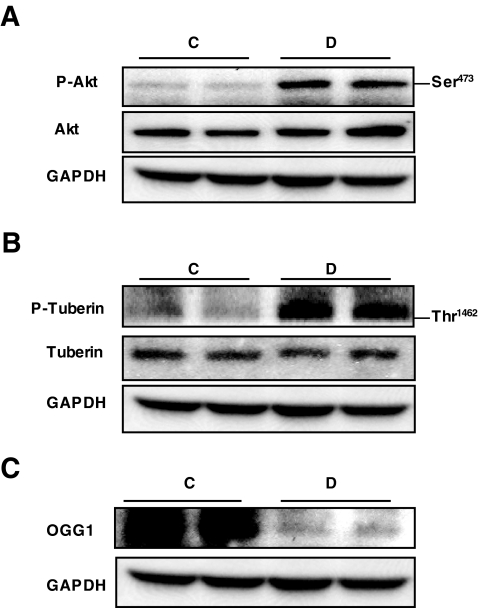
Akt is known to phosphorylate tuberin on Thr 1462, resulting in its inactivation (25). Recent studies suggest that high glucose activates Akt in various cell types, including renal cells (37). To test the hypothesis that hyperglycemia stimulates Akt and tuberin phosphorylation and downregulation of OGG1 in vivo, we used a rat model of type 1 diabetes. Type 1 diabetes was induced in rats by intravenous injection of 55 mg/kg body wt STZ. Blood glucose levels were 108 ± 5.9 and 426.8 ± 49.3 mg/dl and body weights were 391.7 ± 22.7 and 284.0 ± 9.6 g in control and diabetic animals at 4 weeks after STZ injection, respectively. Rats were killed at 4 weeks after STZ or vehicle injection. Phosphorylation of Akt on the Ser 473 and the Akt-dependent phosphorylation site on tuberin, Thr 1,462, were assessed in kidney cortex homogenates by Western blotting analysis (Fig. 1A and B). Akt phosphorylation on Ser 473 results in Akt activation, whereas phosphorylation of tuberin on Thr 1,462 results in its inactivation. Data in Fig. 1 show an increase in phosphorylation of Akt and tuberin in diabetic animals compared with controls. Partial deficiency in tuberin causes a decrease in OGG1 expression, suggesting that OGG1 is downstream of tuberin (20). To investigate the effect of hyperglycemia on OGG1 expression, we evaluated OGG1 protein expression in the kidney cortex of diabetic and control animals. The increase in tuberin phosphorylation is associated with a decrease in the expression of OGG1 protein in the diabetic animals compared with control animals (Fig. 1C).
FIG. 1.
Diabetes increases Akt and tuberin phosphorylation and decreases OGG1 protein expression. A–C: Representative immunoblot shows an increase in phospho-Akt (p-Akt) (A) and phospho-tuberin (p-tuberin) (B) and a decrease in OGG1 expression (C) in homogenized kidney cortex of diabetic (D) compared with control (C) rats. GAPDH was used as a loading control.
Diabetes is associated with a decrease in OGG1 expression and with an increase in 8-oxodG levels.
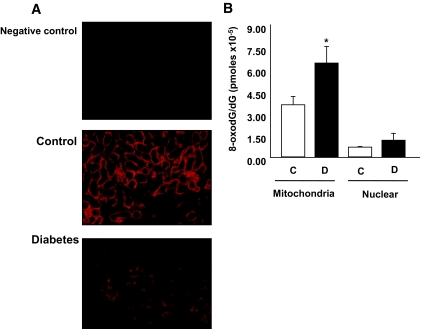
OGG1 is the major DNA base excision repair enzyme that recognizes and excises 8-oxodG. Therefore, we determined whether the change in OGG1 abundance influenced the accumulation of 8-oxodG in vivo. Immunohistochemical analysis of OGG1 shows that diabetes caused a decrease in OGG1 staining in kidney cortex of diabetic rats compared with control rats (Fig. 2A). In addition, mitochondria and nuclear DNA fractions were isolated from the renal cortex, and 8-oxodG levels were analyzed by HPLC with electrochemical detectors. Mitochondrial 8-oxodG levels were significantly higher in the kidney cortex of diabetic animals compared with the kidney cortex in the control group. There was very little increase in nuclear 8-oxodG levels in diabetic rat kidney cortex compared with kidney cortex from the control group (Fig. 2B). These data suggest that the low levels of OGG1 observed in the kidney cortex of diabetic animals may not be sufficient to repair the generated 8-oxodG.
FIG. 2.
Diabetes causes a decrease in OGG1 protein expression and increases 8-oxodG levels. A: Kidney cortex sections were stained with anti-OGG1 antibody. There is a decrease in OGG1 staining in kidney cortex of diabetic animals compared with the controls. B: 8-OxodG levels are higher in mitochondrial DNA fraction of kidney cortex of diabetic rats compared with control rats. Data are expressed as picomoles 8-oxodG/dG × 10−5 in 90 μl DNA hydrolysate. Significant difference from wild-type cells is indicated by **P < 0.01. (Please see http://dx.doi.org/10.2337/db07-1579 for a high-quality digital representation of this image.)
High glucose induces Akt and tuberin phosphorylation, increases 8-oxodG, and downregulates OGG1 in MCT cells.
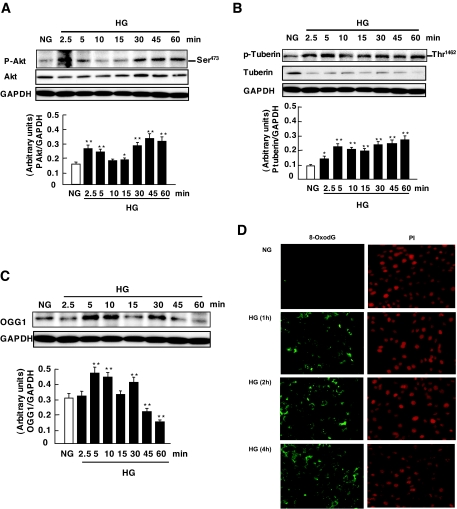
To investigate the role of high glucose in Akt and tuberin phosphorylation, MCT cells were incubated for the indicated time periods in serum-free medium containing either normal glucose or high glucose. High glucose caused a rapid increase in Akt and tuberin phosphorylation in a time-dependent manner, with effects that peaked at 2.5–5 min and subsided by 60 min (Fig. 3A and B). To assess the effect of high glucose on OGG1 expression, we evaluated OGG1 protein expression and 8-oxodG accumulation in MCT cells treated with high glucose for different time periods. A decrease in OGG1 protein expression was observed in MCT cells incubated with high glucose (Fig. 3C) with a maximum effect at 60 min. Consistent with OGG1 downregulation, immunohistochemical fluorescence staining of 8-oxodG was increased predominantly in mitochondria and to a much lower extent in nuclei after 60 min and more so after 2 and 4 h of exposure of the cells to high glucose (Fig. 3D). Mitotraker was used as a mitochondrial marker to confirm mitochondrial localization (data not shown). Collectively, these data demonstrate that high glucose induces Akt and that tuberin phosphorylation results in downregulation of OGG1 and an increase 8-oxodG levels.
FIG. 3.
Effects of high glucose (HG) on Akt/PKB and tuberin phosphorylation and OGG1 expression in MCT cells. A–C: Representative immunoblot shows an increase in phospho-Akt (p-Akt) (A) and phospho-tuberin (p-tuberin) (B) in MCT cells treated with high glucose (25 mmol/l glucose d-glucose) for the time periods indicated. GAPDH was used as loading control. Histograms in the bottom panel represent means ± SE of three independent experiments. Significant difference from nontreated cells is indicated by *P < 0.05 and **P < 0.01. D: Immunoflourescence shows an increase in mitochondrial and nuclear 8-oxodG staining in MCT treated with high glucose for 1 h—an effect that was more intense at 2 and 4 h compared with normal glucose. FITC for 8-oxodG (green color) and propidium iodide for nuclear staining (red color) were detected with excitation wavelengths at 450–490 nm and 535 nm, respectively. NG, normal glucose. (Please see http://dx.doi.org/10.2337/db07-1579 for a high-quality digital representation of this figure.)
PI 3-kinase/Akt pathways mediate high glucose–induced Akt phosphorylation and OGG1 protein downregulation in MCT cells.
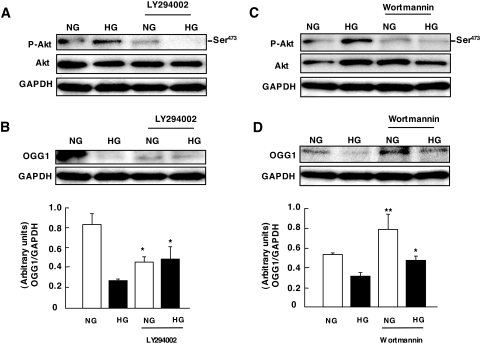
Activation of PI 3-kinase has been shown to be necessary and sufficient for growth factor–induced increase in Akt phosphorylation (38). PI 3-kinase–dependent activation of Akt in response to glucose has been demonstrated in MCT cells (37). The correlation between high glucose–induced Akt and tuberin phosphorylation and OGG1 downregulation led us to test the hypothesis that the PI 3-kinase/Akt pathway activated by glucose results in tuberin phosphorylation and OGG1 downregulation. Serum-starved MCT cells were pretreated with two structurally unrelated PI 3-kinase inhibitors, 50 μmol/l LY294002 and 100 nmol/l Wortmannin, before exposure of the cells to high glucose for 60 min. Figure 4A shows that glucose-induced Akt phosphorylation is prevented by both inhibitors. Moreover, a decrease in Akt phosphorylation in the presence of LY294002 (Fig. 4A) and Wortmannin (Fig. 4C) significantly attenuated the downregulation of OGG1 by high glucose (Fig. 4B and D). These data indicate that PI 3-kinase is an upstream mediator of Akt activation and OGG1 downregulation in response to high glucose.
FIG. 4.
Role of PI 3-kinase activation by high glucose (HG) on OGG1 expression in MCT cells. A and C: Representative immunoblot shows a decrease in phospho-Akt (p-Akt) expression in cells preincubated with 50 μmol/l LY294002 and 100 nmol/l Wortmannin, respectively, before exposure to high glucose for 60 min. B and D: Representative immunoblot shows an increase in OGG1 expression in cells preincubated with 50 μmol/l LY294002 and 100 nmol/l Wortmannin before exposure to high glucose for 60 min. Histograms in the bottom panel represent means ± SE of three independent experiments. Significant difference from nontreated cells is indicated by *P < 0.05 and **P < 0.01. NG, normal glucose.
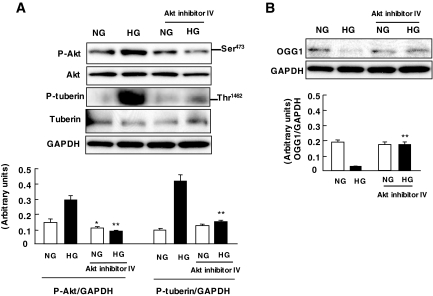
We next studied whether glucose-stimulated Akt is involved in OGG1 downregulation. MCT cells were preincubated with Akt inhibitor IV (25 μmol/l) for 1 h before exposure to high glucose. Inhibition of Akt prevented tuberin phosphorylation and restored the levels of OGG1 to those of cells incubated in normal glucose (Fig. 5A and B). These findings demonstrate that Akt mediates high glucose–induced downregulation of OGG1 in MCT cells.
FIG. 5.
Role of Akt/PKB phosphorylation by high glucose (HG) on OGG1 expression in MCT cells. A: Representative immunoblot shows a decrease in phospho-Akt (p-Akt) and phospho-tuberin (A) and an increase in OGG1 expression (B) in cells preincubated with 25 μmol/l Akt inhibitor IV before exposure to high glucose for 60 min. Histograms in the bottom panel represent means ± SE of three independent experiments. Significant difference from nontreated cells is indicated by *P < 0.05 and **P < 0.01. NG, normal glucose.
Phosphorylation of tuberin and downregulation of OGG1 are redox sensitive in MCT cells.
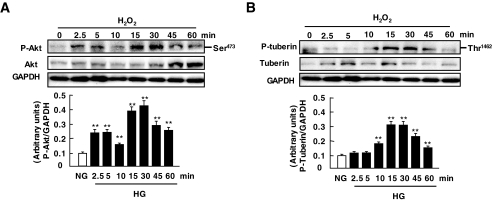
We next investigated a potential role for ROS in Akt and tuberin phosphorylation and downregulation of OGG1. Hydrogen peroxide has recently been shown to activate Akt in various cell types, including renal proximal tubular epithelial cells or mesangial cells (30–32,39,40). However, the effect of ROS generation on tuberin phosphorylation and OGG1 expression has not been investigated. MCT cells were treated with 100 μmol/l hydrogen peroxide for the indicated time periods in serum-free medium. Hydrogen peroxide induced Akt and tuberin phosphorylation with an effect seen as early as 2.5 min and a peak effect occurring at 5–15 min (Fig. 6A and B), whereas the maximum decrease in OGG1 was observed at 60 min (Fig. 6C). The time course kinetics of phosphorylation of Akt and tuberin paralleled those of downregulation of OGG1 by high glucose. These data demonstrate that phosphorylation of Akt and tuberin and downregulation of OGG1 are redox sensitive in MCT cells.
FIG. 6.
Effects of hydrogen peroxide on tuberin and Akt/PKb phosphorylation and OGG1 expression in MCT cells. A–C: Representative immunoblot shows an increase in phospho-Akt (p-Akt) (A) and phospho-tuberin (p-tuberin) (B) and a decrease in OGG1 expression (C) in MCT cells treated with 100 μmol/l H2O2. GAPDH was used as loading control. Histograms in the bottom panel represent means ± SE of three independent experiments. Significant difference from nontreated cells is indicated by *P < 0.05 and **P < 0.01. HG, high glucose; NG, normal glucose.
ROS are required for high glucose–induced Akt and tuberin phosphorylation and OGG1 downregulation in MCT cells.
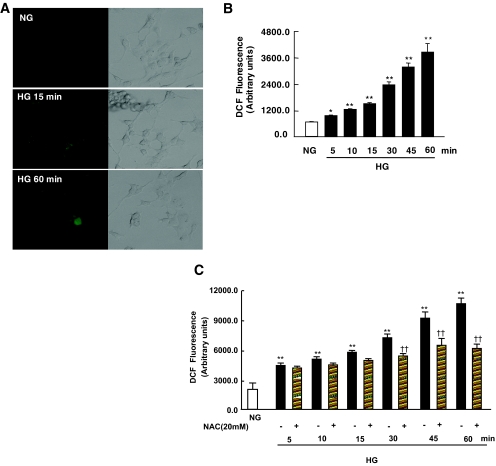
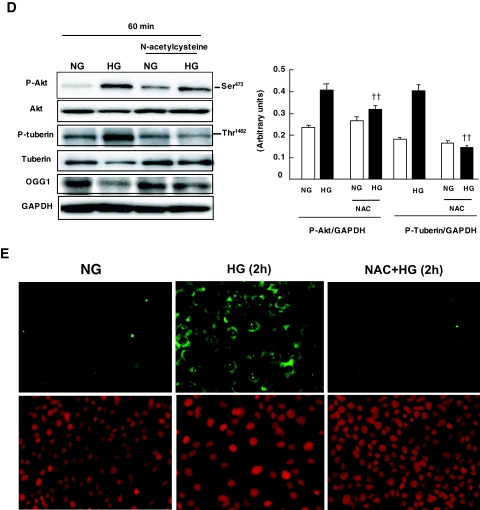
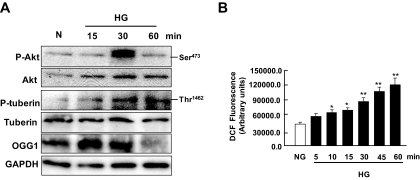
High glucose increases ROS production in vascular cells and in renal cells, including tubular epithelial cells or mesangial cells (2,4,41). The fact that oxidant-induced effects on Akt and tuberin phosphorylation correlate well with those of high glucose suggests that ROS may mediate the action of high glucose on Akt, tuberin, and OGG1. First, we evaluated the role of high glucose in the generation of intracellular ROS. MCT cells were incubated for the indicated time periods in serum-free medium containing either normal glucose or high glucose. High glucose significantly increased the fluorescence of DCF, a peroxide-sensitive probe, with a maximal effect apparent 60 min after treatment, as measured by confocal microscopy (Fig. 7A). Additionally, measurements were performed with a multiwell fluorescence plate reader to provide a better quantification of high glucose–induced ROS generation. Incubation of MCT cells with high glucose resulted in a rapid and time-dependent increase in DCF fluorescence seen as early as 5 min after treatment (Fig. 7B). These findings demonstrate that high glucose increases intracellular ROS generation in MCT cells. Next, we assessed whether ROS generation mediates the effect of high glucose–induced Akt and tuberin phosphorylation and OGG1 downregulation in MCT cells. Serum-starved cells were pretreated with the antioxidant NAC, a ROS scavenger. Pretreatment with 20 mmol/l NAC significantly inhibited ROS generation measured by DCF fluorescence in cells exposed to high glucose for 30 min (Fig. 7C). Moreover, pretreatment of the cells with NAC inhibited Akt and tuberin phosphorylation and upregulation of OGG1 protein expression in cells exposed to high glucose (Fig. 7D). Furthermore, pretreatment of the cells with NAC significantly reduced 8-oxodG staining compared with cells treated with high glucose alone (Fig. 7E). These data indicate that ROS are critical for high glucose–induced Akt and tuberin phosphorylation and downregulation of OGG1. High glucose increases Akt and tuberin phosphorylation and downregulates OGG1 in primary proximal tubular epithelial cells. To confirm the validity of these data obtained in the MCT immortalized cells, we studied the effects of high glucose on the phosphorylation of Akt and tuberin and on OGG1 protein expression in RPTE cells. Serum-deprived RPTE cells were treated with 25 mmol/l glucose for different periods of time. High glucose concentration caused an increase in phosphorylation of Akt and tuberin, with a peak at 30 min and subsiding by 60 min, compared with cells incubated with 5 mmol/l glucose (Fig. 8A). Moreover, the increase in phosphorylated Akt and phosphorylated tuberin is associated with a decrease in OGG1 expression in the cells incubated with 25 mmol/l glucose for 60 min (Fig. 8A). These data confirm our observation in the MCT immortalized cells.
FIG. 7.
Effect of high glucose (HG) concentration on the production of ROS in MCT cells. A: DCF fluorescence reflecting the relative levels of ROS was imaged with a confocal laser scanning fluorescence microscope in serum-deprived MCT cells treated with high glucose for the indicated time periods. B: DCF fluorescence was measured using the peroxide-sensitive fluorescent probe DCF-DA by a multiwell fluorescence plate reader in intact MCT cells treated with high glucose. Histogram represents means ± SE of three independent experiments. Significant difference from nontreated cells is indicated by *P < 0.05 and **P < 0.01. C: NAC blocks ROS generation measured using the peroxide-sensitive fluorescent probe DCF-DA in MCT cells treated with high glucose. Histogram represents means ± SE of three independent experiments. Significant difference from normal glucose (NG) is indicated by **P < 0.01 and from cells treated with NAC versus high glucose alone is indicated by ††P < 0.01. D: Effect of NAC on high glucose–induced Akt/PKB and tuberin phosphorylation and OGG1 expression in MCT cells. Representative immunoblot shows a decrease in phospho-Akt (p-Akt) and phospho-tuberin (p-tuberin) and an increase in OGG1 expression in cells preincubated with NAC before exposure to high glucose. E: NAC blocks 8-oxodG generation in cells treated with high glucose. Immunoflourescence shows a decrease in mitochondrial and nuclear 8-oxodG staining in MCT pretreated with NAC compared with cells treated with high glucose alone for 2 h. (Please see http://dx.doi.org/10.2337/db07-1579 for a high-quality digital representation of this image.)
FIG. 8.
Effect of high glucose (HG) concentration on Akt/PKB and tuberin phosphorylation and OGG1 expression in primary cultures of RPTE cells. A: Representative immunoblot shows an increase in phospho-Akt (p-Akt) and phospho-tuberin (p-tuberin) and a decrease in OGG1 expression in cells treated with high glucose for the time periods indicated. GAPDH was used as loading control. B: DCF fluorescence was measured using the peroxide-sensitive fluorescent probe DCF-DA by a multiwell fluorescence plate reader in intact RPTE cells treated with high glucose. Histogram represents means ± SE of three independent experiments. Significant difference from nontreated cells is indicated by *P < 0.05 and **P < 0.01.
To confirm that high glucose also increases the intracellular ROS generation in RPTE cells, the production of intracellular ROS was measured by quantification of the DCF fluorescence with a multiwell fluorescence plate reader. Stimulation of RPTE cells with 25 mmol/l glucose resulted in a rapid and time-dependent increase in DCF fluorescence, with the maximal effect (a threefold increase over control) apparent at 60 min after treatment (Fig. 8B). Collectively, these results confirm that high glucose elicits an increase in ROS in primary proximal tubular epithelial cells as well. Furthermore, it appears that the time course of intracellular hydrogen peroxide generation in response to high glucose is consistent with a potential role of ROS in downstream signaling events, particularly the regulation of redox-sensitive protein kinases and DNA repair.
DISCUSSION
In this study, we provide evidence that diabetes is associated with enhanced phosphorylation and inactivation of tuberin via the redox-dependent activation of Akt. We also demonstrate that diabetes-induced Akt and tuberin phosphorylation are associated with a decrease in OGG1 expression and accumulation of 8-oxodG in kidney cortex of diabetic rats. Our data also indicate that this pathway is activated in cultured renal tubular epithelial cells, the major cell type in the kidney cortex, after exposure of the cells to high glucose concentration. These findings indicate that the PI 3-kinase/Akt/tuberin/OGG1 pathway is highly relevant in the diabetic kidney and may contribute to oxidative stress–induced renal injury observed in diabetes. In diabetes, the renal tubule is subject to both direct and indirect insults. Tubular and interstitial lesions are prominent in diabetic patients (42). In a number of cells, high glucose promotes an increase in Akt phosphorylation (43,44). We show that high glucose phosphorylates tuberin on Thr 1,462, a site known to be targeted by Akt. High glucose activates the PI 3-kinase/Akt/mTOR signaling cascade to stimulate protein synthesis (37). Our data confirm these observations and show an early and sustained increase in Akt phosphorylation after exposure of the cells to high glucose. Thus, activation of Akt represents a very proximal step in the intracellular signaling pathway triggered by high glucose. The observation that PI 3-kinase and Akt inhibitors block the effect of high glucose on tuberin phosphorylation indicates that the PI 3-kinase/Akt pathway mediates the action of high glucose on tuberin. Of interest is that insulin- or IGF-I–induced tuberin phosphorylation is also inhibited by the PI 3-kinase inhibitor LY294002 (45). The concept that the PI 3-kinase/Akt pathway regulates tuberin is supported by other observations that the expression of a constitutively active PI 3-kinase or active Akt, including Akt1 or Akt2, induce tuberin phosphorylation (27). Phosphorylation of hamartin and/or tuberin may play an important role in the regulation of the tuberin-hamartin complex (46). Deficiency and/or enhanced phosphorylation of tuberin on Thr 1,462 results in its inactivation (26–28). Akt is known to phosphorylate tuberin at this site and results in its inactivation (26–28). Phosphorylation of tuberin by Akt affects its function through at least two mechanisms: first, phosphorylation decreases the activity of tuberin; second, phosphorylation destabilizes tuberin by disrupting the complex formation between hamartin and tuberin, resulting in ubiquitination of free tuberin and its degradation by the proteosome (27). Our data show that high glucose causes a rapid Akt-dependent increase in tuberin phosphorylation in MCT cells. The fact that the acute exposure of cells to high glucose is sufficient to elicit proliferation and then apoptosis of human proximal tubule epithelial cells suggests that episodes of increases in glucose may contribute to cell injury and to epithelial cell dysfunction (47).
We also found that high glucose–induced tuberin phosphorylation by Akt is associated with biological consequences, namely a decrease in OGG1 expression and increased 8-oxodG levels. The decrease in tuberin protein expression is associated with a decrease in OGG1 expression (20). Therefore, tuberin deficiency, through its phosphorylation, is upstream of OGG1 in the pathway linking high glucose to DNA damage. Collectively, the data indicate that glucose acts through the PI 3-kinase/Akt/tuberin pathway to downregulate OGG1, resulting in the accumulation of oxidized DNA. 8-OxodG is a product of oxidative DNA damage following specific enzymatic cleavage after the ROS-induced 8-hydroxylation of guanine bases in the mitochondrial and nuclear DNA (11,12). 8-OxodG is known to be a sensitive marker of oxidative DNA damage and of the total systemic oxidative stress in vivo (13). Importantly, 8-oxoG appears to play a role in tissue cell injury via the induction of apoptotic cell death (48). Increased number of 8-oxodG–positive islet cells was found in the human pancreas from type 2 diabetic subjects (49). In addition, our data confirm a previous report of the accumulation of 8-oxodG primarily in the mitochondrial DNA and to a lesser extent nuclear DNA in kidney cortex of diabetic rats. 8-OxodG levels were rapidly normalized by insulin treatment, suggesting the involvement of hyperglycemia in oxidative DNA damage (50).
It is known that Akt is activated by oxidative stress in a variety of cell types, including renal cells. Importantly, we show that ROS, and specifically hydrogen peroxide, directly induce Akt activation and tuberin phosphorylation, resulting in downregulation of OGG1 in MCT cells, indicating that ROS are potential upstream mediators of the effects of high glucose on oxidative DNA damage. We also show that exposure of MCT to high glucose elicits a rapid increase in intracellular ROS production. This rapid effect supports the contention that ROS mediate early signaling events, such as Akt activation in response to high glucose. Moreover, the effect of high glucose on ROS generation, Akt/tuberin phosphorylation, OGG1 downregulation, and 8-oxodG accumulation is markedly reduced by the antioxidant NAC. This is in agreement with a recent study showing that pretreatment of human proximal tubule epithelial cells with NAC reversed glucose-mediated ROS production (51). Collectively, our data indicate that ROS are signaling molecules responsible for Akt phosphorylation initiated by high glucose leading to tuberin phosphorylation and OGG1 protein downregulation. To confirm and validate our observations in the immortalized MCT cells, we isolated primary RPTE cells from rat kidney cortex. Similar to MCT cells, glucose enhances ROS generation in primary RPTE cells and is associated with an increase in Akt and tuberin phosphorylation and downreguation of OGG1. These data show that MCT cells are a relevant model and confirm that phosphorylation and inactivation of tuberin via the redox-dependent activation of Akt play a major role in OGG1 downregulation and 8-oxodG accumulation.
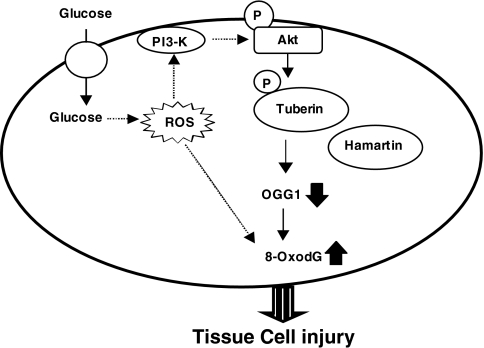
In summary, our data provide the first evidence that hyperglycemia and high glucose lead to phosphorylation/inactivation of tuberin and downregulation of DNA repair enzyme OGG1 via the redox-dependent activation of Akt (Fig. 9). This signaling cascade may play a role in oxidative stress–mediated DNA damage induced by hyperglycemia during diabetic nephropathy. Recurrent acute exposure of renal cells to high glucose during diabetes has been recently proposed to be involved in renal injury (51). Our data shed light on the molecular mechanisms implicated in these events. The present study provides additional rationale for maintaining tight control of plasma glucose to prevent oxidative DNA damage in diabetes.
FIG. 9.
Proposed model of oxidative DNA damage in diabetes.
Acknowledgments
S.S. is a recipient of The Research Scholar Award from The Italian Society of Nephrology. H.E.A. has received support from the George M. O'Brien Kidney Center Development and Feasibility program and National Institutes of Health Grant R37-DK-33665. S.L.H. has received a New Investigator Award from South Texas Veterans Healthcare System and grants from The National Kidney Foundation of South and Central Texas, the American Diabetes Association, and the George M. O'Brien Kidney Center Development and Feasibility program. Y.G. has received grants from the American Heart Association South Central Affiliate, the Juvenile Diabetes Research Foundation (Regular Research Grant), and the George M. O'Brien Kidney Center Development and Feasibility program.
Confocal fluorescence microscopy was performed in the Core Optical Imaging Facility supported by the University of Texas Health Science Center and the San Antonio Cancer Institute, and the immunostaining was performed at the Morphology Core of the George O’ Brien Kidney Research Center.
Published ahead of print at http://diabetes.diabetesjournals.org on 3 July 2008.
The costs of publication of this article were defrayed in part by the payment of page charges. This article must therefore be hereby marked “advertisement” in accordance with 18 U.S.C. Section 1734 solely to indicate this fact.
REFERENCES
- 1.Brownlee M: Biochemistry and molecular cell biology of diabetic complications. Nature 414:813–820, 2001 [DOI] [PubMed] [Google Scholar]
- 2.Lee HB, Yu MR, Yang Y, Jiang Z, Ha H: Reactive oxygen species-regulated signaling pathways in diabetic nephropathy. J Am Soc Nephrol 14:S241–S245, 2003 [DOI] [PubMed] [Google Scholar]
- 3.Wolf G: New insights into the pathophysiology of diabetic nephropathy: from haemodynamics to molecular pathology. Eur J Clin Invest 34:785–796, 2004 [DOI] [PubMed] [Google Scholar]
- 4.Brownlee M: The pathobiology of diabetic complications: a unifying mechanism. Diabetes 54:1615–1625, 2005 [DOI] [PubMed] [Google Scholar]
- 5.Evans JL, Goldfine ID, Maddux BA, Grodsky GM: Oxidative stress and stress activated signaling pathways: a unifying hypothesis of type 2 diabetes. Endocr Rev 23:599–622, 2002 [DOI] [PubMed] [Google Scholar]
- 6.Greenman IC, Gomez E, Moore CE, Herbert TP: Distinct glucose-dependent stress responses revealed by translational profiling in pancreatic beta-cells. J Endocrinol 192:179–187, 2007 [DOI] [PMC free article] [PubMed] [Google Scholar]
- 7.Turrens JF: Mitochondrial formation of reactive oxygen species. J Physiol 552:335–344, 2003 [DOI] [PMC free article] [PubMed] [Google Scholar]
- 8.Evans MD, Dizdaroglu M, Cooke MS: Oxidative DNA damage and disease: induction, repair and significance. Mutat Res 567:1–61, 2004 [DOI] [PubMed] [Google Scholar]
- 9.Hutter E, Skovbro M, Lener B, Prats C, Rabol R, Dela F, Jansen-Durr P: Oxidative stress and mitochondrial impairment can be separated from lipofuscin accumulation in aged human skeletal muscle. Aging Cell 6:245–256, 2007 [DOI] [PubMed] [Google Scholar]
- 10.Maiese K, Morhan SD, Chong ZZ: Oxidative stress biology and cell injury during type 1 and type 2 diabetes mellitus. Curr Neurovasc Res 4:63–71, 2007 [DOI] [PMC free article] [PubMed] [Google Scholar]
- 11.Rachek LI, Musiyenko SI, LeDoux SP, Wilson GL: Palmitate induced mitochondrial deoxyribonucleic acid damage and apoptosis in L6 rat skeletal muscle cells. Endocrinology 148:293–299, 2007 [DOI] [PubMed] [Google Scholar]
- 12.Umemura T, Sai K, Takagi A, Hasegawa R, Kurokawa Y: Formation of 8-hydroxydeoxyguanosine (8-OH-dG) in rat kidney DNA after intraperitoneal administration of ferric nitrilotriacetate (Fe-NTA). Carcinogenesis 11:345–347, 1990 [DOI] [PubMed] [Google Scholar]
- 13.Dandona P, Thusu K, Cook S: Oxidative damage to DNA in diabetes mellitus. Lancet 347:444–445, 1996 [DOI] [PubMed] [Google Scholar]
- 14.Leinonen J, Lehtimaki T, Toyokuni S: New biomarker evidence of oxidative DNA damage in patients with non-insulin-dependent diabetes mellitus. FEBS Lett 417:150–152, 1997 [DOI] [PubMed] [Google Scholar]
- 15.Hinokio Y, Suzuki S, Hirai M, Chiba M, Hirai A, Toyota T: Oxidative DNA damage in diabetes mellitus: its association with diabetic complications. Diabetologia 42:995–998, 1999 [DOI] [PubMed] [Google Scholar]
- 16.Nishikawa T, Sasahara T, Kiritoshi S: Evaluation of urinary 8-hydroxydeoxy-guanosine as a novel biomarker of macrovascular complications in type 2 diabetes. Diabetes Care 26:1507–1512, 2003 [DOI] [PubMed] [Google Scholar]
- 17.Smart DJ, Chipman JK, Hodges NJ: Activity of OGG1 variants in the repair of prooxidant-induced 8-oxo-2′-deoxyguanosine. DNA Repair (Amst) 5:1337–1345, 2006 [DOI] [PubMed] [Google Scholar]
- 18.Mitra S, Boldogh I, Izumi T, Hazra TK: Complexities of the DNA base excision repair pathway for repair of oxidative DNA damage. Environ Mol Mutagen 38:180–190, 2001 [DOI] [PMC free article] [PubMed] [Google Scholar]
- 19.de Souza-Pinto NC, Eide L, Hogue BA, Thybo T, Stevnsner T, Seeberg E, Klungland A, Bohr VA: Repair of 8-oxodeoxyguanosine lesions in mitochondrial DNA depends on the oxoguanine DNA glycosylase (OGG1) gene and 8-oxoguanine accumulates in the mitochondrial DNA of OGG1-defective mice. Cancer Res 14:5378–5381, 2001 [PubMed] [Google Scholar]
- 20.Habib SL, Phan MN, Patel SK, Li D, Monks TJ, Lau SS: Reduced constitutive 8-oxoguanine-DNA glycosylase expression and impaired induction following oxidative DNA damage in the tuberin deficient Eker rat. Carcinogenesis 24:573–582, 2003 [DOI] [PubMed] [Google Scholar]
- 21.Habib SL, Riley DJ, Bhandari B, Mahimainathan L, Choudhury GG, Abboud HE: Tuberin regulates the DNA repair enzyme OGG1. Am J Physiol Renal Physiol 294:F281–F290, 2007 [DOI] [PubMed] [Google Scholar]
- 22.Plank TL, Yeung RS, Henske EP: Hamartin, the product of the tuberous sclerosis 1 (TSC1) gene, interacts with tuberin and appears to be localized to cytoplasmic vesicles. Cancer Res 58:4766–4770, 1998 [PubMed] [Google Scholar]
- 23.Van Slegtenhorst M, Nellist M, Nagelkerken B, Cheadle J, Snell R, van den Ouweland A, Reuser A, Sampson J, Halley D, van der Sluijs P: Interaction between hamartin and tuberin, the TSC1 and TSC2 gene products. Hum Mol Genet 7:1053–1057, 1998 [DOI] [PubMed] [Google Scholar]
- 24.Hengstschlager M, Rodman DM, Miloloza A, Hengstschlager-Ottnad E, Rosner M, Kubista M: Tuberous sclerosis gene products in proliferation control. Mutat Res 488:233–239, 2001 [DOI] [PubMed] [Google Scholar]
- 25.Manning BD, Tee AR, Logsdon MN, Blenis J, Cantley LC: Identification of the tuberous sclerosis complex-2 tumor suppressor gene product tuberin as a target of the phosphoinositide 3-kinase/akt pathway. Mol Cell 10:151–162, 2002 [DOI] [PubMed] [Google Scholar]
- 26.Dan HC, Sun M, Yang L, Feldman RI, Sui XM, Ou CC, Nellist M, Yeung RS, Halley DJ, Nicosia SV, Pledger WJ, Cheng JQ: Phosphatidylinositol 3-kinase/Akt pathway regulates tuberous sclerosis tumor suppressor complex by phosphorylation of tuberin. J Biol Chem 277:35364–35370, 2002 [DOI] [PubMed] [Google Scholar]
- 27.Inoki K, Li Y, Zhu T, Wu J, Guan KL: TSC2 is phosphorylated and inhibited by Akt and suppresses mTOR signalling. Nat Cell Biol 4:648–657, 2002 [DOI] [PubMed] [Google Scholar]
- 28.Potter CJ, Pedraza LG, Xu T: Akt regulates growth by directly phosphorylating Tsc2. Nat Cell Biol 4:658–665, 2002 [DOI] [PubMed] [Google Scholar]
- 29.Gorin Y, Block K, Hernandez J, Bhandari B, Wagner B, Barnes JL, Abboud HE: Nox4 NAD(P)H oxidase mediates hypertrophy and fibronectin expression in the diabetic kidney. J Biol Chem 280:39616–39626, 2005 [DOI] [PubMed] [Google Scholar]
- 30.GorinY, Kim NH, Feliers D, Bhandari B, Choudhury GG, Abboud HE: Angiotensin II activates Akt/protein kinase B by an arachidonic acid/redox-dependent pathway and independent of phosphoinositide 3-kinase. FASEB J 15:1909–1920, 2001 [DOI] [PubMed] [Google Scholar]
- 31.Kim NH, Rincon-Choles H, Bhandari B, Choudhury GG, Abboud HE, Gorin Y: Redox dependence of glomerular epithelial cell hypertrophy in response to glucose. Am J Physiol Renal Physiol 291:F254, 2006 [DOI] [PubMed] [Google Scholar]
- 32.Ushio-Fukai M, Alexander RW, Akers M, Yin Q, FujioY, Walsh K, Griendling KK: Reactive oxygen species mediate the activation of Akt/protein kinase B by angiotensin II in vascular smooth muscle cells. J Biol Chem 274:22699–22704, 1999 [DOI] [PubMed] [Google Scholar]
- 33.Glynne PA: Primary culture of human proximal renal tubular epithelial cells. In Methods in Molecular Medicine: Septic Shock. Vol. 36. Evans TJ, Ed. Totowa, NJ, Humana Press, 1999, p. 197–205 [DOI] [PubMed]
- 34.Haverty TP, Kelly CJ, Hines WH, Amenta PS, Watanabe M, Harper RA, Kefalides NA, Neilson EG: Characterization of a renal tubular epithelial cell line which secretes the autologous target antigen of autoimmune experimental interstitial nephritis. J Cell Biol 107:1359–1368, 1988 [DOI] [PMC free article] [PubMed] [Google Scholar]
- 35.Bradford MM: A rapid and sensitive method for the quantitation of microgram quantities of protein utilizing the principle of protein-dye binding. Anal Biochem 72:248–254, 1976 [DOI] [PubMed] [Google Scholar]
- 36.Barnes J, Mitchell R, Kanalas J, Barnes VL: Differential expression of thrombospondin and cellular fibronectin during remodeling in proliferative glomerulonephritis. J Histochem Cytochem 47:533–544, 1999 [DOI] [PubMed] [Google Scholar]
- 37.Mariappan MM, Feliers D, Mummidi S, Choudhury GG, Kasinath BS: High glucose, high insulin, and their combination rapidly induce laminin-β1 synthesis by regulation of mRNA translation in renal epithelial cells. Diabetes 56:476–485, 2007 [DOI] [PubMed] [Google Scholar]
- 38.Konishi H, Matsuzaki H, Tanaka M, Takemura Y, Kuroda S, Ono Y, Kikkawa U: Activation of protein kinase B (Akt/RAC-protein kinase) by cellular stress and its association with heat shock protein Hsp27. FEBS Lett 410:493–498,1997 [DOI] [PubMed] [Google Scholar]
- 39.Venkatesan B, Mahimainathan L, Das F, Ghosh-Choudhury N, Choudhury GG: Downregulation of catalase by reactive oxygen species via PI 3 kinase/Akt signaling in mesangial cells. J Cell Physiol 211:457–467, 2007 [DOI] [PubMed] [Google Scholar]
- 40.Shaw M, Cohen P, Alessi DR: The activation of protein kinase B by H2O2 or heat shock is mediated by phosphoinositide 3-kinase and not by mitogen-activated protein kinase-activated protein kinase-2. Biochem J 336:241–246, 1998 [DOI] [PMC free article] [PubMed] [Google Scholar]
- 41.Inoguchi T, Li P, Umeda F, Yu HY, Kakimoto M, Imamura M, Aoki T, Etoh T, Hashimoto T, Naruse M, Sano H, Utsumi H, Nawata H: High glucose level and free fatty acid stimulate reactive oxygen species production through protein kinase C-dependent activation of NAD(P)H oxidase in cultured vascular cells. Diabetes 49:1939–1945, 2000 [DOI] [PubMed] [Google Scholar]
- 42.Fioretto P, Mauer M, Brocco E, Velussi M, Frigato F, Muollo B, Sambataro M, Abaterusso C, Baggio B, Crepaldi G, Nosadini R: Patterns of renal injury in NIDDM patients with microalbuminuria. Diabetologia 39:1569–1576, 1996 [DOI] [PubMed] [Google Scholar]
- 43.Sautin YY, Lu M, Gaugler A, Zhang L, Gluck SL: Phosphatidylinositol 3-kinase-mediated effects of glucose on vacuolar H+-ATPase assembly, translocation, and acidification of intracellular compartments in renal epithelial cells. Mol Cell Biol 25:575–589, 2005 [DOI] [PMC free article] [PubMed] [Google Scholar]
- 44.Sheu ML, Ho FM, Chao KF, Kuo ML, Liu SH: Activation of phosphoinositide 3-kinase in response to high glucose leads to regulation of reactive oxygen species-related nuclear factor-κB activation and cyclooxygenase-2 expression in mesangial cells. Mol Pharmacol 66:187–196, 2004 [DOI] [PubMed] [Google Scholar]
- 45.Dan HC, Sun M, Yang L, Feldman RI, Sui XM, Ou CC, Nellist M, Yeung RS, Halley DJ, Nicosia SV, Pledger WJ, Cheng JQ: Phosphatidylinositol 3-kinase/Akt pathway regulates tuberous sclerosis tumor suppressor complex by phosphorylation of tuberin. J Biol Chem 277:35364–35370, 2000 [DOI] [PubMed] [Google Scholar]
- 46.Aicher LD, Campbell JS, Yeung RS: Tuberin phosphorylation regulates its interaction with hamartin: two proteins involved in tuberous sclerosis. J Biol Chem 276:21017–21021, 2001 [DOI] [PubMed] [Google Scholar]
- 47.Thomas G, Bhat J, Wittman V, Thekkumkara TJ: Acute effect of high glucose on long-term cell growth: a role for transient glucose increase in proximal tubule cell injury. Am J Physiol Renal Physiol. 291:F162–F175, 2006 [DOI] [PubMed] [Google Scholar]
- 48.Tsuruya K, Furuichi M, Tominaga Y, Shinozaki M, Tokumoto M, Yoshimitsu T, Fukuda K, Kanai H, Hirakata H, Iida M, Nakabeppu Y: Accumulation of 8-oxoguanine in the cellular DNA and the alteration of the OGG1 expression during ischemia-reperfusion injury in the rat kidney, DNA Repair 2:211–229, 2003 [DOI] [PubMed] [Google Scholar]
- 49.Sakuraba H, Mizukami H, Yagihashi N, Wada R, Hanyu C, Yagihashi S: Reduced beta-cell mass and expression of oxidative stress-related DNA damage in the islet of Japanese type II diabetic patients. Diabetologia 45:85–96, 2002 [DOI] [PubMed] [Google Scholar]
- 50.Kakimoto M, Inoguchi T, Sonta HY, Yu M, Imamura T, Etoh T, Hashimoto T, Nawata H: Accumulation of 8-hydroxy-2′-deoxyguanosine and mitochondrial DNA deletion in kidney of diabetic rats. Diabetes 51:1588–1595, 2002 [DOI] [PubMed] [Google Scholar]
- 51.Samikkannu T, Thomas JJ, Bhat GJ, Wittman V, Thekkumkara TJ: Acute effect of high glucose on long-term cell growth: a role for transient glucose increase in proximal tubule cell injury. Am J Physiol Renal Physiol 291:F162–F175, 2006 [DOI] [PubMed] [Google Scholar]


