

Abstract
Stress is a common trigger in affective disorder onset, yet the mechanism and predisposing factors of vulnerability remain unknown. Effective disease prevention requires a critical balance of responses within the serotonergic raphe nucleus, including a coordination of corticotropin-releasing factor (CRF) actions at both of its receptors, CRF receptor-1 and CRF receptor-2. Mice deficient in CRF receptor-2 (R2KO) were used as a model of maladaptive stress responsivity to examine the physiological and molecular markers of stress dysregulation within the raphe in the absence of this receptor. After chronic stress, R2KO mice failed to display the robust stress-mediated adaptations characteristic of control mice, including elevations in tryptophan hydroxylase-2 and CRF receptor-1 expression and concordant increases in behavioral arousal. As a further indication of failed homeostatic mechanisms, R2KO mice displayed indices of cell death in the raphe after stress exposure, with elevations in proapoptotic factors but a failure to mount adaptive increases in antiapoptotic factors found in control mice. In vitro electrophysiological characterization of the specific influence of CRF on the raphe revealed both basal differences and a failure to respond to CRF administration in R2KO mice. These results support a requirement for homeostatic maintenance in response to stress in the raphe, where dysregulation may be a critical predictor of affective disorder onset.
Keywords: serotonin, CRF, depression, anxiety, homeostasis, cell death
Introduction
Affective disorders involve a failure in orchestration of multiple neurotransmitter systems and brain regions, and an increased sensitivity to the deleterious effects of stress (Keller, 2005; Berton and Nestler, 2006). The present deficiency in treating these disorders underscores the need to elucidate those experiences that precipitate disease onset, including that of prolonged stress exposure (Arborelius et al., 1999; Holsboer, 2000). Whereas stress normally elicits a recruitment of adaptive and compensatory mechanisms required in homeostasis, an inability to mount such responses results in an increased burden on cellular systems that sensitizes an individual toward affective disorders, exposing the brain to potentially toxic effects of physiological dysregulation (McEwen, 2003).
Serotonin (5-HT) plays a critical role in the regulation of mood and in the etiology and treatment of affective disorders for which the mechanism is still not fully understood. In the raphe, stress increases gene expression related to 5-HT production (Chamas et al., 2004), suggesting downstream 5-HT elevations in raphe target regions important in coordinating adaptive responses. Alterations in excitatory and inhibitory drives on raphe neurons, as well as 5-HT increases in the raphe and to its output regions, can be modulated by corticotropin-releasing factor (CRF) acting on its two receptors, CRF receptor-1 (CRFR1) and CRF receptor-2 (CRFR2) (Kirby et al., 2000, 2003; Daugherty et al., 2001; Valentino et al., 2001; Roche et al., 2003; Tan et al., 2004; Keeney et al., 2006). The coordination of these receptors is critical in the regulation of homeostatic maintenance (Weisstaub et al., 2006; Kang et al., 2007). These regulatory events indicate stress mediation of limbic and forebrain circuits critical in affect and arousal and of the cytoarchitectural stability of the raphe itself.
To determine the consequences of inappropriate stress responsivity, and to differentiate between homeostatic maintenance and dysregulation within the raphe and the role of CRF pathways in these responses, we used a mouse deficient for CRFR2 (R2KO). R2KO mice display maladaptive physiological and behavioral responses to stress perturbations (Bale et al., 2000; Bale and Vale, 2003). We hypothesized that a failure to produce these adaptive responses to stress may result in part from basal differences in cellular characteristics and CRF responses, which would be predisposing toward dysregulation in the raphe and affective disorder onset. To examine this hypothesis, we exposed wild-type (WT) and R2KO mice to chronic variable stress for a period of 4 weeks and examined molecular and cellular outcomes in the midbrain raphe nuclei compared with nonstressed control littermates. Ultimately, because many of the interactions critical to stress response and affect begin at the cellular level in raphe neurons receiving CRF input during stress exposure, application of CRF directly onto isolated 5-HT cells in the raphe nuclei during whole-cell electrophysiological investigation was also used to determine how a deficiency of CRFR2 may precipitate a dysregulated state.
Materials and Methods
Animals
CRFR2-deficient (R2KO) mice were generated on a mixed C57BL/6:129J background as described previously (Bale et al., 2000). Male WT and R2KO littermates (n = 40–42) were housed under a 12 h light/dark cycle (lights on 7:00 A.M.), with food and water available ad libitum. All studies were done according to experimental protocols approved by the University of Pennsylvania Institutional Animal Care and Use Committee, and all procedures were conducted in accordance with institutional guidelines.
Stress exposure
To determine the maladaptive responses of stress-sensitive R2KO mice, a model of chronic variable stress was used. Stressors were used that would not directly perturb thermogenic, metabolic, or pain pathways. WT and R2KO adult male littermates (n = 5–7) were individually housed for 1 week before stress onset. Mice were then presented with one stressor per day at random times and in a randomized order for 4 weeks. Stressors included the following: overnight wet cage bedding (60 ml of H2O); housing in the dirty cage of a nonlittermate male (overnight); 36 h of constant light; overnight exposure to novel objects in cages (glass marbles); 60 min predator odor exposure [Fox odor (Acros Organics) diluted 1:10,000], 15 min of restraint stress, and overnight novel noise using a white noise generator (Brookstone). Mice were killed 48 h after the final stressor. For all experimental assays, stressed WT and R2KO mice were compared with control groups composed of unstressed, singly housed littermates who were exposed only to normal cage changing and to the weekly hypothalamic-pituitary-adrenal (HPA) axis assessment over the 4 week test period.
HPA axis assessment
To ensure that mice continued to respond to daily stressors over 4 weeks, corticosterone levels in WT and R2KO mice (n = 6–7) were examined after 15 min of restraint stress administered each week of the chronic-stress-exposure paradigm. Tail blood was collected at restraint onset (basal value) and at stress completion (stress). Plasma samples were centrifuged and stored at −80°C until analysis. Corticosterone content was determined by radioimmunoassay (MP Biomedicals) using 3 μl of plasma and was examined using a logarithmic scale.
After the animals were killed, adrenal glands were collected, formalin fixed, and embedded in paraffin (Bale et al., 2000). Sectioned tissue was stained with hematoxylin and eosin. Images of stained tissue were collected using a Nikon DMZ800 microscope and a 10 bit QICam digital camera (QImaging). Adrenal cortex comparisons were measured from anatomically matched slides using a 0.01 μm micrometer and IP Labs software (BD Biosciences/Scanalytics).
Gene expression
To determine changes in gene expression related to CRF and 5-HT, in situ hybridization analysis in the raphe was used to examine tryptophan hydroxylase-2 (TPH2) and CRFR1. After stress, whole brains were removed from WT and R2KO mice (n = 5–6), frozen, and coronally sectioned in three consecutive sets (20 μm) using a Leica CM3050S cryostat. Sections were postfixed in 4% paraformaldehyde and processed as described previously (Teegarden and Bale, 2007). Briefly, atlas-matched tissue was hybridized with an antisense TPH2 (generous gift from Dr. Michael Bader, Max Delbrück Center for Molecular Medicine, Berlin, Germany) or a CRFR1 (described previously by Bale et al., 2000) probe. Slides were dipped in NTB liquid nuclear emulsion (Eastman Kodak) for 15–21 d, developed, counterstained with hematoxylin (Fisher Scientific), and coverslipped.
The dorsal raphe (DR) and median raphe (MR) were divided into anatomical subregions for analysis of mRNA-representative silver grains based on rostral, middle, and caudal position (bregma −4.16, −4.45, and −4.72 mm, respectively). The DR was divided into dorsomedial (dmDR) and ventromedial (vmDR) subregions as well as the DR lateral wings in caudal DR sections. Atlas-matched images were photographed at 20× magnification using a Nikon Eclipse E600 microscope and a 10 bit QICam digital camera (QImaging). Bright-field and dark-field images were captured to view nuclei and mRNA-representative silver grains, respectively. Analysis was accomplished using IP Labs software (BD Biosciences/Scanalytics). Cells were defined in contrast imaging of hematoxylin-stained nuclei. TPH2 mRNA- or CRFR1 mRNA-expressing cells (referred to as TPH2 positive or CRFR1 positive) and nonexpressing cells (referred to as TPH2 negative or CRFR1 negative) were distinguished and counted by the presence of nuclear silver grains within the cell perimeter. Total grain number was calculated as the number of grains located within cell nuclei. For the average grains per cell, the total grain number was divided by the number of cells containing grains.
Serotonin transporter autoradiography
To examine the effects of stress dysregulation in raphe output regions, serotonin transporter (SERT) levels were analyzed in WT and R2KO mice using 3H-citalopram autoradiography. Fresh-frozen, atlas-matched brain sections were selected from the control and chronically stressed WT and R2KO mice used in gene expression analyses (n = 5–6) and immersed in incubation buffer containing the following (in mm): 50 Tris, pH 7.6, 120 NaCl, 5 KCl. Sections containing dorsal and ventral hippocampus and basolateral amygdala were then incubated at room temperature in buffer containing 3H-citalopram (0.7 nm) (PerkinElmer) for 1 h. Slides were washed in incubation buffer twice for 10 min each, and dipped in mH2O. Slides were dried and apposed to Kodak Hyperfilm (Eastman Kodak) for 21 d. Atlas-matched images were normalized to background and analyzed by region-of-interest measurement in the basolateral amygdala and dorsal and ventral dentate gyrus and CA3 hippocampus. Optical density measurements were made by IP Labs software (BD Biosciences/Scanalytics).
Behavioral responses after chronic stress
To determine whether observed differences in electrophysiology and stress-induced changes in gene expression were associated with maladaptive behavioral responses to stress, WT and R2KO behaviors were examined after the 4 week stress period. The effects of the 4 week chronic stress on WT and R2KO behaviors were examined in a separate set of mice (n = 6–7). After 4 weeks of stress exposure, behavioral tests were introduced as novel daily stressors. Unstressed WT and R2KO littermates were used as controls.
Elevated plus maze.
Testing was executed as described previously (Teegarden and Bale, 2007). The 5 min test occurred during the light cycle between 11:00 A.M. and 2:00 P.M. Measurements were taken to ensure that light intensity on the open arms was 6 lux and uniform throughout open arm regions. Analysis was performed using AnyMaze software (Stoelting) to measure time, entries into open and closed arms, and total distance traveled.
Light/dark box.
Testing was performed as described previously (Bale et al., 2000). Light intensity was 5 lux in the dark compartment and 300 lux in the light compartment. Test duration was 10 min and occurred 2 h into the dark cycle. AnyMaze software was used to measure distance traveled, time spent in light and dark sides, and light/dark transitions.
Examination of regional cell loss
To assess whether chronic stress led to changes in cytoarchitecture, total cell number was calculated in each raphe subregion by counting hematoxylin-stained nuclei. Using raphe sections from TPH2 and CRFR1 in situ assays, total cell number was calculated in representative slices of each raphe subregion using IP Labs software (BD Biosciences/Scanalytics). Data are presented as the average of samples within treatment groups.
RT2 profiler apoptosis PCR array
To determine how genetic regulation of factors related to cell death might account for observed cell loss in the raphe, dissected dorsal raphe tissue was used in a PCR microarray focusing on gene families relevant to the induction and inhibition of apoptosis. Tissue punches of DR were taken from brains of chronically stressed WT and R2KO mice, as well as age-matched WT and R2KO littermate controls, from groups used in behavioral experiments (n = 4–6). Punches (300 μm) were collected using a 0.75 mm circular punch (Ted Pella). After homogenization by TRIzol (Invitrogen) and sonication, total RNA was isolated with chloroform and precipitated with isopropanol. cDNA was transcribed using an RT2 ReactionReady First Strand Synthesis Kit (SuperArray Bioscience) and was analyzed using the mouse apoptosis PCR array and the RT2 SYBR Green/Rox PCR master mix [APMM 012C and PA-012-24, respectively (SuperArray Bioscience)]. Data were normalized using multiple housekeeping genes and analyzed by comparing 2−ΔCt of the normalized sample.
Electrophysiological characteristics of 5-HT and non-5-HT cells
To investigate physiological differences in raphe cells of R2KO mice, electrophysiological recordings were performed using both current-clamp and voltage-clamp techniques. Whole-cell recording techniques were used in the vmDR, a subregion selected for its robust 5-HT content, as described previously (Beck et al., 2004; Lemos et al., 2006). Male WT and R2KO mice (n = 19 and 15, respectively; 10–14 weeks) were taken from colony housing between 7:00 and 7:15 A.M. and habituated to the testing room for 90–120 min before dissection of raphe slices as described previously (Beck et al., 2004). Brains were sectioned with a Leica VT 1000S Vibratome (Leica) filled with oxygenated artificial CSF (aCSF) with sucrose replacing NaCl (124 mm). Slices (200 μm thick) were incubated at 37°C in oxygenated aCSF for 60 min, and then stored at room temperature until being transferred to a recording chamber superfused with aCSF at a rate of 1.5 ml/min. aCSF was composed of the following (in mm): 124 NaCl, 2.5 KCl, 1.25 NaH2PO4, 2.0 MgSO4, 2.5 CaCl2, 10 dextrose, and 26 NaHCO3. For recordings, electrode resistance was 3–6 MΩ when filled with an intracellular solution composed of the following (in mm): 70 K-gluconate, 70 KCl, 2 NaCl, 10 Na-phosphocreatine, 4 EGTA, 10 HEPES, 2 MgATP, and 0.3 Na2GTP, with 0.1% biocytin, pH 7.3.
Cellular characteristics were recorded using current-clamp techniques and pClamp software (Molecular Devices). Membrane potential, resistance, time constant, action potential (threshold, amplitude, duration), and afterhyperpolarization characteristics were measured for each cell. Cells were discarded if the series resistance of the electrode became ≥20 MΩ or if membrane potential fell below −45 mV. As an in vitro model of how stress-induced CRF release may modulate raphe cell physiology in a genotype-specific manner, the effects of CRF on miniature IPSC (mIPSC) activity were analyzed. Cells were voltage clamped at −70 mV, and DNQX (20 μm) and TTX (1 μm) were added to isolate mIPSCs (Lemos et al., 2006). CRF (10 nm) was added to superfusate, and activity (frequency, amplitude) was recorded and analyzed using Mini Analysis software (Synaptosoft).
After recordings, slices were fixed in 4% paraformaldehyde for immunohistochemical staining to identify TPH content. Techniques used fluorophores and mouse monoclonal anti-TPH, as described previously (Beck et al., 2004; Lemos et al., 2006). Sections were incubated with mouse anti-TPH (1:500; Sigma) and visualized with Alexa Fluor 488-conjugated donkey anti-mouse secondary (1:200; Invitrogen). Biocytin was visualized using streptavidin-conjugated Alexa Fluor 633 (1:100; Invitrogen) and visualized using DMR fluorescence (OpenLab software, Improvision) and confocal DMIRE2 (Leica software) microscopy. Patched cells were identified as either 5-HT positive or 5-HT negative by overlapping TPH immunoreactivity with biocytin label.
Statistical analyses
All analyses were conducted by an investigator blinded to genotype and treatment. Electrophysiological characteristics were compared using two-way ANOVA by genotype and 5-HT content, and voltage-clamp data were assessed using repeated-measures ANOVA analysis. Corticosterone measurements were analyzed using two-way repeated-measures ANOVA examining genotype and stress by time point (0 or 15 min). For in situ hybridization, ANOVA was used with factors for rostral-caudal axis, genotype, and stress exposure, and was followed by paired two-tailed Student's t test. Statistical analysis of behavioral data included two-way ANOVA for stress and genotype. PCR microarray data were assessed by logistic regression in which upregulation and downregulation were coded as nominal variables, and effects of genotype were tested by a χ2 test. Analysis was performed with JMP statistical software (SAS Institute).
Results
HPA axis assessment
To ensure a continued HPA axis response to daily stressors during the chronic stress period, corticosterone levels were examined after the 15 min restraint stress each week of the study. Corticosterone levels at the onset of restraint (0 min) showed a significant interaction of stress exposure and genotype (F(1,19) = 7.5; p < 0.01), where chronic stress exposure was associated with increased basal corticosterone in WT mice, but not in R2KO mice. Weekly acute restraint continued to induce a significant elevation in corticosterone throughout the chronic stress protocol for both genotypes (F(1,19) = 68.9–323.3; p < 0.0001) (Table 1). Interestingly, analysis of peak corticosterone levels displayed a similar effect, where R2KO mice not exposed to chronic stress displayed elevated corticosterone, and stress did not increase this level further, as was observed in WT mice exposed to chronic stress (interaction of stress by genotype, F(1,19) = 4.2, p < 0.05).
Table 1.
Serum corticosterone measurements in WT and stress-sensitive (KO) mice showing continued stress response throughout the chronic stress paradigm (n = 6–7)
| Corticosterone (ng/ml) |
||||
|---|---|---|---|---|
| Week 1 | Week 2 | Week 3 | Week 4 | |
| Basal (0 min) | ||||
| WT CTRL | 26.8 ± 3.5 | 16.0 ± 2.0 | 22.1 ± 8.5 | 28.1 ± 4.2 |
| KO CTRL | 28.4 ± 6.3 | 32.7 ± 7.5 | 44.1 ± 25.3 | 22.7 ± 3.9 |
| WT STRESS | 42.7 ± 13.5 | 25.4 ± 2.9 | 36.7 ± 12.5 | 37.1 ± 14.3 |
| KO STRESS | 26.2 ± 7.2 | 39.6 ± 15.9 | 24.6 ± 1.8 | 28.2 ± 10.0 |
| Stressed (15 min) | ||||
| WT CTRL | 128.9 ± 18.6 | 118.7 ± 10.7 | 155.4 ± 8.5 | 155.7 ± 16.4 |
| KO CTRL | 198.8 ± 26.0 | 225 ± 52.2 | 205.8 ± 25.3 | 156.5 ±17.2 |
| WT CVS | 172.5 ± 24.1 | 173.6 ± 29.4 | 176.6 ± 12.1 | 177.7 ± 13.0 |
| KO CVS | 163.2 ± 43.3 | 161.1 ± 22.2 | 156.3 ± 16.5 | 151 ± 12.3 |
Stressed mice (chronic variable stress) of each genotype were compared with unstressed littermates (CTRL). Samples were taken before onset (Basal) and at completion (Stressed) of a 15 min restraint stress. Values are expressed as mean ± SEM.
To examine further the potential peripheral effects of chronic mild stress exposure, adrenal cortex diameter was examined at the end of stress exposure. No significant differences in adrenal cortex size were observed between genotypes (F(1,23) = 0.1; p = 0.76) or treatment groups (F(1,23) = 0.8; p = 0.37). Mean values for groups were as follows: WT control, 2.85 ± 0.14 mm; WT stress, 2.72 ± 0.01 mm; R2KO control, 2.81 ± 0.10 mm; and R2KO stress, 2.80 ± 0.029 mm.
Gene expression
To determine changes in gene expression related to CRF and 5-HT, in situ analysis in the raphe was used to detect changes in TPH2 and CRFR1.
TPH2
TPH2 expression was basally elevated in R2KO mice compared with WT mice in the middle dmDR (F(1,9) = 2.5; p < 0.05) (Fig. 1) and middle MR (F(1,9) = 2.5, p < 0.05) (supplemental Table 2, available at www.jneurosci.org as supplemental material). These basal elevations were accompanied by increased grains per cell in R2KO mice in both regions (dmDR, F(1,9) = 2.7, p < 0.05; MR, F(1,9) = 3.2, p < 0.05).
Figure 1.
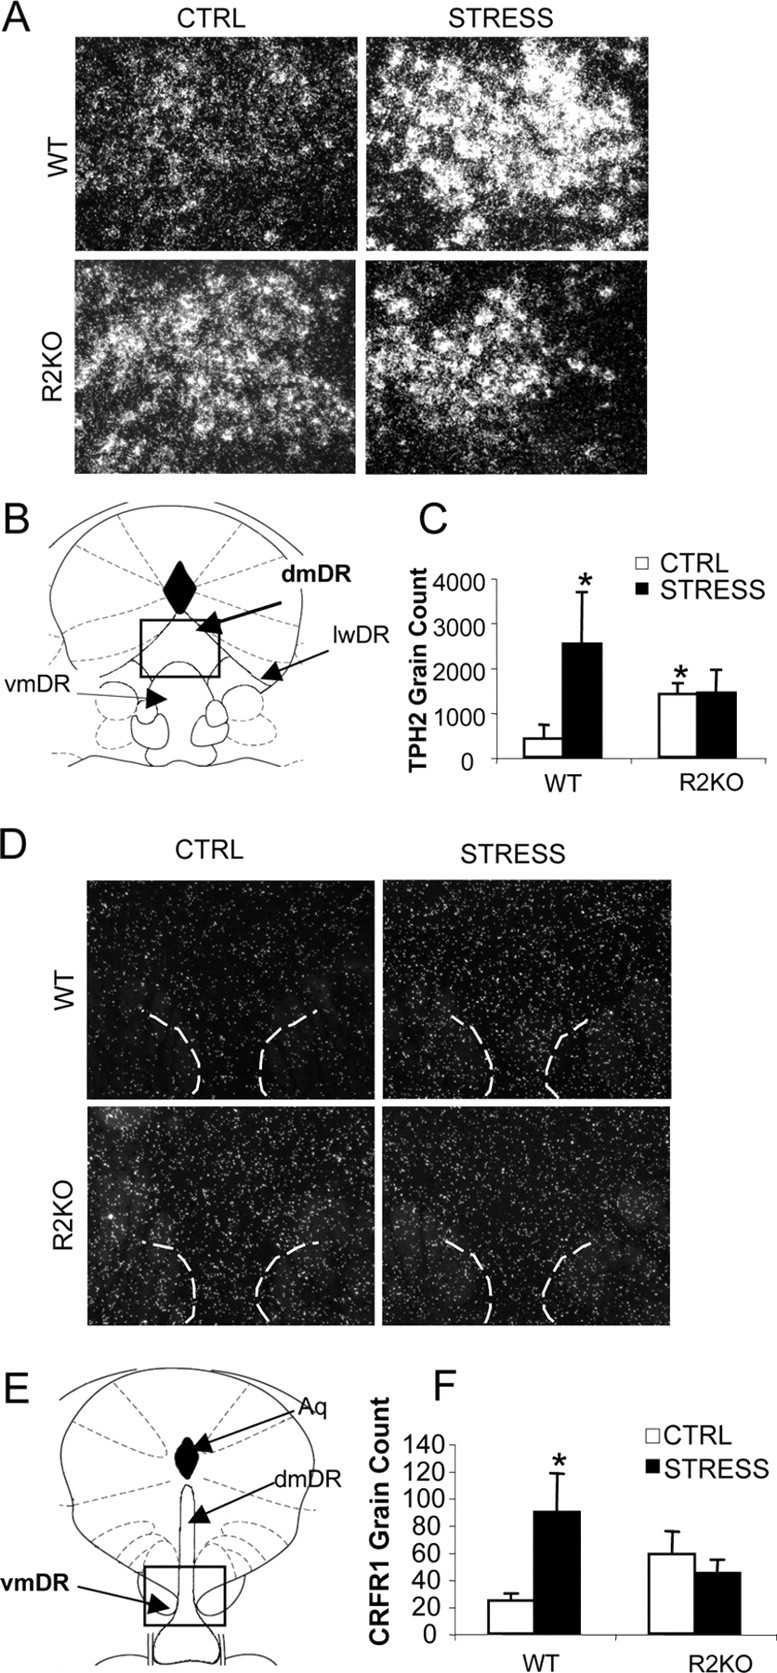
R2KO mice fail to produce stress-mediated increases in TPH2 and CRFR1 expression found in WT mice. A, D, Representative images of TPH2 expression in middle dmDR (A) and CRFR1 expression in rostral vmDR (D) of WT and R2KO mice comparing nonstressed control (CTRL) and chronically stressed (STRESS) mice. B, E, Atlas image indicating region of analysis for TPH2 (B) and CRFR1 (E), adapted from Paxinos and Franklin (2003). C, F, Quantification of TPH2 in middle-caudal dmDR (C) and CRFR1 in rostral vmDR (F) (n = 5–6). R2KO mice showed a basal elevation of TPH2 that was not altered by stress. There was a main effect of stress for increasing TPH2 and CRFR1 expression in WT mice. Data are presented as mean ± SEM. *p < 0.05, significantly different from WT CTRL group. Aq, Aqueduct.
Stress did not significantly alter TPH2 silver grain count or grains per cell in either genotype in the vmDR (F(2,61) = 0.15, p < 0.49). In the combined analysis of middle and caudal dmDR, TPH2 expression was increased with stress in WT mice (F(1,18) = 4.6; p < 0.05) (Fig. 1). Stress did not increase TPH2 in the R2KO mouse by this analysis (F(1,18) = 0.5; p = 0.62). Analysis of MR by subregion displayed similar results, with stress-exposed mice displaying elevated grain expression (F(1,60) = 5.3; p < 0.05) and grains per cell (F(1,60) = 10.3; p < 0.01) (supplemental Table 2, available at www.jneurosci.org as supplemental material). Both increases were greatest in rostral and middle MR, and chiefly in stressed WT mice. Additional detailed analysis of TPH2 expression and the number of cells expressing TPH2 by raphe subregion are found in supplemental Tables 1 and 2, available at www.jneurosci.org as supplemental material.
CRFR1
Analysis of unstressed WT and R2KO displayed no basal differences in grain count within the DR. In the MR, R2KO mice displayed lower CRFR1 expression (F(1,9) = 3.1; p < 0.05) and grains per cell (F(1,9) = 2.4; p < 0.05) within the caudal sections compared with WT mice (supplemental Table 4, available at www.jneurosci.org as supplemental material).
Comparison of stress effects on CRFR1 expression revealed increased CRFR1 grain count and CRFR1-positive cell number in the rostral vmDR and caudal dmDR of stressed WT mice (p < 0.05) (Fig. 1 and supplemental Table 3, available at www.jneurosci.org as supplemental material). R2KO mice displayed no change in CRFR1 grain count or CRFR1-positive cell number (Fig. 1). Additional detailed analysis of stress effects on CRFR1 expression patterns and the numbers of cells expressing CRFR1 in each subregion is found in supplemental Tables 3 and 4, available at www.jneurosci.org as supplemental material.
Serotonin transporter autoradiography
Assessment of SERT levels in WT and R2KO mice by 3H-citalopram autoradiography was conducted to determine effects of stress on 5-HT output brain regions. Genotypic differences in SERT were observed in multiple regions receiving raphe input. Although data from ventral hippocampus showed no effect of genotype or stress exposure (Fig. 2), a significant basal reduction in SERT density was observed in dorsal dentate gyrus (DG) and CA3 in R2KO mice compared with WT mice (F(1,21) = 6.9 and 9.2, respectively; p < 0.01) (Fig. 2). A main effect of stress was also observed wherein SERT levels in the dorsal hippocampus DG and CA3 increased for all groups (F(1,21) = 8.6 and 9.8, respectively; p < 0.01) (Fig. 2). SERT levels in the basolateral amygdala were reduced in R2KO mice (F(1,21) = 7.5; p < 0.05) (Fig. 2).
Figure 2.

R2KO mice show basal reductions and stress-induced changes in SERT levels in limbic brain regions compared with WT mice. Significant genotypic differences in SERT levels were detected in the dorsal hippocampus (dHpC) and the basolateral amygdala (BLA). A–D, No genotypic differences or stress treatment effects on SERT levels were observed in the ventral hippocampus (vHpc) DG (A) or CA3 (B). SERT levels in dHpC DG (C) and CA3 (D) increased across genotypes after chronic stress exposure. E, No stress effects on SERT levels were observed in the BLA (E). CTRL, Nonstressed control. Data are presented as mean ± SEM. *p < 0.05, significantly different from control.  p < 0.05, significantly different from WT.
Behavioral responses after chronic stress
To determine whether observed genotypic differences in stress-induced gene expression were associated with maladaptive behavioral responses to stress, WT and R2KO behaviors were examined after the 4 week stress period. In the elevated plus maze, WT mice displayed a trend toward increased total activity as measured by total arm entries (F(1,9) = 1.96; p = 0.08). Additionally, a significant increase in entries into and time spent in the open arms of the elevated plus maze was seen in WT mice after exposure to chronic stress (stress × genotype, F(3,20) = 2.6 and 2.1, respectively; p < 0.02). In the light/dark box, although data suggest that WT mice spend more time in the more aversive light side of the test apparatus (Fig. 3), these results did not reach significance.
Figure 3.

R2KO mice fail to show stress-induced behavioral responses of elevated arousal after 4 weeks of chronic stress. A, Behavioral analysis in the elevated plus maze revealed a significant stress × genotype interaction in open arm entries and time in open arms (p = 0.02), and in total arm entries (p < 0.01), indicative of increased arousal state and vigilance detected in WT mice. *p < 0.05, significantly different from genotype-matched unstressed group; **p < 0.01. B, Although similar trends for increased locomotion and arousal for WT mice were found in the light/dark box test after chronic stress, these comparisons did not reach significance. Data (mean ± SEM) are presented as percentage difference of stressed WT and R2KO mice from unstressed controls.
R2KO mice showed no change in activity in the elevated plus maze after stress exposure. A significant interaction of stress and genotype was observed in total arm entries, where decreased entries were observed in stressed R2KO mice but not in stressed WT mice (stress × genotype, F(3,20) = 3.1, p < 0.01). Further analysis of this interaction effect revealed a significant decrease in total entries in R2KO mice (p < 0.05) (Fig. 3). No effects of stress were observed in R2KO mice in the light/dark box.
Examination of regional cell loss
To assess whether chronic stress affected raphe cytoarchitecture, total cell numbers were calculated within raphe subregions. Stress-exposed R2KO mice displayed significant reductions in cell numbers relative to nonstressed R2KO mice in dmDR (F(1,34) = 6.8; p < 0.01), vmDR (F(1,34) = 8.4; p < 0.01), lateral wings (F(1,34) = 2.8; p < 0.05), and median raphe (F(1,34) = 7.1; p = 0.01) subregions (Fig. 4). Stress did not promote a significant decrease in total cell numbers in WT mice (dmDR, F(1,28) = 1.50, p = 0.15; vmDR, F(1,28) = 0.60, p = 0.44; lateral wings, F(1,28) = 1.23, p = 0.255; median raphe, F(1,28) = 1.87, p = 0.07). Reductions in vmDR cell number were greatest in the rostral and caudal regions (Fig. 4), where they were associated with decreased TPH-negative cells (p < 0.01) (supplemental Table 1, available at www.jneurosci.org as supplemental material) and increased TPH-positive cells (p = 0.02). Similar effects were observed in dmDR and median raphe, where cell loss was accompanied by fewer TPH-negative cells (F(1,61) = 18.0 and 10.2, respectively; p < 0.01), and greater TPH-positive cell number (F(1,61) = 9.0 and 4.7, respectively; p < 0.01).
Figure 4.
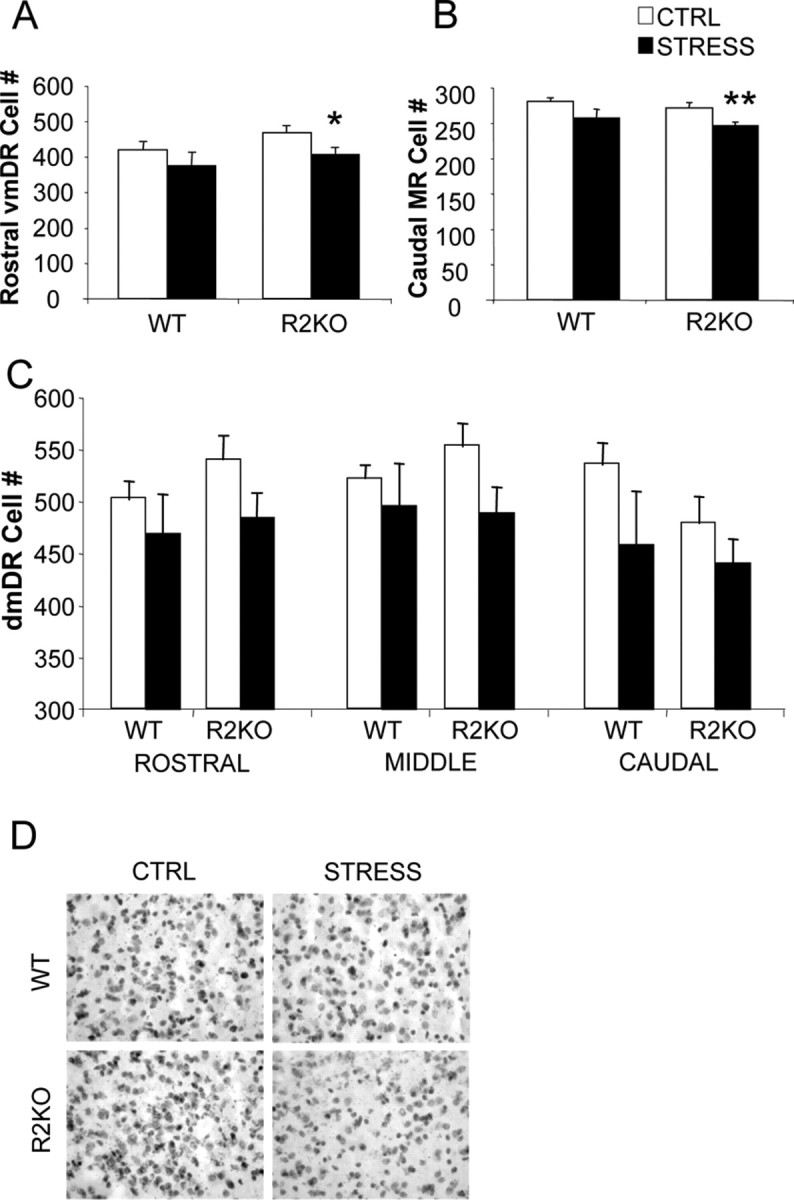
Chronic stress induces significant subregion-specific cell loss in R2KO mice throughout the raphe. A, B, Total cell number was calculated in WT and R2KO mice (n = 5–6) in the rostral vmDR (A) and the caudal subdivision of the MR (B). Chronic stress significantly reduced cell numbers in R2KO mice in the vmDR and MR. *p < 0.05, significantly different from R2KO control (CTRL). **p < 0.01, significantly different from R2KO CTRL. C, Analysis of cell numbers as measured across the entire dmDR, where there was a main effect of stress to promote cell loss (p < 0.01). D, Representative images of hematoxylin-stained brain sections from the middle dmDR showing a decrease in cell number in stressed R2KO mice. Data are presented as mean ± SEM.
RT2 profiler apoptosis PCR array
To assess how regulation of factors related to cell death might account for observed cell loss in the raphe, dorsal raphe punches were analyzed by a focused PCR array comparing stress-mediated changes in proapoptotic and antiapoptotic genes. After stress, a significant effect of genotype was observed by logistic regression analysis whereby WT mice showed an increase in markers of both apoptotic (χ2 = 13.7; p < 0.001) and antiapoptotic signaling (χ2 = 26.6; p < 0.0001) (Fig. 5). In contrast, stressed R2KO mice showed elevations in proapoptotic markers but failed to display increases in antiapoptotic gene expression (Fig. 5). A complete gene list and stress effects in WT and R2KO mice is shown in supplemental Tables 6 and 7, available at www.jneurosci.org as supplemental material.
Figure 5.

R2KO mice fail to increase antiapoptotic gene expression and display dysregulation of genes associated with cell death after chronic stress. A, B, Total RNA isolated from dorsal raphe punches from WT (A) and R2KO (B) mice exposed to chronic stress was analyzed using an RT2 profiler apoptosis PCR array. Analysis by logistic regression of proapoptotic and antiapoptotic genes revealed a genotype effect in which R2KO mice failed to show the responses of upregulated antiapoptotic factors seen in WT mice after stress (p < 0.0001). Genes related to apoptosis are highlighted in red. Genes associated with antiapoptotic signaling are highlighted in yellow. Data are presented as the fold difference from unstressed control, calculated from average ΔCT normalized to housekeeping genes [β-actin, GAPDH (glyceraldehyde-3-phosphate dehydrogenase), HPRT1, HSP90AB1].
Electrophysiological characteristics of 5-HT and non-5-HT cells
To investigate physiological differences in raphe cells of stress-sensitive R2KO mice, whole-cell electrophysiological recordings were used, with both current-clamp and voltage-clamp techniques. A total of 52 current-clamp recordings were analyzed (27 WT from 19 mice, 25 R2KO from 15 mice). Cellular characteristics that were measured included resting membrane potential, resistance, time constant, afterhyperpolarization, and action potential amplitude, width, and threshold (Fig. 6, Table 2). Whereas characterization of 5-HT-containing and non-5-HT cells (5-HT+ and 5-HT−, respectively) revealed several similar characteristics, resting membrane potential was significantly depolarized in R2KO cells relative to corresponding WT cells (F(1,46) = 3.9; p = 0.03) (Fig. 6). There was also an increase in action potential duration among 5-HT+ cells across genotypes (F(1,40) = 4.1; p = 0.04). This increase was most robust in 5-HT+ cells from R2KO mice (Table 2).
Figure 6.

Basal cellular physiology and CRF responses of the dorsal raphe are altered in R2KO mice. Whole-cell current-clamp recordings of 5-HT+ (black bars) and non-5-HT (5-HT−, white bars) cells were examined across the rostral-caudal axis of the vmDR in WT (n = 8 and 19 for 5-HT and non-5-HT, respectively) and R2KO (n = 11 and 14 for 5-HT and non-5-HT, respectively) mice. A, Representative traces from each cell type recorded in the vmDR. Voltage traces in response to current injection and action potentials are displayed. B, Resting membrane potential of cells recorded across the rostral-caudal axis of the vmDR. Both 5-HT and non-5-HT cells in R2KO mice displayed depolarized potentials compared with corresponding WT cells (p < 0.05). C, Sample voltage-clamp traces (−70 mV holding potential) representing basal IPSC activity (i), DNQX (20 μm)-treated and TTX (1 μm)-treated mIPSC activity (ii), and mIPSC recordings after CRF administration (iii). D, Effect of CRF administration on mIPSC event frequency. E, Change in mIPSC amplitude during CRF administration. p < 0.05, significantly different from WT non-5-HT group. *p = 0.01, significant difference between WT and R2KO 5-HT groups.
Table 2.
Active and passive cell characteristics in whole-cell recordings of cells in vmDR
| Cell type (n) | Vm rest (mV)* | R (mW) | Tau (ms) | AHP Amp (mV) | AP threshold (mV) | AP Amp (mV) | Peak AP height | AP duration (ms)** |
|---|---|---|---|---|---|---|---|---|
| WT 5-HT− (19) | −60.9 ± 1.6 | 464.0 ± 22.4 | 37.8 ± 4.3 | 24.0 ± 2.0 | −24.2 ± 3.3 | 48.5 ± 2.3 | 21.0 ± 2.2 | 1.5 ± 0.07 |
| WT 5-HT+ (8) | −61.3 ± 2.8 | 447.1 ± 53.9 | 39.1 ± 4.3 | 26.2 ± 0.7 | −28.0 ± 2.6 | 50.0 ± 4.4 | 22.0 ± 3.3 | 1.8 ± 0.07 |
| KO 5-HT− (14) | −54.9 ± 1.5 | 475.0 ± 25.7 | 42.7 ± 2.5 | 26.1 ± 1.0 | −28.4 ± 1.0 | 52.4 ± 2.7 | 24.0 ± 1.8 | 1.6 ± 0.07 |
| KO 5-HT+ (11) | −57.9 ± 2.3 | 415.5 ± 36.6 | 42.7 ± 6.3 | 24.9 ± 0.8 | −28.0 ± 1.2 | 50.0 ± 3.3 | 20.1 ± 3.0 | 2.1 ± 0.36 |
Recordings were taken from 5-HT+ and non-5-HT (5-HT−) cells in WT and stress-sensitive (KO) mice. Vm, Resting membrane potential; R, resistance; AHP, afterhyperpolarization; Amp, amplitude; AP, action potential. Values are expressed as mean ± SEM.
*p ≤ 0.05, significant difference across genotypes.
**p ≤ 0.05, significant difference across 5-HT+ and 5-HT− cells.
Voltage-clamp recordings of GABAergic IPSCs revealed several functional differences across cell types. The frequency of spontaneous IPSCs was reduced in 5-HT+ cells from R2KO mice (n = 7) compared with 5-HT+ cells from WT mice (n = 7) (F(1,8) = 2.5; p = 0.03) (Fig. 6). On addition of CRF (10 nm), the mIPSC frequency was increased in WT 5-HT+ cells but not in 5-HT+ cells from R2KO mice (F(1,8) = 3.4; p = 0.01) (Fig. 6). Significant differences were not observed in amplitude between groups, although repeated-measures ANOVA detected an R2KO-specific decrease in mIPSC amplitude in the presence of CRF in 5-HT+ cells (F(3,15) = 3.4; p = 0.04) (Fig. 6). No differences were observed in frequency and amplitude measurements between WT and R2KO non-5-HT cells (n = 15 and 10, respectively). Addition of bicuculline (20 μm) eliminated mIPSC activity (data not shown).
Discussion
Maintenance of organismal homeostasis in response to stress insults is of primary importance in the prevention of affective disorders. Therefore, it is the manifestation of inappropriate stress responses that becomes a disease risk factor. To examine the consequences of stress dysregulation within the serotonergic raphe in the absence of CRFR2, we compared molecular and cellular outcomes in WT and R2KO mice after 4 weeks of chronic variable stress. HPA axis assessment throughout the chronic stress period revealed a continuous response to the 15 min restraint from both genotypes, confirming that mice did not habituate to the stressors during the 4 week exposure. In assessing these HPA effects during the chronic stress period, it was interesting to note that whereas R2KO control mice displayed a predicted heightened response to restraint compared with WT controls, chronic stress exposure elevated the restraint response of WT mice, eliminating this genotypic difference. These changes in corticosterone levels in response to restraint corresponded to genotypic differences we detected for TPH2 expression, in which WT mice significantly elevated TPH2 expression during chronic stress, and R2KO mice showed higher basal levels but failed to respond to chronic stress. Because 5-HT is involved in stress-induced activation of the HPA axis, these results suggest that an absence of CRFR2 dysregulates the 5-HT system such that these mice are unable to mount further responses found in WT mice (Nakamura and Kurasawa, 2000; Millan et al., 2003; Lowry and Moore, 2006). No significant differences between genotypes or treatment groups were observed in histological analysis of the adrenal gland cortex, suggesting that the variable stress exposure was mild enough in nature to not produce a peripheral impact in either genotype.
We examined CRF-related and 5-HT-related gene expression in which analyses by raphe subregion revealed dynamic heterogeneity in basal and stress-activated expression of TPH2. We found basally increased TPH2 expression in R2KO mice, indicative of the increased sensitivity to stress in these mice. Chronic stress increased the number of TPH2-expressing cells in WT mice. However, R2KO mice failed to exhibit these adaptations during the stress experience. The largest increase in TPH2 expression in the WT raphe was detected in the middle and caudal dmDR, areas along the rostral-caudal axis of this subregion that receive the greatest CRF input (Valentino et al., 2001; Roche et al., 2003).
The observed increases in TPH2 may serve to meet a higher 5-HT demand in raphe target regions necessary during stress for adaptive responses and restoration of systems to homeostatic baseline (Tan et al., 2004). The absence of such changes in TPH2 in R2KO mice further indicates a dysregulation that may incapacitate necessary behavioral coping responses. These results are of particular interest in light of recent work indicating topographically specific changes in total tryptophan hydroxylase content within the DR of suicide patients (Boldrini et al., 2008).
The relevance of CRFR1 to stress and depression has been demonstrated previously (Contarino et al., 1999; Varga et al., 2001; Bale et al., 2002; Ducottet et al., 2003; Alonso et al., 2004; Bale and Vale, 2004; Kasahara et al., 2007). We examined CRFR1 expression levels after chronic stress as an important mediator of CRF-induced effects in the raphe. Again, R2KO mice showed evidence of basal differences within the raphe and failed to respond to the stress exposure. Increased CRFR1 expression by stress in WT mice was specific to rostral vmDR and caudal dmDR, areas receiving robust CRF innervation (Price et al., 1998; Lowry et al., 2000; Valentino et al., 2001; Lowry, 2002). These data present an important correlation within the raphe reflecting concordant changes related to CRF and 5-HT, as raphe regions displaying increased CRFR1 overlapped with the same areas showing stress-induced increase in TPH2 expression. However, because the detected CRFR1 mRNA levels are relatively low, it is not currently known whether all CRFR1 in the raphe is localized presynaptically or postsynaptically.
To examine possible effects of chronic stress on 5-HT output regions important in mediation of coping and affect (Vertes and Kocsis, 1994; Vertes et al., 1999), SERT density was examined. Interestingly, R2KO mice displayed a basal reduction in SERT levels in the basolateral amygdala and dorsal hippocampus, and an increase in response to stress in the dorsal hippocampus. Because the dorsal hippocampus receives major inputs from the rostral MR (Vertes et al., 1999), a region where we detected increased TPH2 expression with stress only in WT mice, these findings support a possible additional depletion of 5-HT in R2KO mice during stress resulting from both a failure to increase the rate-limiting enzyme TPH2 and a counterproductive increase in 5-HT reuptake via SERT.
As a functional output measure of behavioral responses in a novel stress-provoking environment, we compared WT and R2KO mice to nonstressed controls at the end of the chronic stress period. As predicted, chronic stress induced robust increases in arousal and exploratory behaviors in WT mice, distinguishing effects between acute and chronic stress impact on behavioral responses (Strekalova et al., 2005). Significant alterations in overall activity were found in WT mice with increased time and entries into the open arms and total arm entries in the plus maze, and a similar trend for increasing transitions in the light/dark box. We hypothesize that these responses represent adaptive changes in arousal state and exploratory behavior, as has been reported with other stress paradigms (Lowry and Moore, 2006; Teegarden and Bale, 2007). The observed increase in arousal correlates with TPH2 expression increases detected in WT mice after chronic stress. These changes in gene expression and behavior likely reflect an adaptive response to stress whereby 5-HT circuits are recruited to provide necessary coping stimuli (Nakamura and Kurasawa, 2000; Millan et al., 2003; Lowry and Moore, 2006; Clark et al., 2007; Bondi et al., 2008). Again, R2KO mice failed to produce a change in behavioral responses in these tests after stress exposure, which may be a result of the lack of TPH2 response after chronic stress.
Raphe neurotransmission is dependent on an intricate and highly differentiated set of cell populations acting both within the raphe and in target output brain regions. Therefore, we examined total cell numbers throughout the DR and MR to determine the effect of chronic stress exposure in the raphe. Stress exposure produced a significant cell loss in R2KO mice in the vmDR and dmDR. Cell loss in the vmDR was largest in rostral sections where CRF input is greater (Valentino et al., 2001). The absence of significant cell loss in WT mice may suggest that CRFR2, hypothesized to function in restoring systems to homeostatic baseline (Bale et al., 2002), plays a critical role in maintaining healthy raphe physiology.
Ultimately, the determination of cell death or survival is dependent on a balance between proapoptotic and antiapoptotic signals. To elucidate the possible mechanism of cell loss after chronic stress in the absence of CRFR2, DR punches were analyzed by an apoptosis-focused PCR array in WT and R2KO mice after chronic stress. Results from this array revealed dramatic genotypic differences in directional regulation of apoptotic and antiapoptotic genes. After chronic stress exposure, WT mice displayed an upregulation of antiapoptotic genes. R2KO mice, however, failed to produce this adaptive change in antiapoptotic factors but still displayed increased expression of proapoptotic genes, a pattern that may place the raphe at a particular susceptibility to cell death during chronic stress and may ultimately increase the risk for affective disorder onset in stress-sensitive populations.
In the absence of CRFR2, mice displayed a complex phenotypic dysregulation of behavioral and gene expression measures in response to a chronic stress period. To determine whether these maladaptive responses may be associated with underlying genotypic differences in raphe cell physiology, we examined in vitro electrophysiological recordings in 5-HT and non-5-HT-containing cells in the vmDR, a region selected because of its robust CRF innervation (Valentino et al., 2001). In basal recordings, both 5-HT-containing and non-5-HT cells from R2KO mice showed greater depolarization at rest compared with WT mice. Previous studies have examined the influence of CRF in stress-mediated 5-HT neurotransmission (Kirby et al., 2000; Thomas et al., 2003; Tan et al., 2004; Zhong and Yan, 2004; El Mansari et al., 2005). An absence of CRFR2 in the raphe, or in other key brain regions modulating effects in the raphe, likely contributed to the depolarized resting membrane potential observed in R2KO raphe cells. As such, this depolarization may become increasingly influential during stress exposure, priming raphe cells to be more sensitive to excitatory impulses (Lowry and Moore, 2006).
To examine the change in physiological responses of these neurons to stress in the absence of CRFR2, we used CRF application as a potential mechanism whereby stress could produce raphe dysregulation, potentially leading to cell death. In addition to basal differences between genotypes, alterations in GABA-mediated signaling were observed in cell recordings after direct CRF administration. A moderate dose of CRF caused a significant increase in firing frequency in WT mice, suggestive of increased presynaptic GABAergic activity specifically affecting 5-HT cells, in agreement with previous findings of CRF actions in the raphe (Kirby et al., 2000; Valentino and Commons, 2005). This effect was absent in recordings from R2KO mice. In addition, there was a significant decrease in mIPSC amplitude in 5-HT cells from R2KO mice. These findings suggest that CRFR2 is directly or indirectly involved in the appropriate physiological responses to CRF in the raphe, and may play an important role in altering 5-HT cell function. An involvement of CRFR1 in these genotypic differences cannot be ruled out.
Maladaptive responses to even mild stressors, including a failure to adapt appropriately, may be predictive of an elevated vulnerability to affective disorders. Under chronic stress conditions in an adaptive organism, a shift in CRF tone is a likely contributor to the observed elevations in CRFR1, TPH2, and antiapoptotic factors found in the raphe, resulting in the induction of compensatory behavioral and physiological strategies and, ultimately, cell survival (Fig. 7). Whereas these adaptive changes were multifaceted and robust in WT mice, analyses of R2KO mice revealed a consistent and categorical failure to mount the same homeostatic responses in the absence of CRFR2. The inability to produce these changes may result in maladaptive strategies and ultimately to the cell death in a brain region critical for regulation of affect.
Figure 7.

Summary of chronic stress effects on homeostatic increases in TPH2 and CRFR1 expression in WT and R2KO mice. Dorsal and median raphe are displayed along their rostral-caudal axis, with symbols illustrating increased (↑) or decreased (↓) TPH2 and CRFR1 expression after chronic stress. A significant cell loss was observed in R2KO mice after stress in subfields that correspond with those that in WT mice showed stress-mediated increases in TPH2 and CRFR1 (i.e., middle to caudal dmDR and rostral vmDR). Trends for cell loss in these areas in WT mice did not reach significance. These results suggest that the inability to respond appropriately to stress may contribute to cytoarchitectural changes in key raphe subregions. lwDR, DR lateral wings.
Footnotes
This work was supported by National Institute of Mental Health Grants MH79754 (J.G.M.), MH 73030 (T.L.B.), and MH7540407 and MH48125 (S.G.B.). We thank K. M. Carlin and A. Akanwa for technical support.
References
- Alonso R, Griebel G, Pavone G, Stemmelin J, Le Fur G, Soubrié P. Blockade of CRF1 or V1b receptors reverses stress-induced suppression of neurogenesis in a mouse model of depression. Mol Psychiatry. 2004;9:278–286. doi: 10.1038/sj.mp.4001464. [DOI] [PubMed] [Google Scholar]
- Arborelius L, Owens MJ, Plotsky PM, Nemeroff CB. The role of corticotropin-releasing factor in depression and anxiety disorders. J Endocrinol. 1999;160:1–12. doi: 10.1677/joe.0.1600001. [DOI] [PubMed] [Google Scholar]
- Bale TL, Vale WW. Increased depression-like behaviors in corticotropin-releasing factor receptor-2-deficient mice: sexually dichotomous responses. J Neurosci. 2003;23:5295–5301. doi: 10.1523/JNEUROSCI.23-12-05295.2003. [DOI] [PMC free article] [PubMed] [Google Scholar]
- Bale TL, Vale WW. CRF and CRF receptors: role in stress responsivity and other behaviors. Annu Rev Pharmacol Toxicol. 2004;44:525–557. doi: 10.1146/annurev.pharmtox.44.101802.121410. [DOI] [PubMed] [Google Scholar]
- Bale TL, Contarino A, Smith GW, Chan R, Gold LH, Sawchenko PE, Koob GF, Vale WW, Lee KF. Mice deficient for corticotropin-releasing hormone receptor-2 display anxiety-like behaviour and are hypersensitive to stress. Nat Genet. 2000;24:410–414. doi: 10.1038/74263. [DOI] [PubMed] [Google Scholar]
- Bale TL, Picetti R, Contarino A, Koob GF, Vale WW, Lee KF. Mice deficient for both corticotropin-releasing factor receptor 1 (CRFR1) and CRFR2 have an impaired stress response and display sexually dichotomous anxiety-like behavior. J Neurosci. 2002;22:193–199. doi: 10.1523/JNEUROSCI.22-01-00193.2002. [DOI] [PMC free article] [PubMed] [Google Scholar]
- Beck SG, Pan YZ, Akanwa AC, Kirby LG. Median and dorsal raphe neurons are not electrophysiologically identical. J Neurophysiol. 2004;91:994–1005. doi: 10.1152/jn.00744.2003. [DOI] [PMC free article] [PubMed] [Google Scholar]
- Berton O, Nestler EJ. New approaches to antidepressant drug discovery: beyond monoamines. Nat Rev Neurosci. 2006;7:137–151. doi: 10.1038/nrn1846. [DOI] [PubMed] [Google Scholar]
- Boldrini M, Underwood MD, Mann JJ, Arango V. Serotonin-1A autoreceptor binding in the dorsal raphe nucleus of depressed suicides. J Psychiatr Res. 2008;42:433–442. doi: 10.1016/j.jpsychires.2007.05.004. [DOI] [PMC free article] [PubMed] [Google Scholar]
- Bondi CO, Rodriguez G, Gould GG, Frazer A, Morilak DA. Chronic unpredictable stress induces a cognitive deficit and anxiety-like behavior in rats that is prevented by chronic antidepressant drug treatment. Neuropsychopharmacology. 2008;33:320–331. doi: 10.1038/sj.npp.1301410. [DOI] [PubMed] [Google Scholar]
- Chamas FM, Underwood MD, Arango V, Serova L, Kassir SA, Mann JJ, Sabban EL. Immobilization stress elevates tryptophan hydroxylase mRNA and protein in the rat raphe nuclei. Biol Psychiatry. 2004;55:278–283. doi: 10.1016/s0006-3223(03)00788-1. [DOI] [PubMed] [Google Scholar]
- Clark MS, McDevitt RA, Hoplight BJ, Neumaier JF. Chronic low dose ovine corticotropin releasing factor or urocortin II into the rostral dorsal raphe alters exploratory behavior and serotonergic gene expression in specific subregions of the dorsal raphe. Neuroscience. 2007;146:1888–1905. doi: 10.1016/j.neuroscience.2007.03.032. [DOI] [PMC free article] [PubMed] [Google Scholar]
- Contarino A, Dellu F, Koob GF, Smith GW, Lee KF, Vale W, Gold LH. Reduced anxiety-like and cognitive performance in mice lacking the corticotropin-releasing factor receptor 1. Brain Res. 1999;835:1–9. doi: 10.1016/s0006-8993(98)01158-5. [DOI] [PubMed] [Google Scholar]
- Daugherty WP, Corley KC, Phan TH, Boadle-Biber MC. Further studies on the activation of rat median raphe serotonergic neurons by inescapable sound stress. Brain Res. 2001;923:103–111. doi: 10.1016/s0006-8993(01)03198-5. [DOI] [PubMed] [Google Scholar]
- Ducottet C, Griebel G, Belzung C. Effects of the selective nonpeptide corticotropin-releasing factor receptor 1 antagonist antalarmin in the chronic mild stress model of depression in mice. Prog Neuropsychopharmacol Biol Psychiatry. 2003;27:625–631. doi: 10.1016/S0278-5846(03)00051-4. [DOI] [PubMed] [Google Scholar]
- El Mansari M, Sánchez C, Chouvet G, Renaud B, Haddjeri N. Effects of acute and long-term administration of escitalopram and citalopram on serotonin neurotransmission: an in vivo electrophysiological study in rat brain. Neuropsychopharmacology. 2005;30:1269–1277. doi: 10.1038/sj.npp.1300686. [DOI] [PubMed] [Google Scholar]
- Holsboer F. The corticosteroid receptor hypothesis of depression. Neuropsychopharmacology. 2000;23:477–501. doi: 10.1016/S0893-133X(00)00159-7. [DOI] [PubMed] [Google Scholar]
- Kang HJ, Adams DH, Simen A, Simen BB, Rajkowska G, Stockmeier CA, Overholser JC, Meltzer HY, Jurjus GJ, Konick LC, Newton SS, Duman RS. Gene expression profiling in postmortem prefrontal cortex of major depressive disorder. J Neurosci. 2007;27:13329–13340. doi: 10.1523/JNEUROSCI.4083-07.2007. [DOI] [PMC free article] [PubMed] [Google Scholar]
- Kasahara M, Groenink L, Breuer M, Olivier B, Sarnyai Z. Altered behavioural adaptation in mice with neural corticotrophin-releasing factor overexpression. Genes Brain Behav. 2007;6:598–607. doi: 10.1111/j.1601-183X.2006.00286.x. [DOI] [PubMed] [Google Scholar]
- Keeney A, Jessop DS, Harbuz MS, Marsden CA, Hogg S, Blackburn-Munro RE. Differential effects of acute and chronic social defeat stress on hypothalamic-pituitary-adrenal axis function and hippocampal serotonin release in mice. J Neuroendocrinol. 2006;18:330–338. doi: 10.1111/j.1365-2826.2006.01422.x. [DOI] [PubMed] [Google Scholar]
- Keller MB. Issues in treatment-resistant depression. J Clin Psychiatry. 2005;66(Suppl 8):5–12. [PubMed] [Google Scholar]
- Kirby LG, Rice KC, Valentino RJ. Effects of corticotropin-releasing factor on neuronal activity in the serotonergic dorsal raphe nucleus. Neuropsychopharmacology. 2000;22:148–162. doi: 10.1016/S0893-133X(99)00093-7. [DOI] [PubMed] [Google Scholar]
- Kirby LG, Pernar L, Valentino RJ, Beck SG. Distinguishing characteristics of serotonin and non-serotonin-containing cells in the dorsal raphe nucleus: electrophysiological and immunohistochemical studies. Neuroscience. 2003;116:669–683. doi: 10.1016/s0306-4522(02)00584-5. [DOI] [PMC free article] [PubMed] [Google Scholar]
- Lemos JC, Pan YZ, Ma X, Lamy C, Akanwa AC, Beck SG. Selective 5-HT receptor inhibition of glutamatergic and GABAergic synaptic activity in the rat dorsal and median raphe. Eur J Neurosci. 2006;24:3415–3430. doi: 10.1111/j.1460-9568.2006.05222.x. [DOI] [PMC free article] [PubMed] [Google Scholar]
- Lowry CA. Functional subsets of serotonergic neurones: implications for control of the hypothalamic-pituitary adrenal axis. J Neuroendocrinol. 2002;14:911–923. doi: 10.1046/j.1365-2826.2002.00861.x. [DOI] [PubMed] [Google Scholar]
- Lowry CA, Moore FL. Regulation of behavioral responses by corticotropin-releasing factor. Gen Comp Endocrinol. 2006;146:19–27. doi: 10.1016/j.ygcen.2005.12.006. [DOI] [PubMed] [Google Scholar]
- Lowry CA, Rodda JE, Lightman SL, Ingram CD. Corticotropin-releasing factor increases in vitro firing rates of serotonergic neurons in the rat dorsal raphe nucleus: evidence for activation of a topographically organized mesolimbocortical serotonergic system. J Neurosci. 2000;20:7728–7736. doi: 10.1523/JNEUROSCI.20-20-07728.2000. [DOI] [PMC free article] [PubMed] [Google Scholar]
- McEwen BS. Mood disorders and allostatic load. Biol Psychiatry. 2003;54:200–207. doi: 10.1016/s0006-3223(03)00177-x. [DOI] [PubMed] [Google Scholar]
- Millan MJ, Veiga S, Girardon S, Brocco M. Blockade of serotonin 5-HT1B and 5-HT2A receptors suppresses the induction of locomotor activity by 5-HT reuptake inhibitors, citalopram and fluvoxamine, in NMRI mice exposed to a novel environment: a comparison to other 5-HT receptor subtypes. Psychopharmacology. 2003;168:397–409. doi: 10.1007/s00213-003-1389-y. [DOI] [PubMed] [Google Scholar]
- Nakamura K, Kurasawa M. Serotonergic mechanisms involved in the attentional and vigilance task performance of rats and the palliative action of aniracetam. Naunyn Schmiedebergs Arch Pharmacol. 2000;361:521–528. doi: 10.1007/s002100000222. [DOI] [PubMed] [Google Scholar]
- Paxinos G, Franklin KBJ. The mouse brain in stereotaxic coordinates, compact. second edition. Oxford: Elsevier; 2003. [Google Scholar]
- Price ML, Curtis AL, Kirby LG, Valentino RJ, Lucki I. Effects of corticotropin-releasing factor on brain serotonergic activity. Neuropsychopharmacology. 1998;18:492–502. doi: 10.1016/S0893-133X(97)00197-8. [DOI] [PubMed] [Google Scholar]
- Roche M, Commons KG, Peoples A, Valentino RJ. Circuitry underlying regulation of the serotonergic system by swim stress. J Neurosci. 2003;23:970–977. doi: 10.1523/JNEUROSCI.23-03-00970.2003. [DOI] [PMC free article] [PubMed] [Google Scholar]
- Strekalova T, Spanagel R, Dolgov O, Bartsch D. Stress-induced hyperlocomotion as a confounding factor in anxiety and depression models in mice. Behav Pharmacol. 2005;16:171–180. doi: 10.1097/00008877-200505000-00006. [DOI] [PubMed] [Google Scholar]
- Tan H, Zhong P, Yan Z. Corticotropin-releasing factor and acute stress prolongs serotonergic regulation of GABA transmission in prefrontal cortical pyramidal neurons. J Neurosci. 2004;24:5000–5008. doi: 10.1523/JNEUROSCI.0143-04.2004. [DOI] [PMC free article] [PubMed] [Google Scholar]
- Teegarden SL, Bale TL. Decreases in dietary preference produce increased emotionality and risk for dietary relapse. Biol Psychiatry. 2007;61:1021–1029. doi: 10.1016/j.biopsych.2006.09.032. [DOI] [PubMed] [Google Scholar]
- Thomas E, Pernar L, Lucki I, Valentino RJ. Corticotropin-releasing factor in the dorsal raphe nucleus regulates activity of lateral septal neurons. Brain Res. 2003;960:201–208. doi: 10.1016/s0006-8993(02)03882-9. [DOI] [PubMed] [Google Scholar]
- Valentino RJ, Commons KG. Peptides that fine-tune the serotonin system. Neuropeptides. 2005;39:1–8. doi: 10.1016/j.npep.2004.09.005. [DOI] [PubMed] [Google Scholar]
- Valentino RJ, Liouterman L, Van Bockstaele EJ. Evidence for regional heterogeneity in corticotropin-releasing factor interactions in the dorsal raphe nucleus. J Comp Neurol. 2001;435:450–463. doi: 10.1002/cne.1043. [DOI] [PubMed] [Google Scholar]
- Varga V, Székely AD, Csillag A, Sharp T, Hajós M. Evidence for a role of GABA interneurones in the cortical modulation of midbrain 5-hydroxytryptamine neurones. Neuroscience. 2001;106:783–792. doi: 10.1016/s0306-4522(01)00294-9. [DOI] [PubMed] [Google Scholar]
- Vertes RP, Kocsis B. Projections of the dorsal raphe nucleus to the brainstem: PHA-L analysis in the rat. J Comp Neurol. 1994;340:11–26. doi: 10.1002/cne.903400103. [DOI] [PubMed] [Google Scholar]
- Vertes RP, Fortin WJ, Crane AM. Projections of the median raphe nucleus in the rat. J Comp Neurol. 1999;407:555–582. [PubMed] [Google Scholar]
- Wang RY, Aghajanian GK. Physiological evidence for habenula as major link between forebrain and midbrain raphe. Science. 1977;197:89–91. doi: 10.1126/science.194312. [DOI] [PubMed] [Google Scholar]
- Wang RY, de Montigny C, Gold BI, Roth RH, Aghajanian GK. Denervation supersensitivity to serotonin in rat forebrain: single cell studies. Brain Res. 1979;178:479–497. doi: 10.1016/0006-8993(79)90708-x. [DOI] [PubMed] [Google Scholar]
- Weisstaub NV, Zhou M, Lira A, Lambe E, González-Meso J, Hornung J, Sibille W, Underwood M, Itohara S, Dauer WT, Ansorge MS, Morelli E, Mann JJ, Toth M, Sealfon SC, Aghajanian G, Hen R, Gingrich JA. Cortical 5-HT2A receptor signaling modulates anxiety-like behaviors in mice. Science. 2006;313:536–540. doi: 10.1126/science.1123432. [DOI] [PubMed] [Google Scholar]
- Zhong P, Yan Z. Chronic antidepressant treatment alters serotonergic regulation of GABA transmission in prefrontal cortical pyramidal neurons. Neuroscience. 2004;129:65–73. doi: 10.1016/j.neuroscience.2004.06.072. [DOI] [PubMed] [Google Scholar]