

Abstract
The mechanisms by which the GABA and benzodiazepine (BZD) binding sites of the GABA-A receptor are allosterically coupled remain elusive. Here, we separately monitored ligand-induced structural changes in the BZD binding site (α/γ interface) and at aligned positions in the α/β interface. α1H101 and surrounding residues were individually mutated to cysteine and expressed with wild-type β2 and γ2 subunits in Xenopus oocytes. The accessibilities of introduced cysteines to modification by MTSEA-Biotin were measured in the presence and absence of GABA-site agonists, antagonists, BZDs and pentobarbital. The presence of flurazepam or the BZD-site antagonist, Ro15-1788, decreased the rate of modification of α1H101C at the BZD binding site. GABA and muscimol each increased MTSEA-biotin modification of α1H101C located at the BZD-site, SR-95531 (a GABA binding site antagonist) decreased the rate, whereas pentobarbital had no effect. Modification of α1H101C at the α/β interface was significantly slower than modification of α1H101C at the BZD-site and the presence of GABA or flurazepam had no effect on its accessibility indicating the physico-chemical environments of the α/γ and α/β interfaces are different. The data are consistent with the idea that GABA-binding site occupation by agonists causes a GABA binding cavity closure that is directly coupled to BZD binding cavity opening and GABA-site antagonist binding causes a movement linked to BZD binding cavity closure. Pentobarbital binding/gating resulted in no observable movements in the BZD binding site near α1H101C indicating that structural mechanisms underlying allosteric coupling between the GABA and BZD binding sites are distinct.
Introduction
Benzodiazepines (BZDs) are one of the most commonly prescribed classes of drugs in the United States and are used as anxiolytics, anticonvulsants, sleep aids, muscle relaxants and antipsychotics (Doble and Martin, 1996; Hevers and Luddens, 1998; Rudolph et al., 2001; Rudolph and Mohler, 2004). BZDs exert their effects by binding to the γ-aminobutyric acid type A (GABA-A) receptor and allosterically modulating GABA-activated currents. While studies have shown that GABA and BZD binding cause reciprocal increases in the affinities of these ligands for their respective binding sites (Choi et al., 1981; Hattori et al., 1986; Karobath and Sperk, 1979; Olsen and Snowman, 1982; Rogers et al., 1994; Tallman et al., 1978), little is known about the structural mechanisms involved in coupling the two sites.
The GABA-A receptor mediates the majority of synaptic inhibition in the brain and is a member of the cys-loop family of receptors, which includes the nicotinic acetylcholine receptor (nAChR), the serotonin 5HT3 receptor and the glycine receptor (Ortells and Lunt, 1995). Like other members of the cys-loop receptor family, the receptor consists of five subunits arranged around a central ion-conducting channel. The majority of native receptors are composed of two α1 subunits, two β2 subunits and one γ2 subunit (McKernan and Whiting, 1996) with each receptor containing two GABA binding sites located at the β/α subunit interfaces and one BZD binding site located at the α/γ subunit interface (Figure 1). A single α1 subunit contributes to forming both a GABA and BZD binding site.
Figure 1. A. Alignment of “Loop A” binding site regions from the GABA-A receptor ratα1 and β2 subunits and the nAChR torpedo α subunit.

Residues in the GABAA receptor α1 subunit that were mutated to cysteine are denoted by a “c” above the wild-type residue. Residues in α1 identified in this study that are accessible to MTSEA-Biotin are underlined. Residues previously identified in the GABA-A receptor β2 subunit and in the α subunit of the nAChR as being accessible to sulfhydryl-specific reagents are depicted in bold (Boileau et al., 2002; Sullivan and Cohen, 2000). B. Schematic of a α1β2γ2 GABAA receptor. The GABA binding sites (β/α interfaces) are indicated by black rectangles and the BZD site (α/γ interface) by a white circle. Stars show where the introduced cysteine mutations in the α1 subunits are located. The mutations are located at the α/γ interface (BZD binding site) and at the α/β interface (non-binding site).
The BZD binding site is located on the extracellular surface of the GABA-A receptor, and is formed by residues located in at least six noncontiguous regions at the α/γ interface historically designated Loops A-F (reviewed in (Sigel, 2002)). The BZD recognition site binds a large selection of ligands, agonists that potentiate GABA induced current (positive modulators)(Macdonald and Barker, 1978), inverse agonists that inhibit GABA current (negative modulators) (Macdonald et al., 1992; Oakley and Jones, 1980) and antagonists that competitively bind at the BZD binding site but have no effect on GABA current (zero modulators) (Braestrup et al., 1982). Because the therapeutic value of BZDs depends upon their efficacy in modulating IGABA, mapping structural rearrangements involved in mediating the full range of BZD actions from positive to negative modulation of IGABA is essential.
Here, we used the substituted cysteine accessibility method (SCAM) to monitor movements within the BZD binding site near α1H101. Site-directed mutagenesis, photolabeling studies and molecular modeling have shown that α1H101 resides within the core of the BZD binding site (Duncalfe et al., 1996; Dunn et al., 1999; Sieghart, 2006; Tan et al., 2007). α1H101 and surrounding residues were individually mutated to cysteine. Changes in the ability of the sulfhydryl-specific reagent (MTSEA-Biotin) to modify the introduced cysteines were used to report structural movements that occur in the BZD binding site when GABA-site ligands, pentobarbital and BZDs, bind. Any alteration in the modification rate of the introduced cysteine induced by these ligands indicates that a change in the local environment near that cysteine has occurred (i.e. movements). Here, we demonstrate that GABA binding site occupation appears sufficient for inducing movement in the BZD binding site near α1H101 and that the structural mechanisms underlying coupling between the GABA and BZD binding sites are distinct from mechanisms involved in pentobarbital actions.
Materials and Methods
Site-directed Mutagenesis
Rat cDNA encoding α1, β2, and γ2S receptor subunits in the pGH19 vector (Liman et al., 1992; Robertson et al., 1996) were used for all molecular cloning and functional studies. Cysteine mutations were introduced into pGH19 rat α1 using recombinant PCR as described previously (Boileau et al., 1999; Kucken et al., 2000). Cysteine substitutions were introduced at positions D97, T98, F99, F100, H101, N102, G103, K104, K105 and S106. The mutant α1 subunits are designated by the wildtype residue, residue number in the mature rat α1 subunit followed by residue introduced (cysteine). The presence of the mutations was verified using diagnostic endonuclease restriction digestion and double-stranded sequencing.
Expression in Xenopus laevis oocytes
Xenopus laevis oocytes were prepared as described previously (Boileau et al., 1998). Capped cRNA coding for the wildtype and mutant subunits was synthesized by in vitro transcription from NheI-linearized cDNA template using the mMessage mMachine T7 kit (Ambion). GABAA receptor α1 or α1-mutant subunits were expressed with wild-type β2 and γ2 subunits by injection of 5 nl of cRNA (5–50 ng/μl/subunit) mixed in a ratio of 1:1:10 (α:β:γ), dissolved in RNAse-free water. Mean maximal responses to GABA were between 250 nA and 10μA. Oocytes were stored at 16° C in ND96 medium (in mM: 96 NaCl, 2 KCl, 1.8 CaCl2, 1 MgCl2, 5 HEPES, pH 7.4) supplemented with 100 μg/ml gentamicin and 100 μg/ml BSA, and were used for electrophysiological recording after 2–14 days.
Electrophysiological recording
Oocytes under two-electrode voltage-clamp (Vhold = −80 mV) were perfused at a rate of 5 ml/min with ND96 recording solution. The bath volume was 200 μl. Electrodes were filled with 3 M KCl and had a resistance of 0.5 – 1.7 MΩ. Drugs and reagents were dissolved in ND96. The stock MTSEA-Biotin solution and BCCM were made in DMSO. Final concentration of DMSO in applied solutions was ≤ 1.0%. Standard two-electrode voltage clamp recording was performed using a GeneClamp 500 (Axon Instruments) interfaced to a computer with a Digidata 1200 (Axon Instruments). Data acquisition and analysis were performed using pCLAMP 6 (Molecular Devices).
GABA EC50 Analysis
Concentration response experiments were performed as described previously (Boileau and Czajkowski, 1999). GABA responses were scaled for run-down or run-up by comparison to a low, non-desensitizing concentration of drug applied just prior to the drug concentration tested. Concentrations were tested starting from lowest to highest, then reversing the order in the same oocyte. Concentration response curves for GABA were fit with the equation I = Imax/(1 + (EC50/A)n), where A is the agonist concentration, EC50 the concentration of GABA eliciting half maximal current amplitude, Imax is the maximal current amplitude, I the current amplitude and n the Hill coefficient using Prism v.4.0 (GraphPad, San Diego, CA).
FLZM EC50 Analysis
Flurazepam potentiation was recorded at GABA EC13-17. For each oocyte, we compared the current response of a low concentration test pulse of GABA to the current response of a 10 mM test pulse of GABA (peak current for all receptors) and using a standard Hill equation estimated EC50 for that oocyte to determine the appropriate GABA EC13-17 concentration to use when measuring BZD responses. FLZM potentiation is defined as (I-(GABA+FLZM)/I-GABA) −1, where I-(GABA+FLZM) is the current response in the presence of flurazepam and I-GABA is the control GABA current. FLZM concentrations were tested starting from lowest to highest. Concentration response curves for FLZM were fit with the equation P = Pmax/(1 + (EC50/ A )n), where A is the FLZM concentration, EC50 the concentration of FLZM eliciting half maximal current potentiation, Pmax is the maximal FLZM potentiation of I-GABA, P is the potentiation amplitude and n the Hill coefficient using Prism v.4.0 (GraphPad, San Diego, CA).
Pulse Protocol for Calculating MTSEA-Biotin Effects
The sulfhydryl-specific reagent used was MTSEA-Biotin, obtained from Toronto Research Chemicals (Toronto Ontario, Canada). We use MTSEA-biotin because it is impermeable to the membrane, it is not charged and its size (similar to BZDs) is suitable for fitting within the binding site and it is bulky enough to make it likely that covalently attaching it to an introduced cysteine will result in a functional effect. Oocytes were stabilized before addition of MTSEA-Biotin by application of GABA and GABA+FLZM at 5 min intervals until the GABA-activated currents (I-GABA) and FLZM potentiation of I-GABA varied by <6%. GABA concentrations used were EC13-17 and FLZM concentrations used were EC95 for each mutant. After the GABA and FLZM responses were stabilized, freshly diluted MTSEA-Biotin at 2mM concentration was applied for 2 min; the cell was washed for 5 min, and then GABA and GABA+FLZM responses were measured. The effect of MTSEA-Biotin on GABA current was calculated as (I-GABApost/I-GABApre) - 1, where I-GABApost is the current elicited by GABA after MTS application, and I-GABApre is the current elicited by GABA before MTS application. The effect of MTSEA-Biotin on FLZM potentiation was calculated as (FLZMpre/FLZMpost)-1 where FLZMpre was the FLZM potentiation of I-GABA before MTS application and FLZMpost was the FLZM potentiation of I-GABA after MTS application.
Rate of MTSEA-Biotin Modification
The rate of MTS reagent covalent modification of introduced cysteines was determined by measuring the effect of sequential applications of subsaturating concentrations of MTSEA-Biotin on I-GABA and FLZM potentiation of I-GABA. EC13-17 GABA or EC13-17 GABA followed by EC13-17 GABA+EC95 FLZM was applied, the cell was washed for 30 s; MTS reagent was applied for 5–20 s; the cell was washed for 2.5 min; and the procedure was repeated until changes in I-GABA and FLZM potentiation reached a plateau. Before the reaction rate was measured, GABA and GABA+FLZM were applied every 3 minutes until the response was stable to ± 6%. The effects of agonists and antagonists on the rate of MTS modification were tested by co-applying MTSEA-Biotin with GABA (EC95), SR-95531 (IC95), pentobarbital (500 μM), BCCM (EC95) FLZM (EC95), or Ro15-1788 (EC95) for all mutants. The change in current was plotted versus cumulative time of MTS exposure. A pseudo first-order rate constant was calculated from the change in I-GABA and FLZM potentiation. Peak values at each time point were normalized to the initial peak at time=0 sec, and a pseudo first-order rate constant (k1) was determined by fitting the data with a single exponential decay equation: y = span·e−kt + plateau using Prism v.4.0 (GraphPad, San Diego, CA). Because the data are normalized to values at time 0, span = 1 − plateau. The second-order rate constant (k2) for MTS reaction was determined by dividing the calculated pseudo first-order rate constant by the concentration of MTSEA-Biotin used. To verify the accuracy of this protocol, second-order rate constants were determined using at least two different concentrations of MTSEA-Biotin for several mutants.
The drug concentrations used to modify α1D97Cβ2γ2 receptors (monitoring changes in I-GABA) were: control = 4 mM MTS; +FLZM = 4 mM MTS and 6 μM FLZM; +BCCM = 4 mM MTS and 1 μM BCCM; +GABA = 4 mM MTS and 2 mM GABA. The drug concentrations used to modify α1H101Cβ2 receptors (monitoring changes in I-GABA) were: control = 1 mM MTS; + FLZM = 1 mM MTS and 100 μM FLZM; + Ro15-1788 = 1 mM MTS and 1 μM Ro15-1788; +GABA = 1 mM MTS and 300 μM GABA. The drug concentrations used to modify α1H101Cβ2γ2 receptors (monitoring FLZM potentiation of I-GABA) were: control = 50 μM MTS; +FLZM = 50 μM MTS and 100 μM FLZM; +Ro15-1788 = 50 μM MTS and 3 μM Ro15-1788; +GABA = 5 μM MTS and 1 mM GABA; +PENTO = 50 μM MTS and 500 μM PENTO; +Muscimol = 5 μM MTS and 300 μM Muscimol. The drug concentrations used to modify α1H101Cβ2γ2 receptors (Monitoring changes in I-GABA) were: control =1 mM MTS; +FLZM = 1 mM MTS and 100 μM FLZM; + Ro15-1788 = 100 μM MTS and 3 μM Ro15-1788; +GABA = 250 μM MTS and 2 mM GABA. The drug concentrations used to modify α1N102Cβ2γ2 receptors (monitoring changes in both I-GABA and FLZM potentiation of I-GABA) were: control = 1 mM MTS; +FLZM = 2 mM MTS and 30 μM FLZM; +BCCM = 2 mM MTS and 1 μM BCCM; +GABA = 1 mM MTS and 4 mM GABA; +PENTO = 1 mM MTS and 500 μM PENTO. The drug concentrations used to modify α1S106Cβ2γ2 receptors (monitoring changes in both I-GABA and FLZM potentiation of I-GABA) were: control = 1 mM MTS; +FLZM = 1 mM MTS and 3 μM FLZM; +Ro15-1788 = 2 mM MTS and 5 μM Ro15-1788; +GABA = 1 mM MTS and 300 μM GABA.
Statistical Analysis
Data analysis was carried out using nonlinear regression analysis included in the GraphPad Prism software package (San Diego, CA; www.graphpad.com). Statistical analysis on MTSEA-Biotin accessibility (2 min 2 mM MTS-Biotin pulses) and GABA and FLZM EC50 values was conducted using a one-way analysis of variance, followed by a post hoc Dunnett's test. Statistical analysis of MTSEA-Biotin rate calculations was performed using the False Discovery Rate (FDR) Method (Benjamini and Hochberg, 1995) accessed via the University of North Texas website (http://www.unt.edu/benchmarks/archives/2002/april02/rss.htm). We thank Mary Lindstrom (UW-Madison Stats Dept) and Chenlei Leng (National University of Singapore, Stats Dept) for their assistance with this method.
Results
Effects of Cysteine Mutations
Amino acid residues α1 D97-S106 were individually mutated to cysteine (Figure 1A) and expressed with wild type β2 and γ2 subunits in Xenopus laevis oocytes. In α1β2γ2 receptors there are two α1 subunits, and thus, the introduced cysteines are located at both the α1/γ2 interface (BZD binding site) and the α1/β2 interface (non-GABA binding site) (Figure 1B). To determine whether the introduced cysteines affected GABAA receptor function and/or expression, two-electrode voltage clamp was used to measure GABA and flurazepam (FLZM) concentration responses (Figure 2). With the exceptions of α1T98C and α1F100C, the mutant subunits assembled into functional α1β2γ2 receptors. For five mutant receptors, the GABA EC50 values were not significantly different from the wild type receptor value (EC50 = 17 μM). For α1D97C and α1N102C containing receptors, the GABA EC50 values were increased 10-fold and 24-fold, respectively (Table 1), whereas a 4-fold decrease in GABA EC50 was measured for α1S106C containing receptors. Two mutations significantly altered FLZM concentration responses. For α1H101C and α1N102C containing receptors, FLZM EC50 values were increased 19- and 6-fold, respectively (Table 1). There was no correlation between mutations that affected GABA EC50 (e.g. D97C, N102C and S106C) and mutations that affected BZD EC50 (e.g. H101C, N102C) (Table 1).
Figure 2. Representative GABA and FLZM concentration-response curves for wildtype and mutant receptors.

In panel A, the data are normalized to maximal GABA current response for each receptor. In panel B, the data are normalized to maximal FLZM potentiation of GABA (EC15) current. Dashed lines are curve fits from wild type receptors. EC50 values and calculated Hill coefficients are reported in Table 1.
Table 1.
Summary of GABA and FLZM concentration response data for wildtype and mutant receptors.
| Receptor | GABA EC50 (μM) | nH | n | EC50 mut/EC50 αβγ | FLZM EC50 (μM) | nH | n | EC50 mut/EC50 αβγ |
|---|---|---|---|---|---|---|---|---|
| α1β2γ2 | 17.4 ± 7.0 | 1.6 +/− .3 | 4 | 1 | .47 ± .15 | 1.3 ± .3 | 5 | 1 |
| α1 D97C β2γ2 | 168.8 ± 73.5 | .94 ± .2 | 4 | 9.7 * | .56 ± .12 | 1.1 ± .1 | 3 | 1.2 |
| α1 T98C β2 γ2 | No expression | No Expression | ||||||
| α1 F99C β2 γ2 | 50.6 ± .5 | 1.1 ± .1 | 3 | 2.9 | .43 ± .12 | 1.6 ± .2 | 3 | 0.91 |
| α1 F100C β2γ2 | No expression | No Expression | ||||||
| α1 H101C β2 γ2 | 50.5 ± 26.1 | 1.56 ± .3 | 7 | 2.9 | 9.0 ± .13 | 1.8 ± .1 | 3 | 19.1 * |
| α1 N102C β2 γ2 | 410 ± 305 | .56 ± .2 | 7 | 23.6 * | 2.6 ± .95 | 1.0 ± .2 | 3 | 5.5 * |
| α1 G103C β2 γ2 | 10.9 ± 5.6 | 1.3 ± .3 | 4 | 0.6 | .27 ± .03 | 1.2 ± .4 | 4 | 0.57 |
| α1 K104C β2 γ2 | 13.3 ± 6.7 | .96 ± .2 | 3 | 0.8 | .40 ± .18 | 1.3 ± .5 | 5 | 0.85 |
| α1 K105C β2 γ2 | 23.2 ± 3.5 | 1.3 ± .1 | 3 | 1.3 | .29 ± .10 | 1.1 ± .2 | 3 | 0.62 |
| α1 S106C β2 γ2 | 4.9 ± 1.8 | 1.3 ± .1 | 3 | 0.3 ** | .44 ± .14 | 1.5 ± .2 | 3 | 0.94 |
Data represent mean ± SD. nH values are calculated Hill coefficients.
Statistically different from wild type (p < .001),
statistically different from wild type (p< .05)
Effects of MTSEA-Biotin Modification
To determine the accessibility of the introduced cysteines, wild type and mutant receptors were exposed to MTSEA-Biotin (2 mM) for 2 minutes. GABA-elicited current (I-GABA) and FLZM potentiation of I-GABA were measured before and after MTSEA-Biotin exposure (Figure 3). MTSEA-Biotin had no effect on GABA or FLZM responses in wild type receptors. Thus, any changes measured in I-GABA or FLZM potentiation of I-GABA following MTSEA-Biotin exposure indicate that the introduced cysteine was modified. MTSEA-Biotin both increased I-GABA and decreased FLZM potentiation in α1H101C, α1N102C and α1S106C containing receptors, whereas in α1D97C-containing receptors, exposure to MTSEA-Biotin only decreased I-GABA and had no effect on FLZM potentiation. The data demonstrate that α1D97C, α1H101C, α1N102C and α1S106C are accessible. MTSEA-Biotin had no effect on receptors containing α1F99C, α1G103C, α1K104C, and α1K105C. These residues are either inaccessible or reacted with MTSEA-Biotin but the reactions had no functional effect. The pattern of accessibility does not predict a secondary structure such as a β-strand or α-helix (Figure 3) and the α1D97C-α1S106C region is likely to be a turn or a random coil.
Figure 3. Effects of MTSEA-Biotin on wildtype and mutant receptors.
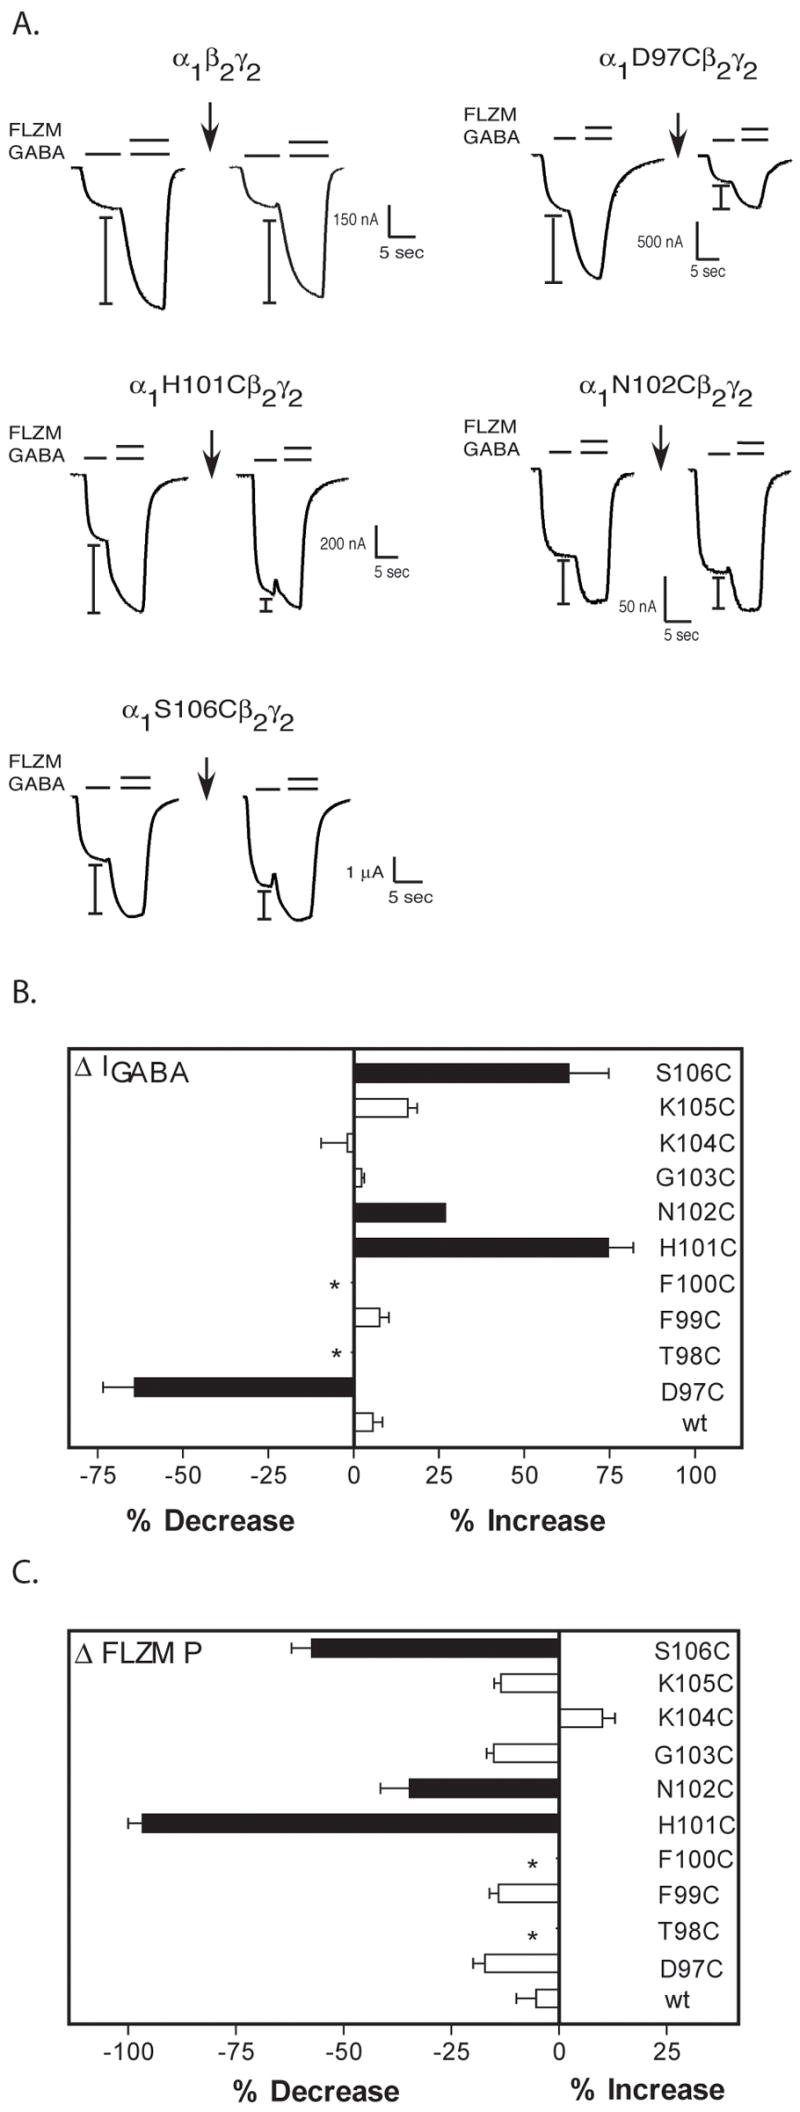
A. Representative current traces from oocytes expressing wild type and mutant α1β2γ2 receptors showing FLZM potentiation of I-GABA (EC15 GABA) before and after application of a 2 mM, 2 minute pulse of MTSEA-Biotin (arrows). I-bars denote potentiation of I-GABA measured during FLZM (EC95) application. B, C. Bar graphs representing the percent changes in I-GABA (ΔI-GABA) and FLZM potentiation (ΔP) following MTSEA-Biotin modification. The percent change in I-GABA is defined as [((I-GABA-after/I-GABA-before) − 1) × 100]. The percent change in FLZM potentiation (ΔP) is defined as [((ΔP-after/ΔPbefore) − 1) × 100]. Data represent the mean ± SD from 3 or more separate experiments. Black bars indicate values that are statistically different from wild type (wt) values (p < .05). *No detectable functional receptor expression.
To examine if the increases in I-GABA and decreases in FLZM potentiation observed following MTSEA-Biotin exposure were linked, we examined the concentration of MTSEA-Biotin needed to elicit these effects in receptors containing α1H101C. Modification of α1H101C by MTSEA-Biotin (2 min, 2mM) decreased FLZM potentiation of I-GABA by 97 ± 6% and increased I-GABA by 75 ± 17% (Figure 3). In contrast, a 10 second exposure to a low concentration of MTSEA-Biotin (50 μM) almost completely abolished FLZM potentiation without altering I-GABA (Figure 4). Subsequent treatment with a high concentration of MTSEA-Biotin (4 mM, 10 sec) increased I-GABA (Figure 4). The data suggest that the effects of MTSEA-Biotin on GABA current are not correlated with the effects on BZD modulation and are inconsistent with reciprocal regulation of GABA and BZD binding affinities.
Figure 4. Concentration dependence of MTSEA-Biotin effects on α1H101Cβ2γ2 receptors.
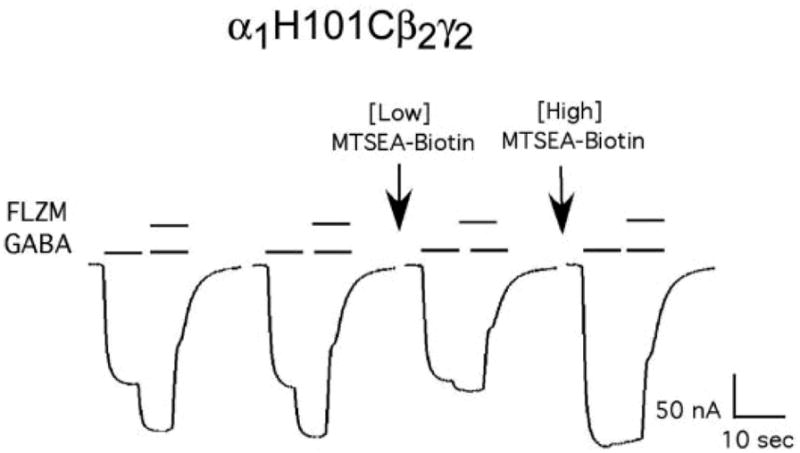
Representative GABA (EC15) and GABA (EC15) + FLZM (EC95) current responses from a single oocyte expressing α1H101Cβ2γ2 receptors. Arrows indicate ten second exposures to a low concentration (50 μM) and then a high concentration (4 mM) of MTSEA-Biotin. FLZM potentiation of I-GABA is abolished following application of a low concentration of MTSEA-Biotin while I-GABA is unchanged. Application of a subsequent high concentration of MTSEA-Biotin increases I-GABA.
MTSEA-Biotin Reaction Rates
The rate at which MTSEA-Biotin reacts with a cysteine side chain depends mainly on the ionization state of the thiol group and the access route to the engineered cysteine. A residue in a relatively open, aqueous environment will react faster than a residue in a relatively restrictive, non-polar environment. As predicted from the experiments described above using a low concentration of MTSEA-Biotin, the decrease in FLZM potentiation of I-GABA, following MTSEA-Biotin modification of α1H101C, occurred 18-fold faster than the increase in I-GABA (k2-FLZM-P= 2258 ± 369 M−1sec−1 vs. k2-IGABA= 122.3 ± 10.8 M−1sec−1) (Figure 5). Since there are two introduced cysteines in a α1H101Cβ2γ2 receptor, each rate may correspond to derivatization of an individual cysteine. For example, rapid modification of α1H101C at the α/γ interface (BZD site) could be responsible for the decrease in BZD potentiation whereas slow modification of α1H101C at the α/β interface could be responsible for the increase in I-GABA. Alternatively, derivatization of the cysteine at the α/γ interface may be sufficient to decrease FLZM potentiation of I-GABA while modification of both cysteines is required for the increase in I-GABA. A faster decrease in BZD potentiation versus I-GABA increase was also observed for α1S106Cβ2γ2 receptors (Table 2). In α1N102Cβ2γ2 receptors, MTSEA-Biotin modification decreased FLZM potentiation and increased I-GABA at the same rate (Table 2) suggesting that the cysteine modification is occurring at the two different interfaces with the same rates or perhaps is occurring at only one interface and the effects on GABA current and FLZM potentiation were linked.
Figure 5. Rates of MTSEA-Biotin modification ofα1H101C.

Representative GABA (EC15) and GABA + FLZM (EC95) current responses from oocytes expressing α1H101Cβ2γ2 receptors (A and B) and α1H101Cβ2 receptors (C) before and after 10 sec applications of MTSEA-Biotin (arrows). Decreases in FLZM potentiation of I-GABA (A) and increases in I-GABA (B and C) were plotted versus cumulative MTSEA-Biotin exposure. In A, data were normalized to FLZM potentiation measured before MTSEA-Biotin exposure (t=0 sec). In B and C, data were normalized to I-GABA measured before MTSEA-Biotin exposure. The data were fit with single exponential functions and the calculated second order rate constants (k2) were determined as described in “Experimental Procedures”. Data points represent the mean +/− SEM from at least five independent experiments. k2 values are summarized in Table 2.
Table 2.
Second order rate constants (k2) for decreases in BZD potentiation and changes in I-GABA following MTSEA-biotin modification of mutant receptors.
| Receptor | BZD Potentation k2 (M−1 s−1) | n | I-GABA k2 (M−1 s−1) | n |
|---|---|---|---|---|
| α1 D97C β2 γ2 | 20.5 ± 5.7 | 6 | ||
| α1 H101C β2 γ2 | 2194.6 ± 354.1 | 6 | 122.3 ± 10.8* | 5 |
| α1 N102C β2 γ2 | 46.7 ± 5.5 | 7 | 52.9 ± 22.1 | 8 |
| α1 S106C β2 γ2 | 28.9 ± 8.2 | 6 | 11.3 ± 3.9* | 7 |
| α1 H101C β2 | 121.4 ± 40.4 | 5 |
The concentrations of MTSEA-Biotin used were variable depending on the mutant and are listed under “Experimental Procedures”. Values are mean ± SD.
Indicates the decrease in BZD potentiation was significantly faster that the increase in I-GABA (p<0.05) for that receptor.
To examine if modification of the introduced cysteine at the α/γ interface was required to observe the increase in I-GABA, the α1H101C subunit was expressed with only wild type β2 subunits. In α1H101Cβ2 receptors, the mutation is only present at non-binding site interfaces (α/β, α/α). MTSEA-Biotin treatment (2mM, 2 minute) of α1H101Cβ2 receptors increased I-GABA (Figure 5C). The rate of change in I-GABA (k2= 121 +/− 40 M−1sec−1) (Table 2) was similar to the rate measured for α1H101Cβ2γ2 receptors (k2= 122 +/− 11 M−1sec−1) (Table 2) and suggests that modification of the α1H101C at the α/β interface is responsible for the increase in I-GABA.
To examine if modification of α1H101C at the α/γ interface caused the decrease in FLZM potentiation measured, we examined the ability of BZD-site ligands (FLZM and Ro15-1788) to slow covalent modification of α1H101C (Figure 6). We reasoned that if the decrease in FLZM potentiation was caused by modification of α1H101C at the α/γ interface then the presence of BZD binding-site ligands should sterically block the site and slow the decrease in FLZM potentiation. Both FLZM and Ro15-1788 significantly slowed the rate of decrease in BZD potentiation caused by MTSEA-Biotin modification (3-fold and 37-fold, respectively; Table 3). FLZM had no effect on the rate of increase in I-GABA, whereas Ro15-1788 significantly increased the rate 2-fold (Table 3). Taken together, the above data support the hypothesis that rapid modification of α1H101C at the α/γ interface (BZD binding site) is responsible for the decrease in FLZM potentiation and slow modification at the α/β interface (non-binding site) is responsible for the increase in GABA-mediated current.
Figure 6. The effect of FLZM and Ro15-1788 on the rate of MTSEA-Biotin modification of α1H101C.
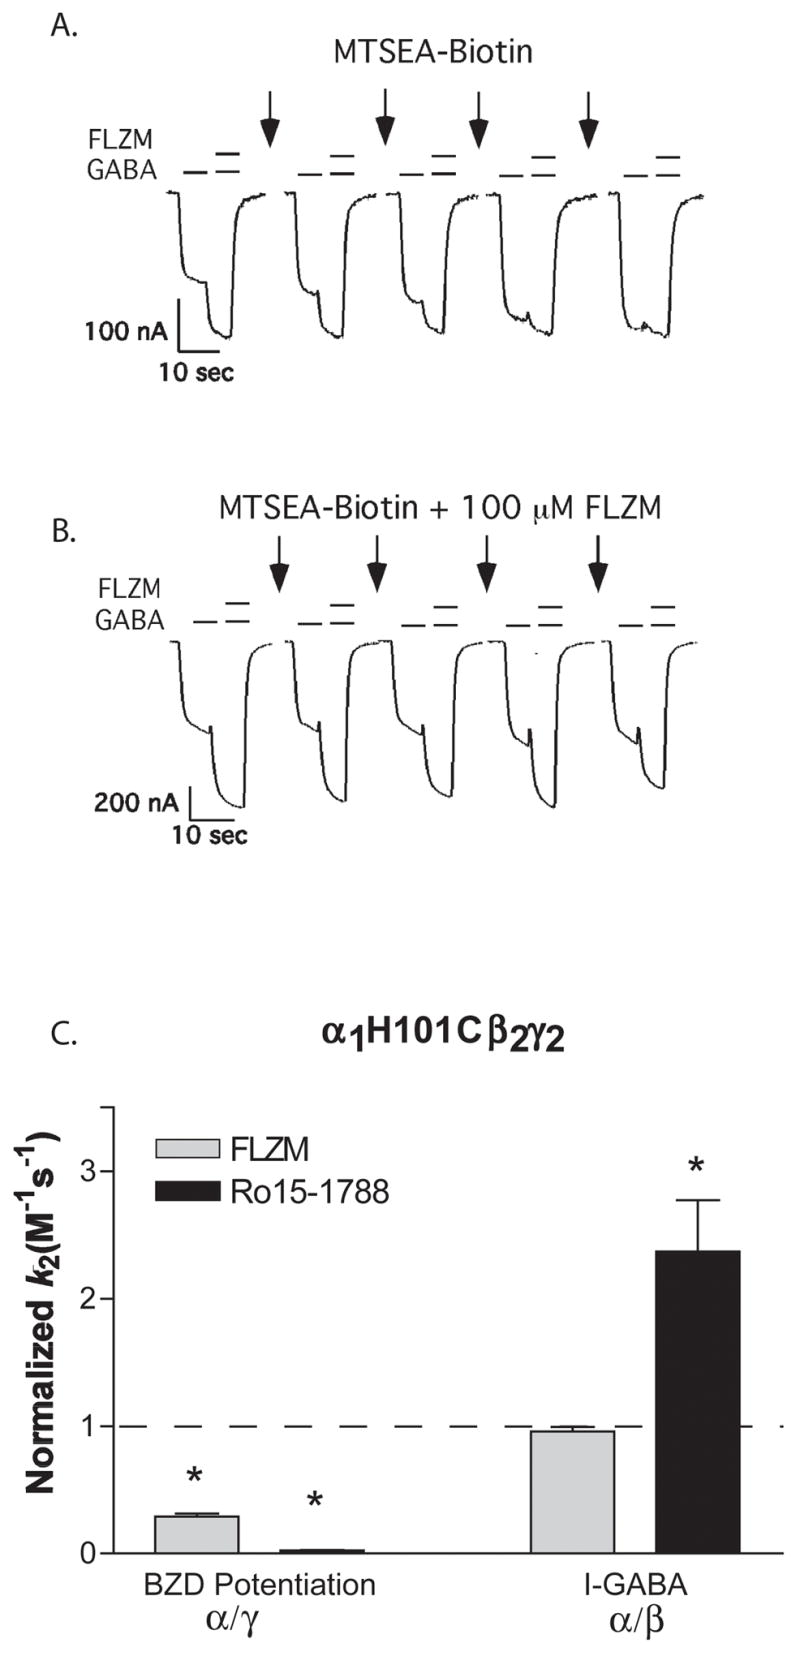
A, B. GABA (EC15) and GABA + FLZM (EC95) current responses from oocytes expressing α1H101β2γ2 receptors before and after applications of 50 μM MTSEA-Biotin alone (A) or in the presence of a saturating concentration of FLZM (B). C. MTSEA-Biotin k2 values were measured in the presence of FLZM (BZD agonist) and Ro 15-1788 (BZD antagonist) and normalized to values measured in the absence of these ligands (control, dashed line). Rate constants for the decrease in BZD potentiation (α/γ interface) and the increase in I-GABA (α/β interface) were measured. BZD-site ligands significantly slowed the rate of decrease in BZD potentiation caused by MTSEA-Biotin modification but did not slow the rate of increase in I-GABA. * Values significantly different from control (p < 0.05). k2 values are summarized in Table 3.
Table 3.
Second-order rate constants for MTSEA-Biotin derivatization of mutant receptors in the absence and presence of FLZM, Ro15-1788, βCCM, GABA and PENTO.
| A. | FLZM P | ||||||||||
|---|---|---|---|---|---|---|---|---|---|---|---|
| Control | FLZM | Ro15-1788 | BCCM | GABA | PENTO | ||||||
| Receptor | k2 (M −1 s−1) | n | k2 (M−1 s−1) | n | k2 (M −1 s−1) | n | k2 (M−1 s−1) | n | k2 (M−1 s−1) | n | k2 (M −1 s−1) |
| α1H101C β2 γ2 | 2194.6 ± 354.1 | 6 | 678.3 ± 145.8* | 4 | 59.0 ± 18.2* | 3 | ND | 9047.5 ± 1494.0* | 4 | 2299.0 ± 457.6 | |
| α1N102C β2 γ2 | 46.7 ± 5.5 | 7 | 30.9 ± 3.0 | 3 | # | 16.9 ± 3.7* | 3 | 91.2 ± 24.7* | 3 | 54.5 ± 14.9 | |
| α1 S106C β2 γ2 | 28.9 ± 8.2 | 6 | 45.6 ± 7.5* | 3 | 11.9 ± 3.1* | 3 | ND | 20.0 ± 5.4 | 3 | ND |
| B. | I-GABA | ||||||||||
|---|---|---|---|---|---|---|---|---|---|---|---|
| Control | FLZM | Ro15-1788 | BCCM | GABA | PENTO | ||||||
| Receptor | k 2 (M−1 s−1) | n | k 2 (M−1 s−1 ) | n | k 2 (M −1s−1) | n | k 2 (M−1 s−1 ) | n | k 2 (M−1 s−1 ) | n | k 2 (M −1s−1) |
| α1D97C β2 γ2 | 20.5 ± 5.7 | 6 | 9.2 ± 3.3* | 3 | # | Block | 20.6 ± 5.2 | 3 | ND | ||
| α1H101C β2 γ−;2 | 122.3 ± 10.8 | 5 | 117.2 ± 5.0 | 4 | 289.8 ± 136.8* | 5 | ND | 154.4 ± 42.6 | 5 | ND | |
| α1N102C β2 γ2 | 52.9 ± 22.1 | 8 | 32.1 ± 11.7 | 3 | # | 11.7 ± 1.0* | 3 | 81.2 ± 9.2 | 3 | 124.2 ± 47.7* | |
| α1 S106C β2 γ2 | 11.3 ± 3.9 | 7 | 12.0 ± 4.0 | 3 | 7.0 ± 1.0 | 4 | ND | 9.7 ± 5.3 | 3 | ND | |
| α1 H101C β2 | 121.4 ± 40.4 | 5 | 101.4 ± 27.7 | 3 | 145.8 ± 19.3 | 3 | ND | 166.5 ± 34.4 | 4 | ND |
A. The rates of decrease in FLZM potentiation resulting from MTSEA-Biotin application. B. The rates of change in I-GABA resulting from MTSEA-Biotin application. Data represent mean ±SD.
indicates significant differences from control rates (p < 0.05) for each receptor.
rates were not measured because Ro15-1788 potentiated I-GABA. “Block” indicates that BCCM slowed the rate of modification of α1D97C to the extent that a rate could not be accurately determined using the available MTSEA-Biotin concentrations. ND = data not determined.
Effects of GABA, Muscimol, SR-95531 and Pentobarbital on MTSEA-Biotin Reaction Rates
Since we could independently detect changes at the α/γ (BZD site) and α/β subunit interfaces by monitoring the decrease in FLZM potentiation versus the increase in I-GABA, respectively, we utilized the technique to determine if the presence of GABA alters the structure of the BZD binding site near α1H101C. By examining and comparing rates of modification of introduced cysteines in the presence of BZDs, SR-95531, GABA and pentobarbital, one can begin to tease apart movements induced by each of these ligands and elucidate differences between the conformational states stabilized by their binding. For example, since GABA and SR-95531 bind to the same site but GABA promotes channel opening/desensitization whereas the competitive antagonist, SR-99531 does not, the simplest interpretation of differences in rates is that the rate in the presence of GABA reflects motions specifically induced by GABA binding and gating the channel (stabilization of open/desensitization states) whereas the rate in the presence of SR-95531 reflects motions specifically induced by SR-95531 binding and stabilization of a closed state.
GABA (EC95) significantly increased (4-fold) the rate at which MTSEA-Biotin modifies α1H101C at the α/γ interface (detected by measuring the decrease in FLZM potentiation) suggesting that GABA binding and/or channel opening/desensitization caused movements within the BZD binding site (Figure 7, Table 3). Muscimol (a GABAAR agonist) had a similar effect (8577 +/− 994 M−1s−1, n= 3) while SR-95531 (a GABAAR antagonist) caused a significant decrease in the MTSEA-Biotin reaction rate (1439 +/− 81 M−1s−1, p< .05, n=3). To examine if the changes observed in the BZD binding site in the presence of GABA and muscimol were due to a global conformational change associated with channel gating, we examined the rate at which MTSEA-Biotin modified α1H101C in the presence of pentobarbital at a concentration that directly gates the channel. Pentobarbital had no effect on the rate of MTSEA-Biotin modification in the BZD binding site (Figure 7) even though it elicited approximately the same amount of current as ECmax GABA (84.0 ± 10.0%, data not shown). Thus, although GABA and pentobarbital both caused similar amounts of channel activation, a change in the structure of the BZD binding site near α1H101C was only detectable in the presence of ligands that occupy the GABA binding site. Similar results were seen in α1N102Cβ2γ2 receptors (Table 3). GABA had no effect on the rates of modification of α1D97Cβ2γ2 or α1S106Cβ2γ2 receptors (Table 3).
Figure 7. The effects of GABA, muscimol, pentobarbital and SR-95531 on MTSEA-Biotin second order rate constants.
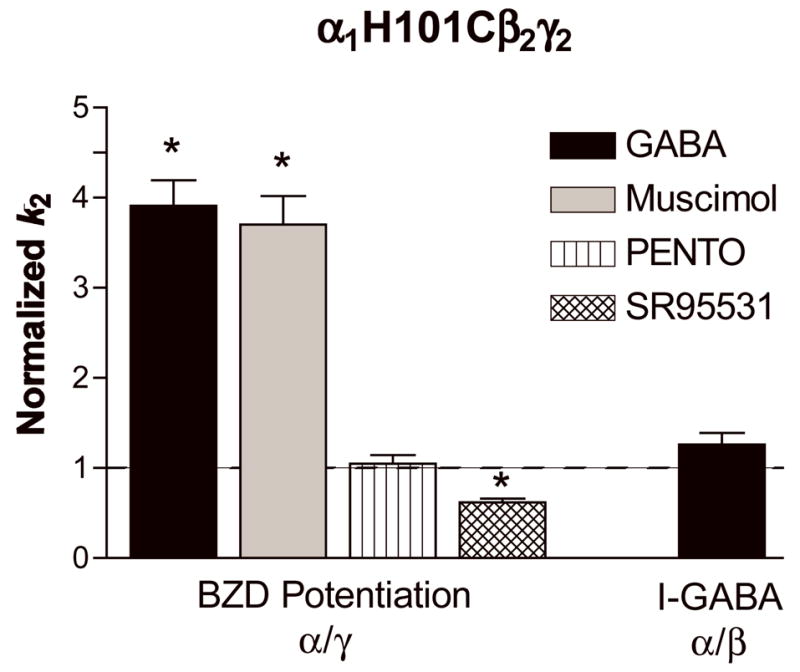
Second-order rate constants for MTSEA-Biotin modification ofα1H101C in the absence (control) and presence of GABA (EC95), muscimol (EC95), pentobarbital (PENTO, 500 μM) and SR-95531 (IC95) were measured as described in “Experimental Procedures”. Rate constants for both the decrease in BZD potentiation (α/γ) and the increase in I-GABA (α/β) were measured and normalized to the MTSEA-Biotin reaction rates measured in the absence of these ligands (control, dashed line). Data represent mean ±SD from at least 3 experiments. * Significantly different from control (p < 0.05). k2 values are shown in Table 3.
Interestingly, the presence of GABA did not alter the rate MTSEA-Biotin modified α1H101C or α1N102C located at the α/β interface (i.e. no change in the slow reaction rate associated with the increase in I-GABA; Figure 7, Table 3) whereas pentobarbital significantly increased the rate of modification of α1N102C located at the α/β interface.
Effects of BZD ligands on MTSEA-Biotin Reaction Rates
The rates at which MTSEA-Biotin modifies α1D97C, α1N102C and α1S106C are significantly slower than for α1H101C suggesting that these residues are in a less accessible/hydrophilic environment than α1H101C (Table 2). To examine if these residues line the BZD binding pocket of the receptor or change environment in response to BZD binding, we tested the effect of different BZD ligands on the rate at which MTSEA-Biotin modifies the introduced cysteines. A BZD could slow the rate of reaction at a substituted cysteine because it sterically blocks (protects) the residue from the MTS reagent suggesting that the residue is facing into the BZD binding site. Alternatively, a reduction of the reaction rate could result from ligand-induced allosteric changes in the protein structure that result in the cysteine being in a less accessible environment. We use the following criteria to identify a residue that lines the core of the BZD binding pocket: 1) when mutated to cysteine, the residue is accessible to covalent modification by MTSEA-biotin, 2) its modification decreases BZD modulation of GABA current, and 3) its rate of modification by MTSEA-biotin decreases in the presence of at least two different BZD ligands that have different functional properties (e.g. BZD agonist vs. BZD antagonist, BZD agonist vs. BZD inverse-agonist), which cause different local conformational rearrangements within the receptor. Since mutations can cause changes in BZD efficacies (Crestani et al., 2002; Dunn et al., 1999; Kelly et al., 2002; Mihic et al., 1994), for each mutation, we checked the efficacy of the BZD ligands being used in our rate experiments. This was necessary to ensure that we were testing and comparing the effects of BZD ligands that had different efficacies.
Both FLZM (BZD agonist) and Ro15-1788 (BZD antagonist) slowed MTSEA-modification of α1H101C (Figure 6, Table 3) at the α/γ interface (monitoring BZD potentiation) indicating that α1H101C faces into the BZD binding pocket. This result is consistent with results from photolabeling, mutagenesis and modeling studies (Duncalfe et al., 1996; Dunn et al., 1999; Sigel, 2002). At α1N102Cβ2γ2 receptors, BCCM (BZD antagonist with this mutation) but not FLZM (BZD agonist) slowed the rate of MTSEA-Biotin reaction at the α/γ interface (Table 3) suggesting that α1N102C likely does not face directly into the BZD binding pocket. At the α/γ interface, FLZM (BZD agonist) increased MTSEA-Biotin modification of α1S106C while Ro15-1788 (BZD antagonist) slowed its modification (Table 3) suggesting that α1S106C does not line the BZD binding pocket and that this residue may be a reporter for different structural changes that occur when a BZD agonist versus antagonist binds.
Modification of α1D97C by MTSEA-Biotin had no effect on FLZM potentiation of I-GABA but decreased I-GABA (Figure 3). For this mutation, it is unclear whether modification is occurring at both the α1/γ2 and α1/β2 interfaces. Nevertheless, if α1D97C were facing into the core of the BZD binding site, one would expect a decrease in FLZM potentiation when the residue was derivatized due to MTSEA-Biotin occlusion of the binding site. Both FLZM (BZD agonist) and BCCM (BZD antagonist) slowed the rate at which MTSEA-Biotin modification decreased I-GABA (Table 3). We speculate that occupation of the BZD binding site by either FLZM or BCCM likely induces structural rearrangements in the receptor, which allosterically decrease α1D97C accessibility.
Discussion
GABA-A receptor function is modulated by a variety of clinically important drugs including BZDs, barbiturates and neurosteroids. Structural mechanisms by which these allosteric drug modulators exert their distinct actions are unclear. Here, we developed an assay that allowed us to separately monitor the conformational state of each α1 subunit (α/γ interface, α/β interface) in the absence (resting-state) and presence of orthosteric agonists and antagonists, BZD modulators and pentobarbital. Several lines of evidence argue that the observed decreases in BZD potentiation and increases in I-GABA following MTS modification of α1H101C-containing receptors result from reaction at the BZD (α/γ) and non-binding (α/β) interfaces, respectively. At α1H101Cβ2γ2 receptors, the MTS-induced decrease in BZD potentiation occurred 18-fold faster than the I-GABA increase. As the rate of reaction at an engineered cysteine reflects the environment surrounding it, reactions at two different α1H101 mutant cysteines are likely responsible for the disparate rates. Second, BZD-site agonists protected against the decrease of BZD-potentiation but not the I-GABA increase. Finally, the presence of the gamma subunit was not necessary for the increase in I-GABA as removal of the BZD-site by expressing α1H101C with only a wild-type β2 subunit resulted in an I-GABA increase following MTS application.
When GABA is present (open/desensitized states), α1H101C and α1N102C at the BZD binding site (α/γ interface) are more accessible to modification by MTSEA-Biotin than when the receptor is in the unliganded resting-state. This result is in agreement with a study by Berezhnoy and colleagues who found that modification of H101C by a cysteine-reactive BZD was increased in the presence of GABA (Berezhnoy et al., 2005). Agonist occupation of the GABA binding site likely induces a closure of the GABA binding site cavity located at the β/α interface (Amiri et al., 2007; Jones et al., 2001; Wagner and Czajkowski, 2001). We speculate that the closure of the GABA binding site upon ligand occupation leads to a reciprocal opening of the BZD binding site at the α/γ interface, which increases the rate of α1H101C modification. This idea is consistent with radioligand binding studies that have shown that GABA binding site agonists increase the binding of BZDs (Karobath and Sperk, 1979; Tallman et al., 1978).
The GABA-site antagonist SR-95531 makes α1H101C at the BZD-site less accessible to MTS-biotin modification indicating that occupation of the GABA binding site without channel activation is sufficient to modulate the BZD binding site and that binding of GABA-site antagonists and agonists induce distinct conformational rearrangements in the BZD site near α1H101C. The results are consistent with the idea that antagonist binding to the GABA binding site induces a movement in the GABA binding site interface that causes a closure of the BZD binding site cavity. Moreover, these data demonstrate that binding of a competitive antagonist to the GABA binding site (β/α interface) induces movements in the receptor that can extend over considerable distances to the α/γ (BZD-site) interface.
Our data also demonstrate that while GABA increases the accessibility of α1H101C located at the BZD binding site it has no affect at the α/β interface. Although each α1 subunit contributes to a GABA binding site, our data suggest that GABA may cause asymmetrical structural movements in the α1 subunits, depending upon their positions in the pentamer. Recent findings support the theory of asymmetrical gating movements in cys-loop receptors (Miyazawa et al., 2003; Shen et al., 2003; Unwin et al., 2002). Shan and colleagues demonstrate that the α and β subunits in a heteromeric glycine receptor adopt structurally distinct conformations during receptor activation (Shan et al., 2003). We cannot, however, rule out the possibility that GABA causes movements at each subunit interface and that the increase in the accessibility of α1H101C can only be detected at the BZD-site due to differences in the physico-chemical environments of the two different subunit interfaces (α/γ, α/β).
At low concentrations, pentobarbital allosterically modulates the GABA-A receptor and increases the mean channel open time when GABA is bound (Steinbach and Akk, 2001; Twyman et al., 1989). At high concentrations, pentobarbital can gate the channel directly (Nicoll and Wojtowicz, 1980). We hypothesized that a directly-activating concentration of pentobarbital, which stabilizes an open-channel state that is similar to the GABA-activated state (Jackson et al., 1982; Rho et al., 1996; Steinbach and Akk, 2001) would result in similar movements in the BZD binding site as induced by GABA. To our surprise, 500μM pentobarbital did not induce movements in the BZD binding site near residues α1H101C or α1N102C, indicating that the BZD-site responds with distinct conformation changes to channel activation by different ligands. Moreover, the data suggest that GABA binding site occupation and not global receptor transitions associated with channel gating regulates BZD binding site movement near α1H101. Our data are not consistent with a recent study that reported that pentobarbital increased the rate of modification of α1H101C by a sulfhydryl-reactive BZD agonist (Berezhnoy et al., 2005). Because their sulfhydryl-reactive BZD has an affinity for the BZD binding site interpreting changes in its rates of modification of H101C are complicated. The rate also depends on its affinity for the BZD site as well as ionization of the cysteine and its affinity will change in the presence of different ligands. Thus, it is difficult to determine if the apparent increase in rate of H101C modification in the presence of PB was due to an increased affinity or due to an increase in rate of covalent reaction. Since it is known that PB increases the affinity of BZDs (Roca et al., 1990), the increase in rate would be expected and may reflect a change in the overall structure of the BZD binding site. Therefore, it is not surprising that the Berezhnoy pentobarbital results are not in agreement with our data. It is possible that pentobarbital induces movements in regions of the BZD-site not monitored in our study. The changes in rates reported in our paper reflect changes in the local environment near the engineered cysteine. Interestingly, 500μM pentobarbital induced structural rearrangements near α1N102C at the α/β interface, suggesting that the α1 subunits at different interfaces are differently modulated by pentobarbital activation of the channel, which again support the idea of asymmetrical gating movements.
Both FLZM and Ro15-1788 slowed MTSEA-modification of α1H101C (Figure 2.6, Table 2.3) at the α/γ interface. However, FLZM and Ro15-1788 differentially modulate accessibility of α1H101C at the α/β interface. While FLZM had no effect on α1H101C accessibility, Ro15-1788 significantly increased its rate of modification indicating that FLZM and Ro15-1788 do not induce identical movements and suggests that the actions of different BZDs are mediated by promoting different rearrangements in the receptor. Moreover, the data indicate that BZD binding can evoke structural movements that extend from the BZD binding site not only to the GABA binding site (Kloda and Czajkowski, 2007) but also to a non-binding site interface (α/β).
Our data suggest that α1N102 does not face into the BZD binding pocket as FLZM did not significantly slow the rate of MTSEA-Biotin reaction at the α/γ interface. However, BCCM, which acts as a BZD antagonist at α1N102Cβ2γ2 receptors does slow the rate of MTSEA-Biotin modification suggesting that α1N102C is a reporter for different structural changes triggered by BZD agonist versus antagonist binding. In a similar fashion, α1S106C may report structural changes associated with Ro15-1788 versus FLZM agonist binding. Our data, however, are not consistent with conclusions reached by Tan et. al. (Tan et al., 2007) who suggest that α1N102 faces into the BZD-site based on the ability of a cysteine-reactive derivative of Ro15-4513 to covalently react with α1N102C. It is possible that given the different structures of FNZM, BCCM and Ro15-4513, that Ro15-4513 and BCCM occupy the site differently than FLZM and that α1N102 forms part of a subsite within the BZD binding pocket that is important for BCCM and Ro15-4513 binding.
In summary, we have monitored ligand-induced movements in the GABA-A receptor at defined subunit interfaces. We demonstrate that GABA and muscimol trigger movements in the BZD binding site near α1H101 that are consistent with an opening up of the BZD binding site whereas the competitive antagonist SR-95531 stabilizes a receptor conformation that likely induces BZD binding site closure. Pentobarbital produces no conformational changes in this region of the BZD binding site. Thus, channel opening does not necessarily propagate back to the BZD binding site. We hypothesize that the GABA and BZD binding sites, which are both localized in the extracellular domain of the receptor, are physically linked such that occupation of the GABA binding site alone is sufficient to cause movements in the BZD binding site and that this linkage is part of the mechanism by which the two sites are allosterically coupled.
Nonstandard abbreviations used in the paper
- BZD
benzodiazepine
- BCCM
methyl betacarboline-3-carboxylate
- FLZM
flurazepam
- GABA
γ-aminobutyric acid
- GABA-A receptor
γ-aminobutyric acid type A receptor
- PENTO
pentobarbital
- SCAM
substituted cysteine accessibility method
- Ro15-4513
ethyl-8-azido-5,6-dihydro-5-methyl-6-oxo-4H-imidazo(1,5-alpha)(1,4)benzodiazepine-3-carboxylate
- SR95531
(gabazine) 2-(3-Carboxypropyl)-3-amino-6-(4 methoxyphenyl)pyridazinium bromide
- Ro15-1788
(flumazenil) 8-Fluoro-5,6-dihydro-5-methyl-6-oxo-4H-imidazo[1,5a] [1,4]benzodiazepine-3-carboxylic acid, ethyl ester
Footnotes
This work appears in the doctoral thesis of L.M. Sharkey: Sharkey, Lisa M. Structural elements that govern benzodiazepine modulation of the GABA-A receptor. http://www.library.wisc.edu/databases/connect/dissertations.html
Thesis (Ph.D.)-University of Wisconsin--Madison, 2004. OCLC: (OCoLC)ocm61462912
This work was previously presented in abstract form:
L.M. SHARKEY and C. Czajkowski. Evidence that the Two α1 Subunit Interfaces (α/γ and α/β) of the GABAA Receptor are Structurally Different and Play Different Roles in Receptor Function. Society for Neuroscience Abstracts (Orlando, FL)
Financial support: This work was supported by NIH - National Institute of Neurological Disorders and Stroke NS 34727 (C.C.).
References
- Amiri S, Sansom MS, Biggin PC. Molecular dynamics studies of AChBP with nicotine and carbamylcholine: the role of water in the binding pocket. Protein Eng Des Sel. 2007;20(7):353–359. doi: 10.1093/protein/gzm029. [DOI] [PubMed] [Google Scholar]
- Berezhnoy D, Baur R, Gonthier A, Foucaud B, Goeldner M, Sigel E. Conformational changes at benzodiazepine binding sites of GABAA receptors detected with a novel technique. J Neurochem. 2005;92(4):859–866. doi: 10.1111/j.1471-4159.2004.02913.x. [DOI] [PubMed] [Google Scholar]
- Boileau AJ, Czajkowski C. Identification of transduction elements for benzodiazepine modulation of the GABAA receptor: three residues are required for allosteric coupling. J Neurosci. 1999;19(23):10213–10220. doi: 10.1523/JNEUROSCI.19-23-10213.1999. [DOI] [PMC free article] [PubMed] [Google Scholar]
- Boileau AJ, Evers AR, Davis AF, Czajkowski C. Mapping the agonist binding site of the GABAA receptor: evidence for a beta-strand. J Neurosci. 1999;19(12):4847–4854. doi: 10.1523/JNEUROSCI.19-12-04847.1999. [DOI] [PMC free article] [PubMed] [Google Scholar]
- Boileau AJ, Kucken AM, Evers AR, Czajkowski C. Molecular dissection of benzodiazepine binding and allosteric coupling using chimeric gamma-aminobutyric acidA receptor subunits. Mol Pharmacol. 1998;53(2):295–303. doi: 10.1124/mol.53.2.295. [DOI] [PubMed] [Google Scholar]
- Boileau AJ, Newell JG, Czajkowski C. GABAA receptor beta 2 Tyr97 and Leu99 line the GABA-binding site. Insights into mechanisms of agonist and antagonist actions. J Biol Chem. 2002;277(4):2931–2937. doi: 10.1074/jbc.M109334200. [DOI] [PubMed] [Google Scholar]
- Braestrup C, Schmiechen R, Neef G, Nielsen M, Petersen EN. Interaction of convulsive ligands with benzodiazepine receptors. Science. 1982;216(4551):1241–1243. doi: 10.1126/science.6281892. [DOI] [PubMed] [Google Scholar]
- Choi DW, Farb DH, Fischbach GD. Chlordiazepoxide selectively potentiates GABA conductance of spinal cord and sensory neurons in cell culture. J Neurophysiol. 1981;45(4):621–631. doi: 10.1152/jn.1981.45.4.621. [DOI] [PubMed] [Google Scholar]
- Crestani F, Assandri R, Tauber M, Martin JR, Rudolph U. Contribution of the alpha1-GABAA receptor subtype to the pharmacological actions of benzodiazepine site inverse agonists. Neuropharmacology. 2002;43(4):679–684. doi: 10.1016/s0028-3908(02)00159-4. [DOI] [PubMed] [Google Scholar]
- Doble A, Martin IL. The GABAA/benzodiazepine receptor as a target for psychoactive drugs. R.G. Landes; Austin: 1996. [Google Scholar]
- Duncalfe LL, Carpenter MR, Smillie LB, Martin IL, Dunn SM. The major site of photoaffinity labeling of the gamma-aminobutyric acid type A receptor by [3H]flunitrazepam is histidine 102 of the alpha subunit. J Biol Chem. 1996;271(16):9209–9214. doi: 10.1074/jbc.271.16.9209. [DOI] [PubMed] [Google Scholar]
- Dunn SM, Davies M, Muntoni AL, Lambert JJ. Mutagenesis of the rat alpha1 subunit of the gamma-aminobutyric acidA receptor reveals the importance of residue 101 in determining the allosteric effects of benzodiazepine site ligands. Mol Pharmacol. 1999;56(4):768–774. [PubMed] [Google Scholar]
- Hattori K, Oomura Y, Akaike N. Diazepam action on gamma-aminobutyric acid-activated chloride currents in internally perfused frog sensory neurons. Cell Mol Neurobiol. 1986;6(3):307–323. doi: 10.1007/BF00711116. [DOI] [PMC free article] [PubMed] [Google Scholar]
- Hevers W, Luddens H. The diversity of GABAA receptors. Pharmacological and electrophysiological properties of GABAA channel subtypes. Mol Neurobiol. 1998;18(1):35–86. doi: 10.1007/BF02741459. [DOI] [PubMed] [Google Scholar]
- Jackson MB, Lecar H, Mathers DA, Barker JL. Single channel currents activated by gamma-aminobutyric acid, muscimol, and (-)-pentobarbital in cultured mouse spinal neurons. J Neurosci. 1982;2(7):889–894. doi: 10.1523/JNEUROSCI.02-07-00889.1982. [DOI] [PMC free article] [PubMed] [Google Scholar]
- Jones MV, Jonas P, Sahara Y, Westbrook GL. Microscopic kinetics and energetics distinguish GABAA receptor agonists from antagonists. Biophysical journal. 2001;81(5):2660–2670. doi: 10.1016/S0006-3495(01)75909-7. [DOI] [PMC free article] [PubMed] [Google Scholar]
- Karobath M, Sperk G. Stimulation of benzodiazepine receptor binding by gamma-aminobutyric acid. Proceedings of the National Academy of Sciences of the United States of America. 1979;76(2):1004–1006. doi: 10.1073/pnas.76.2.1004. [DOI] [PMC free article] [PubMed] [Google Scholar]
- Kelly MD, Smith A, Banks G, Wingrove P, Whiting PW, Atack J, Seabrook GR, Maubach KA. Role of the histidine residue at position 105 in the human alpha 5 containing GABAA receptor on the affinity and efficacy of benzodiazepine site ligands. British journal of pharmacology. 2002;135(1):248–256. doi: 10.1038/sj.bjp.0704459. [DOI] [PMC free article] [PubMed] [Google Scholar]
- Kloda JH, Czajkowski C. Agonist-, antagonist-, and benzodiazepine-induced structural changes in the alpha1 Met113-Leu132 region of the GABAA receptor. Molecular pharmacology. 2007;71(2):483–493. doi: 10.1124/mol.106.028662. [DOI] [PubMed] [Google Scholar]
- Kucken AM, Wagner DA, Ward PR, Teissere JA, Boileau AJ, Czajkowski C. Identification of benzodiazepine binding site residues in the gamma2 subunit of the gamma-aminobutyric acid(A) receptor. Mol Pharmacol. 2000;57(5):932–939. [PubMed] [Google Scholar]
- Liman ER, Tytgat J, Hess P. Subunit stoichiometry of a mammalian K+ channel determined by construction of multimeric cDNAs. Neuron. 1992;9(5):861–871. doi: 10.1016/0896-6273(92)90239-a. [DOI] [PubMed] [Google Scholar]
- Macdonald R, Barker JL. Benzodiazepines specifically modulate GABA-mediated postsynaptic inhibition in cultured mammalian neurones. Nature. 1978;271(5645):563–564. doi: 10.1038/271563a0. [DOI] [PubMed] [Google Scholar]
- Macdonald RL, Twyman RE, Ryan-Jastrow T, Angelotti TP. Regulation of GABAA receptor channels by anticonvulsant and convulsant drugs and by phosphorylation. Epilepsy Res Suppl. 1992;9:265–277. [PubMed] [Google Scholar]
- McKernan RM, Whiting PJ. Which GABAA-receptor subtypes really occur in the brain? [see comments] Trends Neurosci. 1996;19(4):139–143. doi: 10.1016/s0166-2236(96)80023-3. [DOI] [PubMed] [Google Scholar]
- Mihic SJ, Whiting PJ, Klein RL, Wafford KA, Harris RA. A single amino acid of the human gamma-aminobutyric acid type A receptor gamma 2 subunit determines benzodiazepine efficacy. The Journal of biological chemistry. 1994;269(52):32768–32773. [PubMed] [Google Scholar]
- Miyazawa A, Fujiyoshi Y, Unwin N. Structure and gating mechanism of the acetylcholine receptor pore. Nature. 2003;423(6943):949–955. doi: 10.1038/nature01748. [DOI] [PubMed] [Google Scholar]
- Nicoll RA, Wojtowicz JM. The effects of pentobarbital and related compounds on frog motoneurons. Brain Res. 1980;191(1):225–237. doi: 10.1016/0006-8993(80)90325-x. [DOI] [PubMed] [Google Scholar]
- Oakley NR, Jones BJ. The proconvulsant and diazepam-reversing effects of ethyl-beta-carboline-3-carboxylate. Eur J Pharmacol. 1980;68(3):381–382. doi: 10.1016/0014-2999(80)90538-5. [DOI] [PubMed] [Google Scholar]
- Olsen RW, Snowman AM. Chloride-dependent enhancement by barbiturates of gamma-aminobutyric acid receptor binding. J Neurosci. 1982;2(12):1812–1823. doi: 10.1523/JNEUROSCI.02-12-01812.1982. [DOI] [PMC free article] [PubMed] [Google Scholar]
- Ortells MO, Lunt GG. Evolutionary history of the ligand-gated ion-channel superfamily of receptors [see comments] Trends Neurosci. 1995;18(3):121–127. doi: 10.1016/0166-2236(95)93887-4. [DOI] [PubMed] [Google Scholar]
- Rho JM, Donevan SD, Rogawski MA. Direct activation of GABAA receptors by barbiturates in cultured rat hippocampal neurons. J Physiol (Lond) 1996;497(Pt 2):509–522. doi: 10.1113/jphysiol.1996.sp021784. [DOI] [PMC free article] [PubMed] [Google Scholar]
- Robertson GA, Warmke JM, Ganetzky B. Potassium currents expressed from Drosophila and mouse eag cDNAs in Xenopus oocytes. Neuropharmacology. 1996;35(7):841–850. doi: 10.1016/0028-3908(96)00113-x. [DOI] [PubMed] [Google Scholar]
- Rogers CJ, Twyman RE, Macdonald RL. Benzodiazepine and beta-carboline regulation of single GABAA receptor channels of mouse spinal neurones in culture. J Physiol. 1994;475(1):69–82. doi: 10.1113/jphysiol.1994.sp020050. [DOI] [PMC free article] [PubMed] [Google Scholar]
- Rudolph U, Crestani F, Mohler H. GABAA receptor subtypes: dissecting their pharmacological functions. Trends Pharmacol Sci. 2001;22(4):188–194. doi: 10.1016/s0165-6147(00)01646-1. [DOI] [PubMed] [Google Scholar]
- Rudolph U, Mohler H. Analysis of GABAA receptor function and dissection of the pharmacology of benzodiazepines and general anesthetics through mouse genetics. Annu Rev Pharmacol Toxicol. 2004;44:475–498. doi: 10.1146/annurev.pharmtox.44.101802.121429. [DOI] [PubMed] [Google Scholar]
- Shan Q, Nevin ST, Haddrill JL, Lynch JW. Asymmetric contribution of alpha and beta subunits to the activation of alphabeta heteromeric glycine receptors. J Neurochem. 2003;86(2):498–507. doi: 10.1046/j.1471-4159.2003.01872.x. [DOI] [PubMed] [Google Scholar]
- Shen XM, Ohno K, Tsujino A, Brengman JM, Gingold M, Sine SM, Engel AG. Mutation causing severe myasthenia reveals functional asymmetry of AChR signature cystine loops in agonist binding and gating. J Clin Invest. 2003;111(4):497–505. doi: 10.1172/JCI16997. [DOI] [PMC free article] [PubMed] [Google Scholar]
- Sieghart W. Structure, pharmacology, and function of GABAA receptor subtypes. Adv Pharmacol. 2006;54:231–263. doi: 10.1016/s1054-3589(06)54010-4. [DOI] [PubMed] [Google Scholar]
- Sigel E. Mapping of the benzodiazepine recognition site on GABAA receptors. Curr Top Med Chem. 2002;2(8):833–839. doi: 10.2174/1568026023393444. [DOI] [PubMed] [Google Scholar]
- Steinbach JH, Akk G. Modulation of GABAA receptor channel gating by pentobarbital. J Physiol. 2001;537(Pt 3):715–733. doi: 10.1111/j.1469-7793.2001.00715.x. [DOI] [PMC free article] [PubMed] [Google Scholar]
- Sullivan DA, Cohen JB. Mapping the agonist binding site of the nicotinic acetylcholine receptor. Orientation requirements for activation by covalent agonist. J Biol Chem. 2000;275(17):12651–12660. doi: 10.1074/jbc.275.17.12651. [DOI] [PubMed] [Google Scholar]
- Tallman JF, Thomas JW, Gallager DW. GABAergic modulation of benzodiazepine binding site sensitivity. Nature. 1978;274(5669):383–385. doi: 10.1038/274383a0. [DOI] [PubMed] [Google Scholar]
- Tan KR, Baur R, Gonthier A, Goeldner M, Sigel E. Two neighboring residues of loop A of the alpha(1) subunit point towards the benzodiazepine binding site of GABAA receptors. FEBS letters. 2007 doi: 10.1016/j.febslet.2007.08.068. [DOI] [PubMed] [Google Scholar]
- Twyman RE, Rogers CJ, Macdonald RL. Pentobarbital and picrotoxin have reciprocal actions on single GABAA receptor channels. Neurosci Lett. 1989;96(1):89–95. doi: 10.1016/0304-3940(89)90248-6. [DOI] [PubMed] [Google Scholar]
- Unwin N, Miyazawa A, Li J, Fujiyoshi Y. Activation of the nicotinic acetylcholine receptor involves a switch in conformation of the alpha subunits. J Mol Biol. 2002;319(5):1165–1176. doi: 10.1016/S0022-2836(02)00381-9. [DOI] [PubMed] [Google Scholar]
- Wagner DA, Czajkowski C. Structure and dynamics of the GABA binding pocket: A narrowing cleft that constricts during activation. J Neurosci. 2001;21(1):67–74. doi: 10.1523/JNEUROSCI.21-01-00067.2001. [DOI] [PMC free article] [PubMed] [Google Scholar]