Abstract
Lipid A of Rhizobium etli CE3 differs dramatically from that of other Gram-negative bacteria. Key features include the presence of an unusual C28 acyl chain, a galacturonic acid moiety at position 4′, and an acylated aminogluconate unit in place of the proximal glucosamine. In addition, R. etli lipid A is reported to lack phosphate and acyloxyacyl residues. Most of these remarkable structural claims are consistent with our recent enzymatic studies. However, the proposed R. etli lipid A structure is inconsistent with the ability of the precursor (3-deoxy-D-manno-octulosonic acid)2-4′-32P-lipid IVA to accept a C28 chain in vitro (Brozek, K. A., Carlson, R. W., and Raetz, C. R. H. (1996) J. Biol. Chem. 271, 32126–32136). To re-evaluate the structure, CE3 lipid A was isolated by new chromatographic procedures. CE3 lipid A is now resolved into six related components. Aminogluconate is present in D-1, D-2, and E, whereas B and C contain the typical glucosamine disaccharide seen in lipid A of most other bacteria. All the components possess a peculiar acyloxyacyl moiety at position 2′, which includes the ester-linked C28 chain. As judged by mass spectrometry, the distal glucosamine units of A through E are the same, but the proximal units are variable. As described in the accompanying article (Que, N. L. S., Ribeiro, A. A., and Raetz, C. R. H. (2000) J. Biol. Chem. 275, 28017–28027), the discovery of component B suggests a plausible enzymatic pathway for the biosynthesis of the aminogluconate residue found in species D-1, D-2, and E of R. etli lipid A. We suggest that the unusual lipid A species of R. etli might be essential during symbiosis with leguminous host plants.
Gram-negative bacteria possess outer membranes consisting of a lipid bilayer in which the outer leaflet is composed largely of lipopolysaccharide (LPS)1 (1–7). The structure of LPS can be divided into three regions: 1) the lipid A moiety, which serves as the hydrophobic anchor of LPS in the outer membrane; 2) the core region, which consists of a nonrepeating oligosaccharide; and 3) the immunogenic O-antigen, a distinctly different but repeating oligosaccharide. Although the core region confers upon the outer membrane the capacity to act as an effective barrier to many antibiotics (8, 9), the lipid A moiety is needed for cell viability (10–14). Furthermore, lipid A is the portion of LPS that elicits many of the diverse pathophysiological responses associated with severe Gram-negative infections of animals, such as cytokine production, inflammation, and shock (1, 4, 6, 15–17).
The lipid A moiety found in typical Gram-negative bacteria, like Escherichia coli, consists of a hexa-acylated disaccharide of glucosamine that is β, 1′-6 linked and is phosphorylated at positions 1 and 4′ (see Fig. 1) (1, 4, 6, 17). Most variations on this structural theme are relatively modest. For instance, the fatty acyl chain lengths and/or the number of secondary acyl chains may differ from strain to strain (1, 4, 17). However, five acyl chains (including one acyloxyacyl moiety) are usually present (1, 4, 17). In bacteria that normally contain two secondary acyl chains, the absence of one of these moieties, as in lipid A of E. coli or Salmonella typhimurium msbB mutants (18–21), does not inhibit growth, but the mutant bacteria lose their capacity to induce robust cytokine synthesis in animals (22, 23). In fact, S. typhimurium msbB mutants are unable to kill mice, despite rapid proliferation in the infected animals (22, 23).
Fig. 1. Structure of E. coli lipid A compared with the previously published structure of R. etli CE3 lipid A.
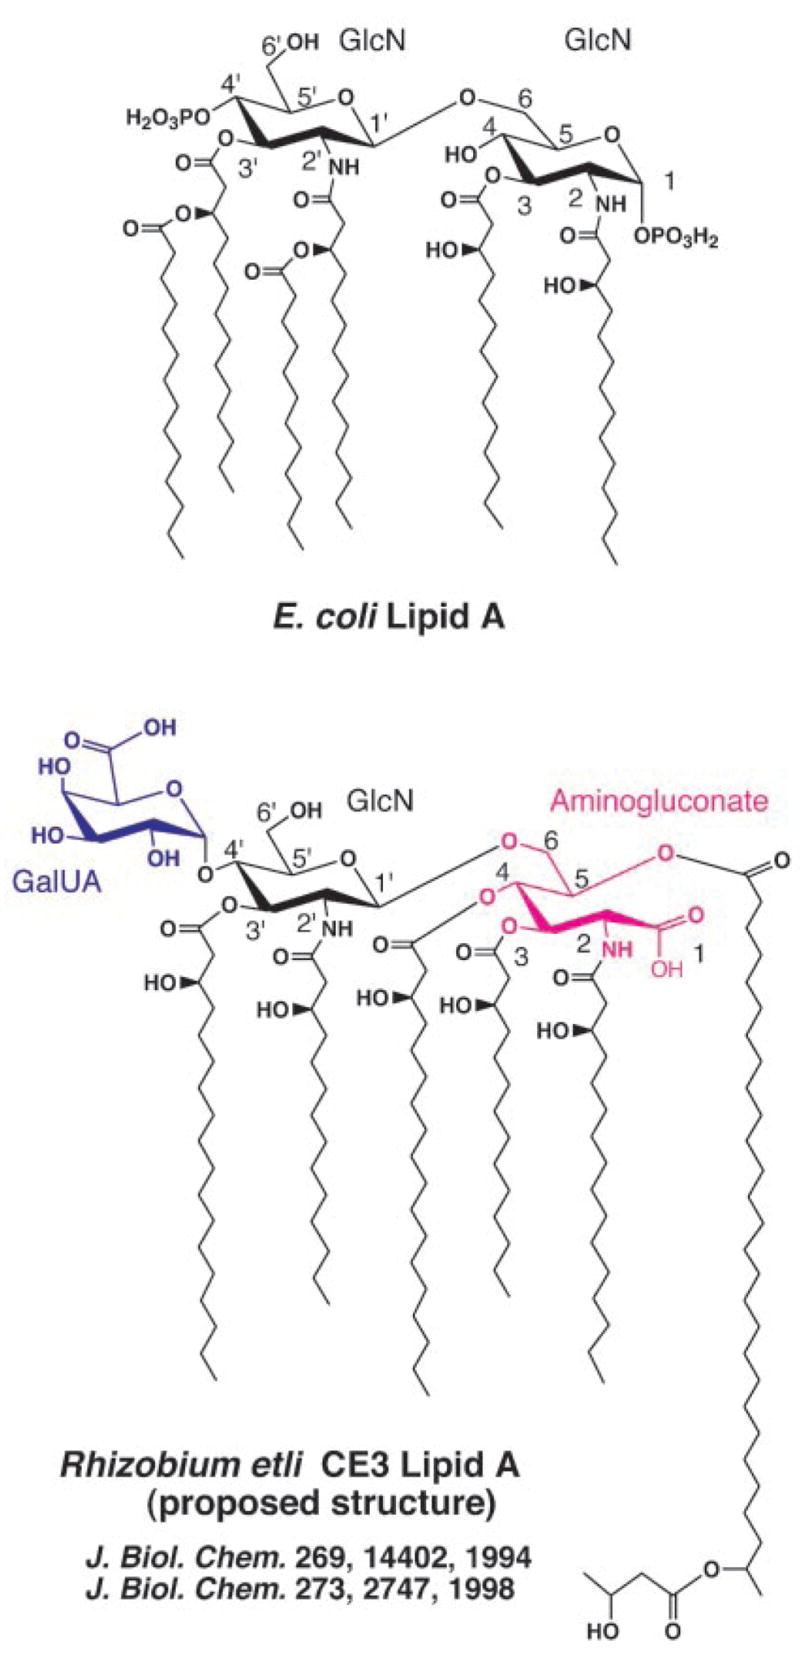
The backbone carbons are numbered on the assumption that the proximal aminogluconate moiety of R. etli lipid A is derived from a lipid A precursor common to both systems, such as Kdo2-lipid IVA, in which the proximal unit is not an aminogluconate moiety but glucosamine. The molecular weight of E. coli lipid A is 1798.8, whereas that of the previously proposed (33, 34) R. etli CE3 lipid A species shown above is predicted to be 2313.31.
Under certain growth conditions, both the 1- and 4′-phosphates of E. coli and S. typhimurium lipid A may be further modified with polar moieties, such as 4-amino-4-deoxy-L-arabinose or phosphoethanolamine (24–29). The presence of these additional substituents is implicated in conferring polymyxin resistance and may be required for the intracellular survival of S. typhimurium (30–32). These observations (22, 23, 30–32) demonstrate that subtle changes in the structure of lipid A may have profound effects on pathogenesis.
The most remarkable lipid A structure reported to date is that of Rhizobium etli CE3 (see Fig. 1), a bacterial endosymbiont that differentiates to form nitrogen-fixing bacteroids in the root cells of bean plants (33, 34). R. etli lipid A not only is missing both phosphate groups, but also is reported to lack an acyloxyacyl moiety (see Fig. 1) (33, 34). The 4′ position (see Fig. 1) is substituted with a galacturonic acid residue, whereas the proximal glucosamine unit is replaced with an aminogluconate moiety (33, 34). A long fatty acid (27-hydroxyoctacosanoic acid), characteristic of the Rhizobiaceae (35), is proposed to be attached to the aminogluconate residue by an ester linkage at C-5 (see Fig. 1) (33, 34). The 27-OH group is further acylated with a β-hydroxybutyrate residue (33, 34). Given that the O-antigen region of R. etli and Rhizobium leguminosarum LPS is necessary for normal maturation of nitrogen-fixing bacteroids (36–38), the unusual lipid A of R. etli might somehow also be required for infection of plant cells and/or symbiosis.
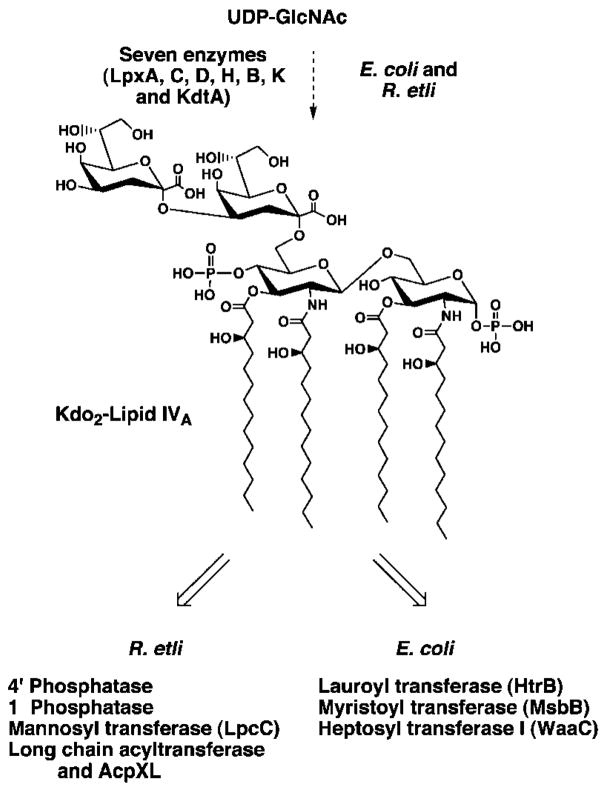
Enzymatic studies from our laboratory are largely consistent with the proposed structure of R. etli lipid A (39–43). R. etli initiates the biosynthesis of lipid A with UDP-N-acetylglucosamine and hydroxyacyl-ACP (see Fig. 2), as does E. coli (39). After formation of the key intermediate Kdo2-lipid IVA (39), R. etli then employs unique enzymes, such as its 4′- and 1-phosphatases (40, 41), to generate its own unusual lipid A precursors (see Fig. 2). A special acyl carrier protein and a unique membrane enzyme for transferring 27-hydroxyoctacosanoic acid to Kdo2-lipid IVA have also recently been discovered (see Fig. 2) (42). Interestingly, the latter system is not consistent with the proposed R. etli lipid A structure (see Fig. 1), because the 5 position of the proximal unit is not available to accept the 27-hydroxyoctacosanoate residue in the substrate Kdo2-lipid IVA (see Fig. 2) (42). The C28 acyltransferase of R. etli further-more resembles the HtrB acyltransferase of E. coli, which generates the acyloxyacyl residue at position 2′ (Figs. 1 and 2), in its strict dependence upon the presence of the Kdo disaccharide in the substrate (42). The issue of whether or not R. etli lipid A might contain an acyloxyacyl unit involving the C28 chain (33, 42) therefore needed to be reinvestigated.
Fig. 2. Structure of the conserved intermediate Kdo2-lipid IVA and its enzymatic processing in extracts of R. etli versus E. coli.
The key known enzymatic steps in the processing of Kdo2-lipid IVA in extracts of R. etli versus E. coli are indicated. The E. coli extracts do not contain the enzymes unique to R. etli that act on Kdo2-lipid IVA and vice versa.
We now demonstrate that lipid A of R. etli LPS is in fact much more complex than previously reported (33, 34). Several new chromatographic methods for the purification and separation of R. etli lipid A were developed (44), permitting the identification of at least six distinct but related lipid A species. In contrast to previous studies (33, 34), we obtained these R. etli lipid A fractions without resorting to strong acid or base hydrolysis, thereby greatly facilitating the analysis of the intact species by MALDI/TOF mass spectrometry, NMR spectroscopy, and GC/MS. With this information, we were able to deduce logical structural skeletons for these molecules. All six purified components possess the same distal ends but are intriguingly heterogeneous in their proximal units. Some of the purified species contain the novel aminogluconate residue (33, 34), but others consist of a more conventional glucosamine disaccharide backbone. Evidence is presented for a single acyloxyacyl group in the distal unit of each of the six components. The secondary fatty acyl chain of this acyloxyacyl residue is the 27-hydroxyoctacosanoate moiety. Our revised structures are consistent with previous enzymatic studies of Kdo2-lipid IVA acylation in R. etli extracts (42). The accompanying article (73) presents an in depth NMR analysis of the purified substances.
EXPERIMENTAL PROCEDURES
Materials
Glass backed 0.25-mm Silica Gel 60 thin layer chromatography plates were obtained from Merck. Chloroform, ammonium acetate and sodium acetate were purchased from EM Science, whereas pyridine, methanol, and 88% formic acid were from Mallinckrodt. The 2,5-dihydroxybenzoic acid was purchased from Sigma.
Bacterial Cells and Growth Conditions
Cells of R. etli CE3 were grown in shaking culture at 30 °C in TY broth (5 g of Bacto-peptone and 3 g of yeast extract), supplemented with 10 CaCl2, 20 μ mMg/ml nalidixic acid, and 200 μg/ml streptomycin sulfate (39, 40).
Cell Preparation and Recovery of Crude Lipid A
Five liters of fresh TY broth (1000 ml/4-liter Erlenmeyer flask), supplemented with 10 mM CaCl2, 20μg/ml nalidixic acid, and 200 μg/ml streptomycin sulfate, were inoculated with 25 ml of a fresh culture of R. etli CE3 (A550 ≅1.2). The flasks were shaken (225 rpm) at 30 °C overnight until the A550 reached 1.2. The cells were harvested by centrifugation at 5000 × g for 15 min at 4 °C. The cells were resuspended, washed once with 900 ml of chilled 50 mM HEPES buffer, pH 7.5, and centrifuged once more. The washed cell pellets were frozen at −80 °C.
Thawed cell pellets were resuspended in 320 ml of phosphate-buffered saline, pH 7.4. To extract the glycerophospholipids, the cell suspension was converted to a single phase Bligh-Dyer mixture by the addition of 400 ml of chloroform and 800 ml of methanol. After incubation for 1 h at room temperature with occasional stirring, the mixture was centrifuged at 7520 × g, for 15 min. The insoluble material was recovered and washed once with 380 ml of a fresh, single phase Bligh-Dyer mixture, consisting of CHCl3/MeOH/H2O (1:2:0.8 v/v/v). The insoluble material was again recovered by centrifugation, and the supernatant was discarded. The washed pellet, which contains the LPS with its covalently bound lipid A moiety, was then suspended in a 120-ml portion of 12.5 mM sodium acetate, pH 4.5, containing 1% SDS. Dispersion was facilitated by a brief sonic irradiation in a Virsonic cell disrupter. The volume was then adjusted to 360 ml with 12.5 mM sodium acetate, pH 4.5, containing 1% SDS. At this point, the pH was readjusted to 4.5 by careful dropwise addition of glacial acetic acid. The suspension was divided between two 500-ml glass bottles covered with loose caps. The glycosidic bond between the inner Kdo of the core and the lipid A moiety was cleaved by heating the suspension to 100 °C in a boiling water bath for 30 min (29, 45–49). After cooling, the suspension was divided into ten 36-ml aliquots, each of which was placed into a 150-ml Corex glass tube. The contents of each tube were converted to a two-phase Bligh-Dyer mixture (50) by addition of 40 ml of chloroform and 40 ml of methanol. The phases were mixed thoroughly and were separated by centrifugation at 7520 × g for 15 min at 25 °C. The lower phases, containing the released lipid A, were combined and passed through a funnel plugged with glass wool to remove insoluble cell debris. A second extraction of the remaining upper phases was done by adding to each tube 40 ml of a pre-equilibrated lower phase, which was obtained from a fresh two-phase Bligh-Dyer mixture, consisting of CHCl3/MeOH/H2O (2:2:1.8 v/v/v). These mixtures were again centrifuged to separate the phases (as above), and the lower phases from the second extraction were filtered and pooled with the lower phases from the first extraction.
After drying the pooled lower phases by rotary evaporation in a 500-ml round bottom flask at room temperature, another two-phase partitioning was carried out to reduce the amount of SDS in the sample. The dried material was redissolved in 240 ml of chloroform/methanol (1:1 v/v) and was then equally divided between six 150-ml Corex glass bottles. The round bottom flask was rinsed with a second 240-ml solution of chloroform/methanol (1:1 v/v), and the contents were equally distributed between the six Corex bottles. The portion in each Corex bottle was then converted to a two-phase Bligh-Dyer system by adding 36 ml of water. The phases were mixed thoroughly and separated by centrifugation at 7520 × g for 15 min at room temperature. The lower phases were recovered and filtered as above. The filtrate was collected in a 500-ml round bottom flask, dried by rotary evaporation, sealed, and stored at −20 °C. About 160 mg of crude lipid A (contaminated with SDS and residual glycerophospholipids) was obtained.
Resolution of Multiple R. etli Lipid A Species by Ion Exchange Chromatography
The first step in the purification of the lipid A species of R. etli CE3 made use of anion exchange (DEAE-cellulose) chromatography, as described previously for E. coli lipid A (25, 29, 48, 51). A 60-ml DEAE-cellulose (Whatman DE52) column (2.5 × 13 cm) in the acetate form (25, 51) was equilibrated with the solvent CHCl3/MeOH/H2O (2:3:1 v/v/v). The entire crude lipid A sample, prepared as described above, was dissolved in 100 ml of CHCl3/MeOH/H2O (2:3:1 v/v/v) and loaded onto the column by gravity flow. The same solvent mixture (10 ml) was used to rinse the flask, and the additional material was also loaded onto the column. The run-through was collected as a single fraction. Next, the column was washed with 80 ml of CHCl3/MeOH/H2O (2:3:1 v/v/v), also collected as a single fraction. The various lipid A components were then eluted by increasing the salt concentration of the aqueous portion stepwise in the following manner: 1) 240 ml of CHCl3/MeOH/30 mM NH4Ac (2:3:1 v/v/v); 2) 180 ml of CHCl3/MeOH/60 mM NH4Ac (2:3:1 v/v/v); 3) 180 ml of CHCl3/MeOH/120 mM NH4Ac (2:3:1 v/v/v); and 4) 180 ml of CHCl3/MeOH/500 mM NH4Ac (2:3:1 v/v/v). Fractions of 14 ml were collected, and 20-μl portions of each fraction were spotted onto 10 × 20-cm Silica Gel 60 TLC plates to monitor the lipid A elution profile. The plates were then developed in the solvent CHCl3/MeOH/H2O/NH4OH (40:25:4:2 v/v/v/v). Spots were visualized by spraying the chromatogram with ethanol/p-anisaldehyde/H2SO4/HOAc (89:2.5:4:1 v/v/v/v) or with 10% sulfuric acid in ethanol, followed by charring on a hot plate. Two sets of lipid A-related components were resolved. Three components (designated A, B, and C) eluted with CHCl3/MeOH/30 mM NH4Ac (2:3:1 v/v/v). The second set of compounds (D-1, D-2, and E) emerged with CHCl3/MeOH/120 mM NH4Ac (2:3:1 v/v/v). Fractions containing these components were converted to two-phase Bligh-Dyer mixtures by addition of the appropriate amounts of chloroform and water. After mixing, the phases were separated by centrifugation at 7520 × g at room temperature for 15 min. The lower phases from the fractions of the 30 mM NH4Ac elution step (which contain A, B and C) were pooled and dried by rotary evaporation. Fractions from the 120 mM NH4Ac elution step (components D-1, D-2, and E) were processed in the same manner. After drying, all the samples were stored at −20 °C (~20 mg of combined weight).
Purification and Separation of A, B, and C
Component C was separated from A and B by chromatography on a Bio-Sil column. The dried mixture of A, B, and C from the DEAE-cellulose step was dissolved in 9.5 ml of CHCl3:MeOH (95:5 v/v) and was loaded onto an 18-ml acid-washed Bio-Sil column (8.5 × 2 cm) that had been pre-equilibrated in 250 ml of CHCl3:MeOH (95:5 v/v). The column was then washed stepwise with solvents of increasing polarity, and fractions were collected as follows: 1) 160 ml of CHCl3:MeOH (95:5 v/v) in 14-ml fractions; 2) 80 ml of CHCl3:MeOH (90:10 v/v) in 8-ml fractions; 3) 240 ml of CHCl3:MeOH (85:15 v/v) in 4-ml fractions; and 4) 90 ml of CHCl3:MeOH (2:1 v/v) in 4-ml fractions. To detect the lipid A, 10–20-μl portions of each fraction were spotted onto silica gel TLC plates and analyzed by chromatography and charring, as described above for the DEAE-cellulose step. Components A and B eluted with CHCl3/MeOH (95:5 v/v and 90:10 v/v) but were not resolved from each other. Component C started to elute only in the CHCl3/MeOH (85:15 v/v) step. Fractions containing species A and B were pooled and dried by rotary evaporation. The same was done for the fractions containing C.
To resolve components A and B from each other, preparative thin layer chromatography was employed (29). Fractions from the silica column containing A and B were redissolved in ~0.5 ml of CHCl3/MeOH (4:1 v/v), and a 0.5-mg sample was applied in a line to a 20 × 20-cm Silica Gel 60 analytical TLC plate (0.25-mm thickness). A solvent composed of chloroform/pyridine/88% formic acid/MeOH/H2O (60:35:10:5:2 v/v/v/v/v) was used for chromatography. Care was taken to load just enough of the sample per plate (0.2–0.5 mg) so that after the chromatogram was developed and dried, the locations of the discrete lipid A bands on the plate were transiently visible as white zones when viewed on a light box. After developing, the bands were marked with a pencil, and the plates were allowed to dry completely at room temperature for 30 min before the marked zones were scraped off with a clean razor blade. Each compound was then extracted from the silica chips with 3.8 ml of an acidic single-phase Bligh-Dyer mixture, consisting of CHCl3/MeOH/0.1 M HCl (1:2:0.8 v/v/v). After mixing, the suspension was left at room temperature for 5 min. The suspension was then converted into a two-phase Bligh-Dyer system by adding 2 ml of CHCl3, 1 ml of methanol, and 1.9 ml of water. The system was mixed, and the two phases were separated by centrifugation for 8 min at room temperature in a clinical centrifuge. The lower phase was recovered, passed through a Pasteur pipette fitted with a small glass wool plug, and collected in a 16 × 125-mm glass tube. The remaining upper phase was re-extracted with 3 ml of a pre-equilibrated lower phase derived from a fresh neutral Bligh and Dyer mixture, consisting of CHCl3/MeOH/H2O (2:2:1.8 v/v/v). The lower phases from the two extractions were pooled and dried down under a stream of N2. Finally, the individual TLC-purified samples were passed through another 1-ml DEAE-cellulose column (29), equilibrated, and eluted on a scale proportionally smaller than that described above, to remove residual silica chips and other possible contaminants, such as metal ions. The purified components were stored dry at −20 °C.
Purification and Separation of D-1, D-2, and E
Components D-1, D-2, and E, which elute together during the anion exchange step, were resolved by preparative thin layer chromatography using the solvent chloroform/pyridine/88% formic acid/MeOH/H2O (60:35:10:5:2 v/v/v/v/v). Chromatography and elution from the silica chips was carried out as described above for A and B. Passage over a final 1-ml DEAE-cellulose column was also carried out, as described above for A and B, and all the purified lipid A samples were stored dry at −20 °C.
Mass Spectrometry
Matrix-assisted laser desorption ionization/time of flight (MALDI/TOF) mass spectra were acquired on a Kompact MALDI 4 from Kratos Analytical (Manchester, UK) equipped with a nitrogen laser (337 nm), 20 kV extraction voltage, and time delayed extraction. The samples were prepared for MALDI/TOF analysis by depositing 0.3 μl of the sample dissolved in chloroform/methanol (4:1 v/v), followed by 0.3 μl of a saturated solution of 2,5-dihydroxybenzoic acid in 50% acetonitrile as the matrix. The sample was left to dry at room temperature. Spectra were acquired in both the positive and negative ion linear modes. Each spectrum was the average of 50 laser shots.
GC/MS Analysis of the Purified Components A, B, and D-1
The purified lipid A components were hydrolyzed in acidic methanol, N-acetylated, and then converted to trimethylsilyl ethers, without reduction of the carboxyl groups of the acidic sugars or fatty acids present in the samples (52). In separate 1-ml Reacti-vials (Pierce) equipped with Teflon-lined screw caps, 0.3–0.5 mg of A, B, and D-1 were thoroughly dried on a lyophilizer. Samples were hydrolyzed by adding to each vial 250 μl of 1 M HCl in methanol (prepared with an Altech kit) and placing the capped samples in a heat block set at 80 °C for 15 h. The reaction mixtures were cooled, and a drop of t-butanol was added to each vial. After mixing, the solvents were removed at room temperature under a stream of nitrogen. Next, N-acetylation of the amino sugars was achieved by adding 200 μl of anhydrous methanol, 40 μl of pyridine, and 40 μl of acetic anhydride to each sample. These solutions were mixed with the aid of a vortex and allowed to incubate overnight at room temperature. The samples were evaporated under a stream of nitrogen and again dried on a vacuum pump. Finally, silylation of free OH groups was achieved by adding 200 μl of Tri-Sil reagent (Pierce) to the dried samples. After mixing on a vortex for 30 s, silylation was allowed to proceed at room temperature for an hour. The volatile components were evaporated under a gentle stream of nitrogen, and the samples were redissolved in 100 μl of hexane and transferred to new vials. A mixture of standards, consisting of equimolar glucosamine, galacturonic acid, and 2-aminogluconate (Sigma), was processed in parallel.
GC/MS was done with a Finnigan MAT 95 coupled to a Hewlett-Packard Series II model 5890 gas chromatograph. The column used was a 60 m DB-5 (0.25-micron film; 0.25-mm internal diameter) from J & W Scientific with helium as the carrier gas. GC/MS analysis was executed with on-column injection and an ion source temperature of 200 °C. The temperature program consisted of an initial temperature of 80 °C for 2 min, followed by an increase to 300 °C at a rate of 4 °C/min. The column was then usually held at 300 °C for 30 min. However, it was held at 300 °C for 60 min for detecting the C28 fatty acid species. Chemical ionization mass spectrometry was performed with ammonia as the reactant gas. Electron impact mass spectra were recorded at 70 eV.
RESULTS
Microheterogeneity of R. etli Lipid A Released from Cells by Hydrolysis at pH 4.5
In previous studies, R. etli CE3 lipid A was obtained by hydrolysis of crude R. etli LPS isolated by hot phenol water extraction of cells in 1% acetic acid at 100 °C (33, 34). The resulting lipid A preparations were then analyzed without further purification (33, 34). In contrast, we isolated lipid A directly from whole cells that are first depleted of their glycerophospholipids by extraction with chloroform/methanol/water at room temperature (10). In our procedure, the lipid A is then released from the LPS that remains associated with the extracted cell pellet by mild hydrolysis in sodium acetate buffer at pH 4.5 (29, 45, 48). Under these conditions, the labile glycosidic linkage between the Kdo and lipid A is cleaved selectively without damage to ester substituents (29, 45–48).
When analyzed by thin layer chromatography on silica plates followed by charring, the lipid A components released from cells by pH 4.5 hydrolysis were surprisingly complex. At least five bands were resolved (Fig. 3). Unlike E. coli lipid A, R. etli lipid A could not be visualized on the TLC plates with reagents that detect phosphate (not shown). A lipid A sample prepared from R. etli LPS by the previously described methods (kindly provided by Dr. R. Carlson) generated a similar pattern of complex bands (not shown).
Fig. 3. Microheterogeneity of lipid A components released from R. etli cells by hydrolysis in sodium acetate buffer at pH 4.5.
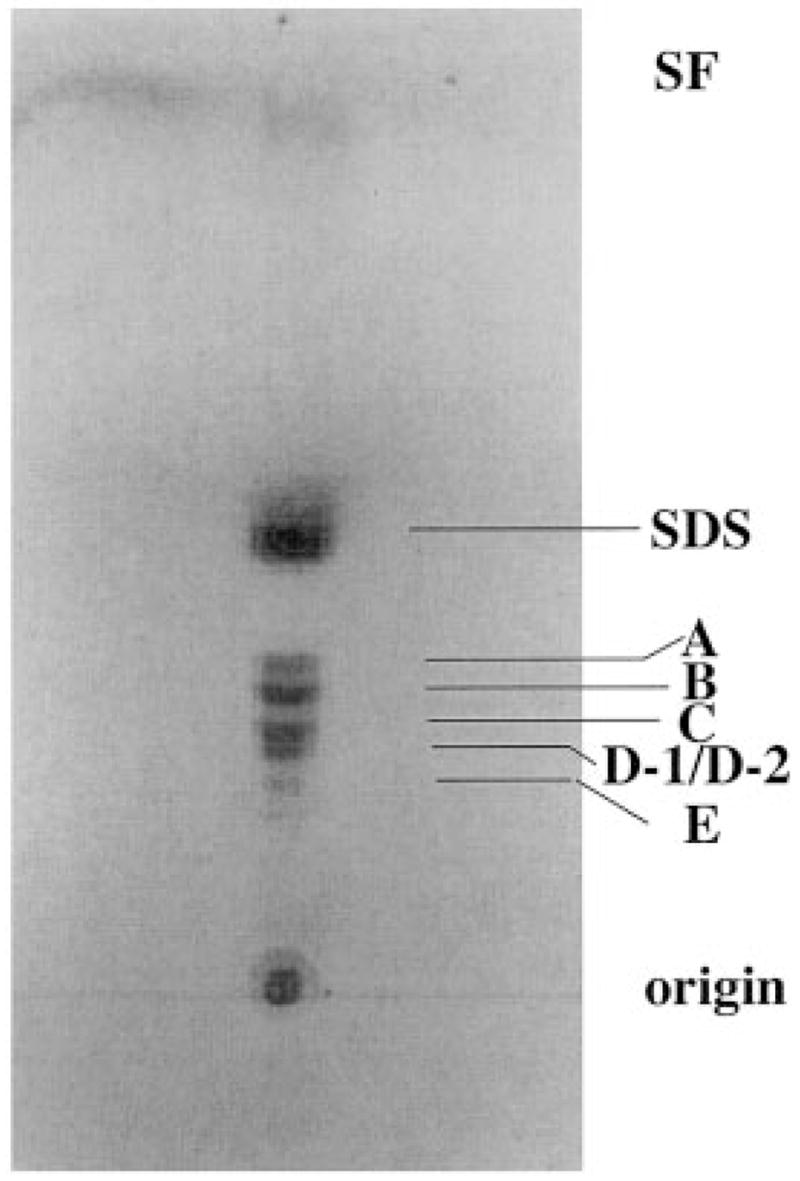
Approximately 2 μg of lipid substances released by hydrolysis of solvent extracted cells were spotted onto a silica TLC plate, which was developed in the solvent CHCl3/MeOH/H2O/NH4OH (40:25:4:2 v/v/v/v). After drying, the lipids were detected by charring with a spray containing 10% sulfuric acid in ethanol. SF designates the solvent front.
Chromatography of R. etli Lipid A Components on DEAE-Cellulose
The lipid A mixture released from cells (Fig. 3) was subjected to anion exchange chromatography on a DEAE-cellulose column prepared in CHCl3/MeOH/H2O (2:3:1 v/v/v). Given the lack of phosphate residues (33), R. etli lipid A displays a much weaker affinity for DEAE-cellulose than does E. coli lipid A. The latter slowly elutes with CHCl3/MeOH/240 mM NH4Ac (2:3:1 v/v/v) (29, 48), whereas the R. etli lipid A species elute in two distinct groups at much lower salt concentrations. Components A, B and C emerge with CHCl3/MeOH/30 mM NH4Ac (2:3:1 v/v). D-1, D-2, and E elute with CHCl3/MeOH/60–120 mM NH4Ac. These findings suggest that A, B, and C each contain a single negatively charged group, whereas D-1, D-2, and E may each contain two negative charges.
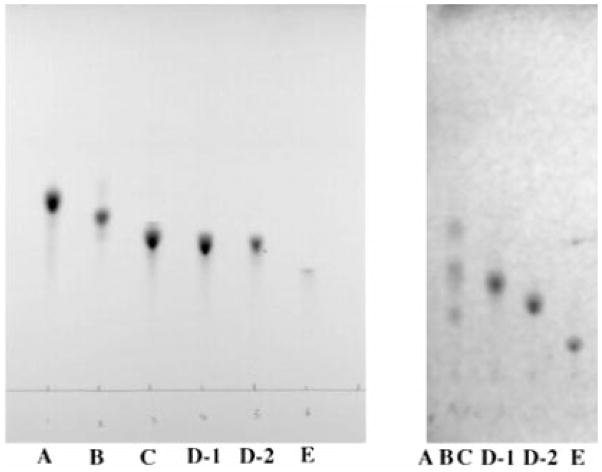
Component C was resolved from A and B on a Bio-Sil column. Thin layer chromatography on the 0.5–2-mg scale proved to be the most practical way to obtain pure A, B, D-1, D-2, and E. As a final purification step, prior to structural characterization, all components purified by TLC were subjected to a second DEAE-cellulose mini-column (see “Experimental Procedures”) to eliminate residual silica particles, minor degradation products, and metal ions. A thin layer analysis of the purified substances is shown in Fig. 4A. An alternative solvent system was used in the experiment shown in Fig. 4B to separate components D-1, D-2, and E.
Fig. 4. Thin layer analysis of the lipid A components purified from R. etli.
A, samples of purified components (~0.2–1 μg each) were spotted, as indicated. The solvent system consisted of CHCl3/MeOH/H2O/NH4OH (40:25:4:2 v/v/v/v), as in Fig. 3. B, purified components were analyzed by silica TLC in the solvent system CHCl3/pyridine/formic acid/MeOH/H2O (60:35:10:5:2 v/v). ABC is a mixture of components A, B, and C in which the most rapidly migrating material is component A, the middle band is B, and the slowest migrating band is C. The bands were detected by charring with 10% sulfuric acid in ethanol, as in Fig. 3.
Negative Ion MALDI/TOF Mass Spectrometry of B, C, D-1, D-2, and E
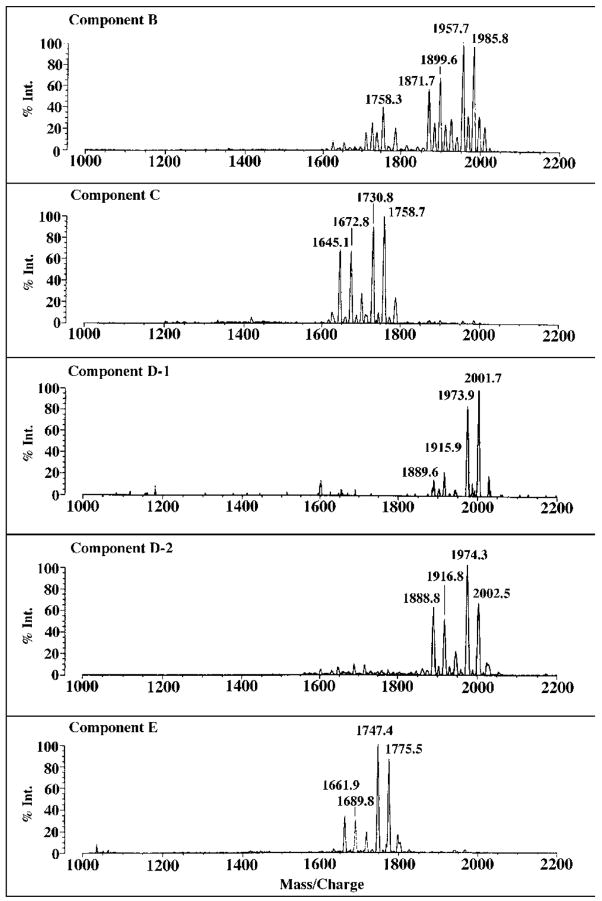
The negative ion MALDI/TOF mass spectra of B, C, D-1, D-2, and E are shown in Fig. 5. The four most prominent peaks observed for each of these substances are interpreted as a set of molecular ions [M − H]−, arising from related molecular species, differing either in fatty acyl chain length (differences of 28 atomic mass units) and/or the presence of a β-hydroxybutyryl moiety (differences of 86 atomic mass units). For instance, in the case of B, the peak at m/z 1985.8 is interpreted as [M − H]− of a molecular species containing a fatty acid that is two methylene units longer than the species giving rise to the peak at m/z 1957.7. The peak at m/z 1899.6 might be derived from a compound with the same fatty acid chain lengths as the species seen at m/z 1985.8 but lacking the β-hydroxybutyryl substituent (86 atomic mass units). This interpretation is entirely consistent with previous studies of the composition of R. etli lipid A, which demonstrated some fatty acid chain length heterogeneity, and the presence of an ester-linked β-hydroxybutyryl substituent attached to the 27-hydroxyoctacosanoate moiety (33, 34). Given that significant fragmentation is not expected during MALDI/TOF mass spectrometry in the negative ion mode, it appears that there is genuine heterogeneity with regard to the presence or absence of the β-hydroxybutyryl substituent.
Fig. 5. Negative ion MALDI/TOF mass spectra of purified R. etli CE3 lipid A components.
Evidence for heterogeneity in fatty acid chain length (14 or 28 atomic mass units) and partial substitution with β-hydroxybutyrate (86 atomic mass units) is observed in all the samples. C and E differ from B and D-1/D-2 respectively by the absence of one hydroxymyristoyl unit (~226 atomic mass units), whereas the molecular species in D-1/D-2 and E are ~16 atomic mass units larger than their counterparts in B and C, respectively.
The four predominant peaks, attributed to [M − H]−, in component C are each ~227 atomic mass units smaller than the four major peaks seen in B (Fig. 5), strongly suggesting the absence of a one β-hydroxymyristoyl residue in C versus B. The small variations (±0.5 atomic mass units) in the mass differences for each of the corresponding peaks in B versus C are consistent with the precision of MALDI/TOF mass spectrometry. Similarly, the four peaks in E are ~227 atomic mass units smaller than their counterparts in D-1 or D-2, demonstrating that E is related to D-1/D-2 in the same way that C is to B.
As shown in Fig. 5, the four major peaks in D-1 and D-2 are approximately 16 atomic mass units larger than the corresponding peaks in component B, suggesting the presence of an additional oxygen atom in D-1 and D-2 versus B. The negative ion MALDI/TOF mass spectrum of D-1 is the same as that of D-2 (Fig. 5) within experimental error. Similarly, the four major species in E are 16–17 atomic mass units larger than the ones in C (Fig. 5). Taken together with the GC/MS data discussed below, we propose that B and C each contain two glucosamine residues, whereas D-1, D-2, and E each contain one glucosamine and one aminogluconate moiety (thereby accounting for the extra oxygen atom in D-1 and D-2 versus B).
Positive Ion MALDI/TOF Mass Spectrometry
Although negative ion MALDI/TOF mass spectrometry readily reveals the sizes of the parent ions [M − H]−, the positive ion mode may provide information about the sizes of the proximal and distal units of the lipid A disaccharide. The positive ion MALDI/TOF spectra of components B, C, D-1, D-2, and E are shown in Fig. 6.
Fig. 6. Positive ion MALDI/TOF mass spectra of purified R. etli CE3 lipid A components.
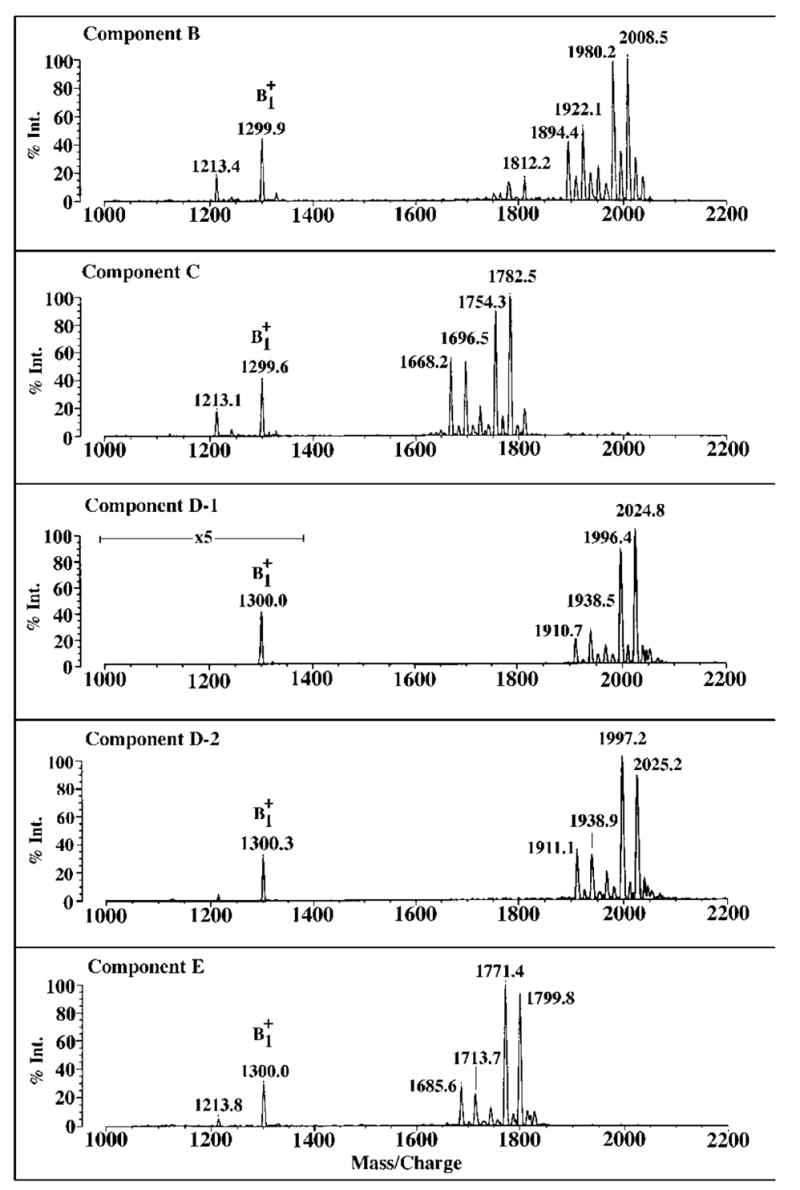
Each of the purified components display a prominent ion near m/z 1299.8 atomic mass units, corresponding to the molecular weight of the conserved distal portion of these molecules, as illustrated in Fig. 10.
The positive ion spectrum of B (Fig. 6) displays four prominent peaks at m/z 2008.5, 1980.2, 1922.1, and 1894.4, each interpreted as [M + Na]+. These values are consistent with the peaks, attributed to [M − H]−, at m/z 1985.8, 1957.7, 1899.6, and 1871.7, respectively, seen for B (Fig. 5). Similarly, the molecular ions, interpreted as [M + Na]+, of C, D-1, D-2, and E in the positive ion spectra (Fig. 6) are each 23–24 atomic mass units larger than their corresponding [M − H]− peaks (Fig. 5).
With the proper ionization energy in positive ion MALDI/TOF mass spectrometry, it is possible to generate sufficient amounts of the oxonium ion (53), which is formed during fragmentation of the glycosidic linkage, to determine the mass of the distal lipid A unit. The same ions within experimental error (1299.6–1300.3 atomic mass units) are observed for B, C, D-1, D-2, and E (Fig. 6), indicating that the distal units are very likely the same in each of these substances. As in the negative ion mode (Fig. 5), the entire spectrum of D-1 is virtually identical to that of D-2. The heterogeneity of R. etli lipid A, including the variability of the acyl chains and the presence or absence of aminogluconate, is mainly a property of the proximal unit. However, partial substitution with β-hydroxybutyrate (86 atomic mass units) appears to be a distinct feature of the distal unit, because a smaller ion peak is observed near m/z 1213.4 in most of the samples (Fig. 6). In this interpretation, the peak seen at m/z 1299.9 in component B is derived by glycosidic bond cleavage of either of the two molecular species that give rise to the sodium adduct ions at m/z 2008.5 and 1980.2 (Fig. 6). The peak at m/z 1213.4 is derived from the two species that generate the sodium adducts seen at m/z 1922.1 and 1894.4 (Fig. 6).
Components D-1 and D-2 May Be Interconverted
Components D-1 and D-2 are identical in all respects when analyzed by MALDI/TOF mass spectrometry. However, when they are incubated separately at room temperature overnight in 50 mM HEPES at pH 7.5, interconversion is observed, as judged by thin layer chromatography using the methods described Fig. 4B (data not shown). The interconversion of D-1 and D-2 most likely is due to the migration of the ester-linked acyl group between the 3- and/or the 4 and 5 positions of the proximal unit. Similar isomerization reactions have been extensively documented in the case of mono-acylated lipid A precursors (54) and with certain glycerol based lipids (55).
MALDI/TOF Mass Spectrometry of Mild Base-hydrolyzed Components C and B
When fractions containing A, B, and C from the DEAE-cellulose column were subjected to preparative TLC using the solvent CHCl3/MeOH/H2O/NH4OH (40:25:4:2 v/v/v/v) rather than the preferred pyridine-containing solvent (see “Experimental Procedures”), partial decomposition was observed. Specifically, after the desired bands were extracted from the silica chips with a neutral single phase Bligh-Dyer-system, selective 3′-O-deacylation of all the samples was noted. However, the acyloxyacyl groupat position 2′ remained intact, as judged by mass spectrometry. Consequently, the ions generated during positive ion MALDI/TOF analysis of lipid A samples hydrolyzed in this fashion served to identify the fatty acids that comprise the 2′ acyloxyacyl moiety and the 3′ acyl substituent of the distal sugar unit.
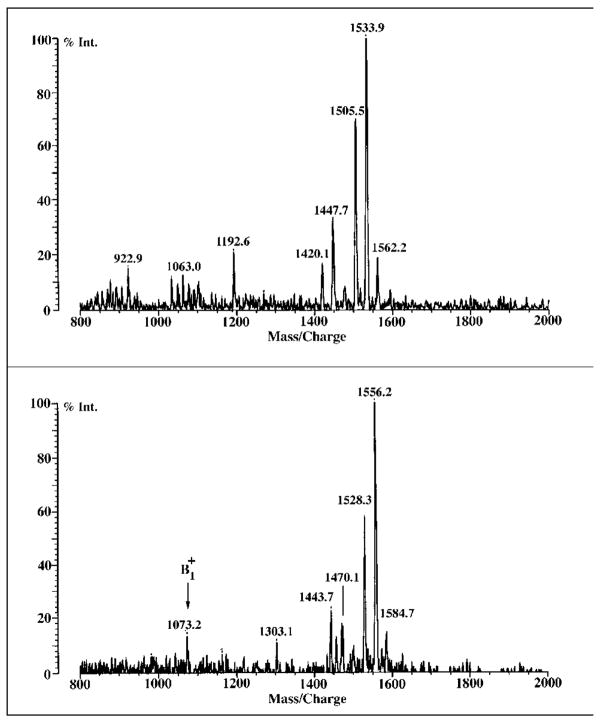
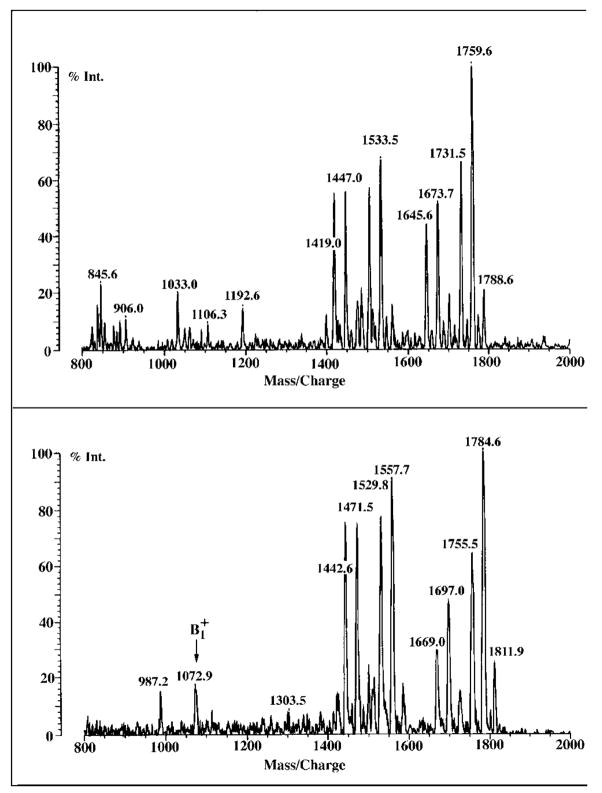
As shown in Figs. 7 and 8, C and B each lose a single acyl chain upon exposure to the ammonia-containing TLC system, as indicated by the molecular ions [M + Na]+ at m/z 1556.2 for C and at m/z 1784.6 for B in the positive ion MALDI/TOF spectra. These signals differ from those of intact C or B by ~226 atomic mass units (Fig. 6), indicative of the loss of a β-hydroxymyristoyl group. These assignments are confirmed in the negative ion mode spectra (Figs. 7 and 8). Figs. 7 and 8 also show that deacylation occurred on the distal glucosamine units of C and B, given that the ions of decomposed C and B (m/z 1073.2 and 1073.9, respectively) are 226 atomic mass units smaller than the ions of intact C and B (Fig. 6). The sizes of the fragment ions therefore indicate that the C28 chain is still present in the distal units of deacylated C and B and that it must comprise part of an acyloxyacyl moiety at N-2′, because the C28 chain itself is ester-linked (33).
Fig. 7. MALDI/TOF mass spectra of 3′-O-deacylated component C.
When subjected to mild NH4OH-containing solvents during preparative TLC, component C is slowly deacylated at the 3′ position. The positive ion MALDI/TOF spectrum confirms that the ion generated from this deacylated material is ~226 atomic mass units smaller than that of component C (Fig. 6), corresponding to the loss of a β-hydroxymyristoyl moiety. Upper panel, negative ion spectrum; lower panel, positive ion spectrum.
Fig. 8. MALDI/TOF mass spectra of 3′-O-deacylated component B.
When subjected to NH4OH-containing solvents during preparative TLC, component B, like C (Fig. 7), is slowly deacylated at the 3′ position, with the loss of a β-hydroxymyristoyl unit (~226 atomic mass units). Upper panel, negative ion spectrum; lower panel, positive ion spectrum.
GC/MS Analysis of Components B and D-1
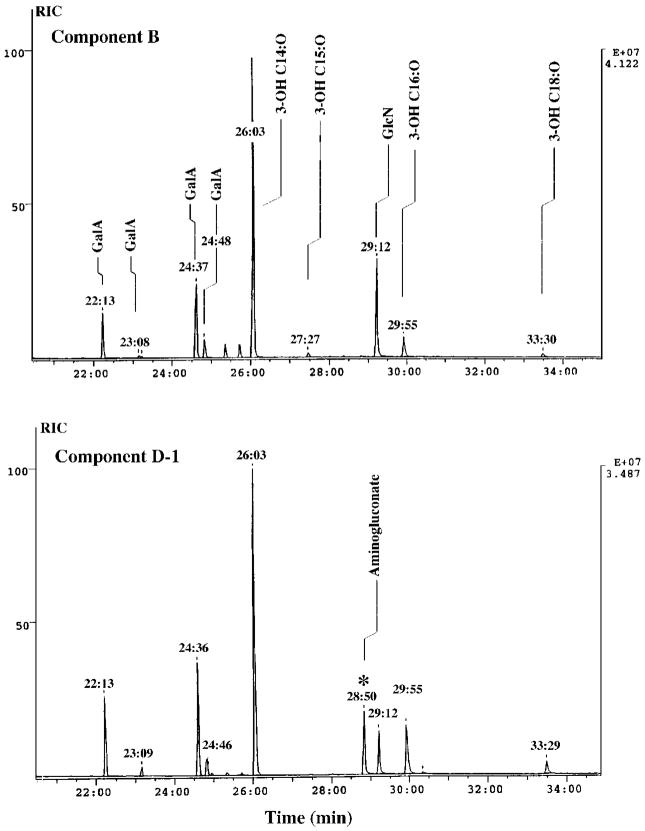
A GC trace of the trimethylsilyl ethers of the N-acetylated methylglycosides and the trimethylsilyl ethers of the fatty acid methyl esters obtained from purified B and D-1 are shown in Fig. 9. Peak assignments were based on the patterns observed with standards that were prepared and run in parallel. In addition, the masses for each of the peaks derived from B and D-1, observed in the GC traces, were determined by on-line electron impact and chemical ionization mass spectrometry. These spectra were compared with those of the standards, further validating the assignments. The sugar and fatty acid constituents that comprise the individual purified R. etli lipid A components are unambiguously revealed by this procedure (Fig. 9).
Fig. 9. Sugar and fatty acid compositions of components B and D-1.
Tri-methysilyl ether derivatives of the N-acetylated methyl glycosides and the fatty acid methyl esters obtained by methanol-HCl hydrolysis of purified components B and D-1 were separated by gas-liquid chromatography. Each peak was identified by comparison of its retention time with standards and by the fragmentation patterns observed during electron impact and chemical ionization mass spectrometry (not shown).
Interestingly, six fatty acids were detected: 3-OH C14:0, 3-OH C16:0, 3-OH C18:0, two isomers of 3-OH C15:0, and 27-OH C28:0. The latter emerges after 50 min and is not shown in Fig. 9. These results are consistent with the heterogeneity in the fatty acyl chain composition of the proximal unit of B (Figs. 5 and 6). The fatty acid composition of D-1 is similar to that of B (Fig. 9). What is important, however, is that the sugars present in B consist only of galacturonic acid and glucosamine, whereas D-1 clearly contains an additional sugar not present in B. The extra peak, eluting at 28 min, 50 s (Fig. 9), isattributed to 2-aminogluconate, based on the standards. These results unequivocally demonstrate the presence of 2-aminogluconate in D-1 but not in B, and strongly suggest that the sugar backbone of B is composed of two glucosamine units. Overall, these findings are completely consistent with the MALDI/TOF mass spectrometry of B and D-1/D-2 (Figs. 5 and 6). It must be emphasized that unambiguous interpretation of these results was made possible only because of our ability to separate the individual components of R. etli lipid A. GC/MS analysis of component A gave results that were qualitatively similar to those obtained for B (not shown).
Proposed Structures for B, C, D-1, and E
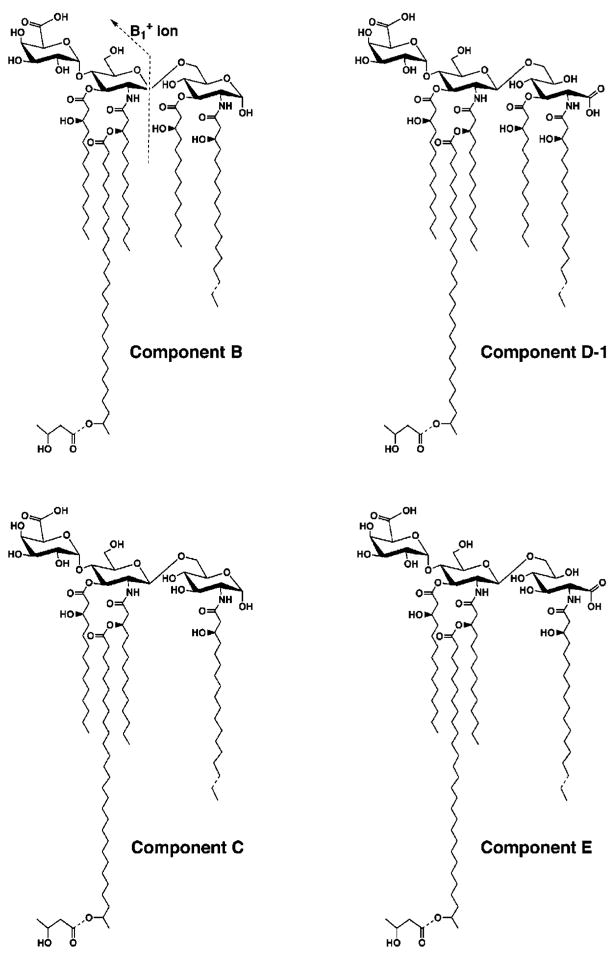
As shown in Fig. 10, we can deduce logical structures for the major molecular species present in B, C, D-1, and E by combining the results of the mass spectrometry of the isolated substances (Figs. 5–8) with the GC/MS analyses of the fatty acid and sugar compositions of components B and D-1 (Fig. 9). In contrast to the previously published structure (Fig. 1) (33, 34), we suggest that the 27-hydroxyoctacosanoate chain is attached to the distal unit as part of an acyloxyacyl moiety. The predicted size of the ion (1299.8 atomic mass units; Fig. 10), which is within experimental error of the observed values (Fig. 6), together with the presence of the β-hydroxybutyryl group on the distal unit strongly support our idea. A complete comparison of the predicted molecular weights and the observed peaks for the largest of the major species present in B, C, D-1/D-2, and E is shown in Table I. All of the observed peaks are within one mass units of the values predicted by the structural formulas shown in Fig. 10. In contrast, the molecular weight of the published R. etli lipid A structure (33, 34) is predicted to be 2313.31 (Fig. 1). Ions corresponding to the latter value are not observed (Figs. 5 and 6). Lastly, the more conventional nonphosphorylated glucosamine disaccharide backbone that we have found in components B and C was not originally proposed for R. etli lipid A (33, 34).
Fig. 10. Proposed covalent structures of components B, C, D-1, and E of R. etli CE3 lipid A.
Components B and C contain a glucosamine disaccharide unit, typical of most known lipid A molecules, including that of E. coli. Evidence for the β, 1′-6 linkage in B and C, and for the absence of an acyl chain at position 3 in C, is provided by the NMR studies in the accompanying article (73). Components D-1, D-2 (not shown), and E are proposed to contain an aminogluconate residue in place of the proximal glucosamine. D-1 and D-2 have the same molecular masses (as judged by the MALDI/TOF analysis), but they appear to be interconverted during prolonged incubation at room temperature in aqueous buffers and organic solvents. This process probably results from the migration of the fatty acyl at the C-3 position in D-1 to the C-5 position of the aminogluconate residue to generate D-2 (not shown). Acyl chain migration is known to occur in mono-acylated derivatives of UDP-N-acetylglucosamine (54), which are early intermediates in the lipid A pathway. The predominant substances that are isolated from cells are B and D-1/D-2. All components, including A, have the same distal unit, as indicated by the common ion fragments in Figs. 6 and 11. Dashed bonds indicate microheterogeneity with respect to acyl chain lengths and the presence or absence of the β-hydroxybutyrate substituent. The molecular weights calculated in Table I are those of the species with the longer acyl chains at position 2 and those that are decorated with the β-hydroxybutyrate group.
Table I.
Summary of MALDI/TOF mass spectrometry analysis of R. etli lipid A components
| Component | B | C | D-1 | D-2 | E | A |
|---|---|---|---|---|---|---|
| Molecular formula | C110H204N2O27 | C96H178N2O25 | C110H204N2O28 | C110H204N2O28 | C96H178N2O26 | C96H174N2O24 |
| Expected molecular weight | 1986.8 | 1760.4 | 2002.8 | 2002.8 | 1776.4 | 1740.4 |
| Observed m/z [M − H]− | 1985.8 | 1758.7 | 2001.7 | 2002.5 | 1775.5 | 1739.1 |
| Observed m/z [M + Na]+ | 2008.5 | 1782.5 | 2024.8 | 2025.2 | 1799.8 | 1763.0 |
| Observed B1+ ion | 1299.9 | 1299.6 | 1300.0 | 1300.3 | 1300.0 | 1300.2 |
Mass Spectrometry of Component A
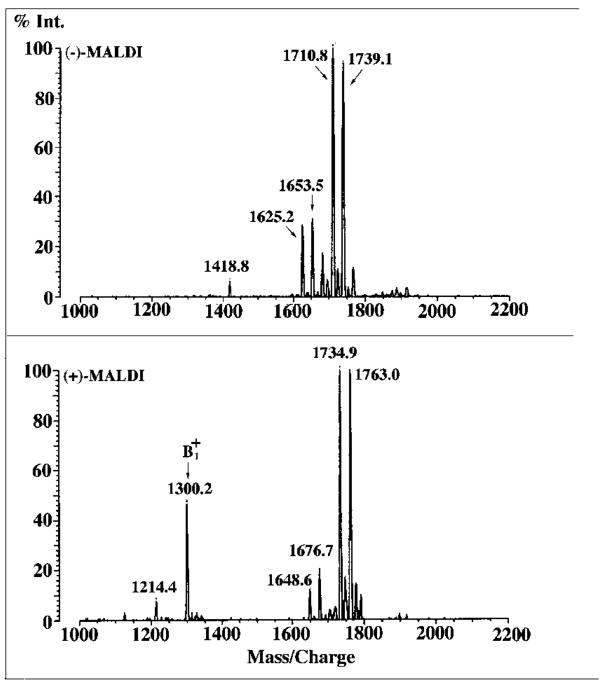
The MALDI/TOF mass spectra of component A in the negative ion and positive ion modes are shown in Fig. 11. A major peak at m/z 1739.1, attributed to [M − H]−, is seen in the negative ion spectrum, and a second major species at m/z 1710.8 is attributed to fatty acyl chain length heterogeneity. Smaller amounts of molecular species lacking the β-hydroxybutyrate substituent are seen at m/z 1653.5 and 1625.2 (Fig. 11), similar to what is observed with B, C, D-1, D-2 and E (Fig. 5). In the positive ion MALDI/TOF spectrum (Fig. 11), the most intense peaks obtained are the four molecular ions attributed to [M + Na]+ at m/z 1763.0, 1734.9, 1676.7, and 1648.6, consistent with the negative ion MALDI/TOF results. Importantly, the signal arising from the ion of A is seen at m/z 1300.2, again indicating that the distal unit of A is the same as that of the other R. etli lipid A components (Fig. 6). When compared with B or D-1, the molecular masses observed in the spectrum of A suggest the possible elimination of β-hydroxymyristic acid and an additional water molecule (244 + 18 = 262 atomic mass units) from the proximal unit of D-1 (molecular weight of 2002.8), as opposed to deacylation. A plausible scenario is that the additional water molecule arises by lactonization of the aminogluconate residue. However, a reasonable structure cannot yet be proposed based solely upon mass spectrometry. Interestingly, component A appears to be generated specifically from D-1 by pH 4.5 hydrolysis at 100 °C (data not shown), suggesting that A is actually not made by living cells. The fact that A is not formed when B is subjected to the same hydrolytic conditions (data not shown) lends further credence to A being derived from D-1.
Fig. 11. MALDI/TOF mass spectra of component A.
Upper panel, negative ion spectrum; lower panel, positive ion spectrum. Exactly the + fragment ion is observed in the positive ion spectrum of A as same in the positive ion spectra of components B–E (Fig. 6).
DISCUSSION
Following infection of plant root hair cells, bacterial endosymbionts, such as R. etli, Rhizobium meliloti, and R. leguminosarum undergo complex developmental changes to form nitrogen-fixing bacteroids (56–59). A bacterial outer membrane component likely to be involved in establishing this symbiotic relationship is LPS. The presence of an O-antigen polymer on LPS is required for proper nodule development by R. etli and R. leguminosarum (36, 37, 60), and O-antigen undergoes some structural modifications during nodule formation, as judged by immunological studies (61, 62). However, in R. meliloti, O-antigen is not required for nodule formation (63), possibly because the exo-polysaccharides of R. meliloti (64) can substitute for O-antigen.
Whether or not lipid A plays an important role in symbiosis of R. etli and leguminosarum with plants remains to be determined. It is conceivable (although not proven) that some kinds of lipid A molecules may activate the innate immune system of plants, as happens in animal systems (65). To address the role of lipid A during symbiosis, a structure-function study would be very informative. Well defined mutations in the lipid A biosynthetic pathway are needed for this purpose. Construction of the relevant mutants relies on an in-depth understanding of the molecular genetics of lipid A biosynthesis, which in turn, requires that the covalent structure of lipid A is known.
In this context, Carlson and co-workers (33, 34) have reported a most remarkable structure for the lipid A of R. etli when contrasted with the lipid A species found in other Gram-negative bacteria (Fig. 1). Their structure was based largely on the composition of the fatty acids and sugars released from R. etli CE3 lipid A that had been subjected to strong acid or alkaline hydrolyses (33, 34). Our new methods for the isolation and purification of intact lipid A components of R. etli have allowed us to identify the multiple but closely related components that make up this material. Our results confirm all the unusual compositional features of R. etli lipid A described by Carlson and co-workers (33, 34), including the presence of the galacturonic acid, the 27-hydroxyoctacosanoate, and the amino-gluconate moieties (Fig. 1). However, our results differ from theirs in that we find extensive microheterogeneity in the proximal unit in conjunction with a conserved distal unit that contains an unusual acyloxyacyl group (Fig. 10).
As shown in the accompanying article (73), our structural findings have allowed us to demonstrate that the component with the conventional glucosamine disaccharide (B) is the precursor of the aminogluconate-containing component D-1. This scenario is consistent with our previous observation that R. etli has the capacity to synthesize the E. coli lipid A precursor Kdo2-lipid IVA (Fig. 2) (39), which is then further modified in a unique manner. C and E are likely to be derived from B and D-1, respectively. A membrane-associated deacylase from R. etli has recently been shown to hydrolyze the ester-linked fatty acid at the C-3 position of the precursors, lipid IVA and Kdo2-lipid IVA (66), which would account for the observed 3-O-deacylated lipid A components C and E isolated from cells (Fig. 10). NMR spectra of the purified samples, discussed in the accompanying paper (73), strongly support the conclusion that B and D-1 are indeed acylated at position 3, whereas C and E are not. However, the isomer D-2 arises by ester-linked acyl chain migration on the proximal unit of D-1 (73).
Although the purified components migrate as single bands during TLC in two solvent systems (Fig. 4), the MALDI/TOF mass spectra display peaks corresponding to additional subspecies with or without the β-hydroxybutyryl moiety (Figs. 5, 6, and 10). This appendage is likely attached to the 27-OH of the 27-hydroxyoctacosanoic acid residue (34). We believe that acylation of the 27-OH group with β-hydroxybutyrate occurs after acyloxyacyl group formation during lipid A biosynthesis, because the C28-AcpXL acyl donor substrate, previously reported by our laboratory, is not substituted with a β-hydroxybutyryl group (42).
The fatty acids shown in the proposed structures (Fig. 10) reflect the major ones observed in our own GC/MS analyses (Fig. 9) and are consistent with those reported by Bhat et al. (33). A small amount of C15 (Fig. 9) may be attached at position 3 of the proximal unit, because its presence (33) would account for some of the minor peaks in the spectra of B, D-1, and D-2 (Figs. 5 and 6), differing from the major molecular ions by 14 atomic mass units. As shown in Fig. 10, the proximal sugar unit is further proposed to vary with respect to the lengths of the N-linked fatty acyl chains at the C-2 position, whereas the C-2′ position is substituted predominantly with hydroxymyristate. This conclusion is based on the masses of the ions of each of the components (Fig. 6) and the compositional analyses of Carlson and co-workers (33), who noted the same asymmetry in the distribution of the N-linked acyl chains at 2 and 2′.
The distribution of the N-linked hydroxyacyl chains has subtle implications for the biosynthesis of lipid A in R. etli. One possibility is that LpxD (the N-acyltransferase) (6, 16) and LpxB (the disaccharide synthase) (6, 16) of R. etli have different acyl chain length specificity than their E. coli counterparts. For instance, the N-acyltransferase of R. etli might be able to function with 14-, 16-, and 18-carbon hydroxyacyl-ACP substrates, generating a family of UDP-2,3-diacylglucosamine species differing in the lengths of their N-linked acyl chains. If R. etli LpxB displayed an absolute specificity for UDP-2,3-bis-(R-3-hydroxymyristoyl)-glucosamine as the donor but preferred longer N-acyl chain lengths in the 2,3-diacylglucosamine-phosphate acceptor, the observed asymmetry in N-acyl chain lengths (Fig. 10) would be generated.
The available partial sequence of the R. meliloti genome shows that all the key enzymes of lipid A biosynthesis that generate the intermediate Kdo2-lipid IVA (Fig. 2), initially discovered in E. coli (1, 6, 16), are also present in R. meliloti and are probably encoded by single genes, as in other systems. These observations are consistent with previous enzymatic studies of R. leguminosarum and etli cell extracts (39), in which efficient synthesis of Kdo2-lipid IVA from UDP-N-acetylglucosamine was observed (Fig. 2). However, R. leguminosarum and R. etli also possess unique enzymes (Fig. 2) that incorporate the C28 chain (42) and dephosphorylate the 1 (41) and 4′ positions (40, 67). A membrane-associated in vitro system for the conversion of component B to D-1, presumably reflecting the oxidation of the proximal glucosamine of B to aminogluconate, is described in the accompanying article (73). The identification of this interesting reaction would not have been possible without the analytical techniques described above. Ultimately, the cloning and targeted inactivation of the C28 acyltransferase, the 1 and 4′ phosphatases, and the putative glucosamine oxidase (dehydrogenase) will be necessary to alter the structure of R. etli lipid A in living cells and to asses their roles during plant symbiosis. R. meliloti membranes do not contain the phosphatases and do not oxidize the proximal lipid A unit, but they do have long chain acyltransferase activity,2 consistent with the presence of long acyl chains in all Rhizobiaceae (35).
Now that the R. etli lipid A components are available in a highly purified state, their biological and immunostimulatory properties can be studied. Because the fatty acid compositions of other lipid A species have been demonstrated to be important determinants of mammalian immune responses (68–72), one might predict that the C28-containing lipid A species found in R. etli and Rhizobiaceae might also have unusual properties. Of further interest are the roles played by the negative charges imparted by the 4′-galacturonic acid (Fig. 10) and the proximal aminogluconate moieties. The unusual lipid A components of R. etli may contribute to a clearer understanding of structure-activity relationships in the elicitation of innate immunity and in the establishment of symbiosis between plants and bacteria.
Acknowledgments
We thank Amina S. Woods for assistance with MALDI/TOF experiments and Sean Murray at the University of Minnesota Mass Spectrometry Laboratory for help with the GC/MS experiments. We thank Dr. Gary Gray and Dr. Serena Farquharson for helpful discussions of the GC/MS data.
Footnotes
This work was supported by National Institutes of Health Grants R37-GM-51796 (to C. R. H. R.) and GM-54882 (to R. J. C.).
The abbreviations used are: LPS, lipopolysaccharide; Kdo, 3-deoxy-D-manno-octulosonic acid; MALDI/TOF, matrix-assisted laser desorption ionization/time of flight; GC/MS, gas chromatography/mass spectrometry.
S. Basu and C. R. H. Raetz, unpublished results.
References
- 1.Raetz CRH. Annu Rev Biochem. 1990;59:129–170. doi: 10.1146/annurev.bi.59.070190.001021. [DOI] [PubMed] [Google Scholar]
- 2.Raetz CRH. J Bacteriol. 1993;175:5745–5753. doi: 10.1128/jb.175.18.5745-5753.1993. [DOI] [PMC free article] [PubMed] [Google Scholar]
- 3.Schnaitman CA, Klena JD. Microbiol Rev. 1993;57:655–682. doi: 10.1128/mr.57.3.655-682.1993. [DOI] [PMC free article] [PubMed] [Google Scholar]
- 4.Rietschel ET, Kirikae T, Schade FU, Mamat U, Schmidt G, Loppnow H, Ulmer AJ, Zähringer U, Seydel U, Di Padova F, Schreier M, Brade H. FASEB J. 1994;8:217–225. doi: 10.1096/fasebj.8.2.8119492. [DOI] [PubMed] [Google Scholar]
- 5.Whitfield C. Trends Microbiol. 1995;3:178–185. doi: 10.1016/s0966-842x(00)88917-9. [DOI] [PubMed] [Google Scholar]
- 6.Raetz CRH. In: Escherichia coli and Salmonella: Cellular and Molecular Biology. 2. Neidhardt FC, editor. Vol. 1. American Society for Microbiology; Washington, D.C: 1996. pp. 1035–1063. [Google Scholar]
- 7.Reeves PR, Hobbs M, Valvano MA, Skurnik M, Whitfield C, Coplin D, Kido N, Klena J, Maskell D, Raetz CRH, Rick PD. Trends Microbiol. 1996;4:495–503. doi: 10.1016/s0966-842x(97)82912-5. [DOI] [PubMed] [Google Scholar]
- 8.Vaara M. Antimicrob Agents Chemother. 1993;37:2255–2260. doi: 10.1128/aac.37.11.2255. [DOI] [PMC free article] [PubMed] [Google Scholar]
- 9.Nikaido H. In: Escherichia coli and Salmonella: Cellular and Molecular Biology. 2. Neidhardt FC, editor. Vol. 1. American Society for Microbiology; Washington, D.C: 1996. pp. 29–47. [Google Scholar]
- 10.Galloway SM, Raetz CRH. J Biol Chem. 1990;265:6394–6402. [PubMed] [Google Scholar]
- 11.Kelly TM, Stachula SA, Raetz CRH, Anderson MS. J Biol Chem. 1993;268:19866–19874. [PubMed] [Google Scholar]
- 12.Onishi HR, Pelak BA, Gerckens LS, Silver LL, Kahan FM, Chen MH, Patchett AA, Galloway SM, Hyland SA, Anderson MS, Raetz CRH. Science. 1996;274:980–982. doi: 10.1126/science.274.5289.980. [DOI] [PubMed] [Google Scholar]
- 13.Garrett TA, Que NL, Raetz CRH. J Biol Chem. 1998;273:12457–12465. doi: 10.1074/jbc.273.20.12457. [DOI] [PubMed] [Google Scholar]
- 14.Belunis CJ, Clementz T, Carty SM, Raetz CRH. J Biol Chem. 1995;270:27646–27652. doi: 10.1074/jbc.270.46.27646. [DOI] [PubMed] [Google Scholar]
- 15.Ulevitch RJ, Tobias PS. Annu Rev Immunol. 1995;13:437–457. doi: 10.1146/annurev.iy.13.040195.002253. [DOI] [PubMed] [Google Scholar]
- 16.Wyckoff TJO, Raetz CRH, Jackman JE. Trends Microbiol. 1998;6:154–159. doi: 10.1016/s0966-842x(98)01230-x. [DOI] [PubMed] [Google Scholar]
- 17.Morrison DC, Vogel S, Opal S, Brade H. Endotoxin in Health and Disease. Marcel Dekker; NY: 1999. [Google Scholar]
- 18.Karow M, Georgopoulos C. J Bacteriol. 1992;174:702–710. doi: 10.1128/jb.174.3.702-710.1992. [DOI] [PMC free article] [PubMed] [Google Scholar]
- 19.Clementz T, Bednarski J, Raetz CRH. FASEB J. 1995;9:1311. abstr. [Google Scholar]
- 20.Clementz T, Zhou Z, Raetz CRH. J Biol Chem. 1997;272:10353–10360. doi: 10.1074/jbc.272.16.10353. [DOI] [PubMed] [Google Scholar]
- 21.Somerville JE, Jr, Cassiano L, Bainbridge B, Cunningham MD, Darveau RP. J Clin Invest. 1996;97:359–365. doi: 10.1172/JCI118423. [DOI] [PMC free article] [PubMed] [Google Scholar]
- 22.Khan SA, Everest P, Servos S, Foxwell N, Zahringer U, Brade H, Rietschel ET, Dougan G, Charles IG, Maskell DJ. Mol Microbiol. 1998;29:571–579. doi: 10.1046/j.1365-2958.1998.00952.x. [DOI] [PubMed] [Google Scholar]
- 23.Low KB, Ittensohn M, Le T, Platt J, Sodi S, Amoss M, Ash O, Carmichael E, Chakraborty A, Fischer J, Lin SL, Luo X, Miller SI, Zheng L, King I, Pawelek JM, Bermudes D. Nat Biotechnol. 1999;17:37–41. doi: 10.1038/5205. [DOI] [PubMed] [Google Scholar]
- 24.Raetz CRH, Takayama K, Anderson L, Armitage IM, Strain SM. Fed Proc. 1984;43:1567. [Google Scholar]
- 25.Raetz CRH, Purcell S, Meyer MV, Qureshi N, Takayama K. J Biol Chem. 1985;260:16080–16088. [PubMed] [Google Scholar]
- 26.Strain SM, Armitage IM, Anderson L, Takayama K, Qureshi N, Raetz CRH. J Biol Chem. 1985;260:16089–16098. [PubMed] [Google Scholar]
- 27.Rietschel ET, Brade L, Lindner B, Zähringer U. In: Bacterial Endotoxic Lipopolysaccharides: Molecular Biochemistry and Cellular Biology. Morrison DC, Ryan JL, editors. I. CRC Press; Boca Raton, FL: 1992. pp. 3–41. [Google Scholar]
- 28.Nummila K, Kilpelainen I, Zähringer U, Vaara M, Helander IM. Mol Microbiol. 1995;16:271–278. doi: 10.1111/j.1365-2958.1995.tb02299.x. [DOI] [PubMed] [Google Scholar]
- 29.Zhou Z, Lin S, Cotter RJ, Raetz CR. J Biol Chem. 1999;274:18503–18514. doi: 10.1074/jbc.274.26.18503. [DOI] [PubMed] [Google Scholar]
- 30.Guo L, Lim KB, Gunn JS, Bainbridge B, Darveau RP, Hackett M, Miller SI. Science. 1997;276:250–253. doi: 10.1126/science.276.5310.250. [DOI] [PubMed] [Google Scholar]
- 31.Gunn JS, Lim KB, Krueger J, Kim K, Guo L, Hackett M, Miller SI. Mol Microbiol. 1998;27:1171–1182. doi: 10.1046/j.1365-2958.1998.00757.x. [DOI] [PubMed] [Google Scholar]
- 32.Ernst RK, Guina T, Miller SI. J Infect Dis. 1999;179(Suppl 2):S326–S330. doi: 10.1086/513850. [DOI] [PubMed] [Google Scholar]
- 33.Bhat UR, Forsberg LS, Carlson RW. J Biol Chem. 1994;269:14402–14410. [PubMed] [Google Scholar]
- 34.Forsberg LS, Carlson RW. J Biol Chem. 1998;273:2747–2757. doi: 10.1074/jbc.273.5.2747. [DOI] [PubMed] [Google Scholar]
- 35.Bhat UR, Carlson RW, Busch M, Mayer H. Int J Syst Bacteriol. 1991;41:213–217. doi: 10.1099/00207713-41-2-213. [DOI] [PubMed] [Google Scholar]
- 36.Noel KD, Vandenbosch KA, Kulpaca B. J Bacteriol. 1986;168:1392–1401. doi: 10.1128/jb.168.3.1392-1401.1986. [DOI] [PMC free article] [PubMed] [Google Scholar]
- 37.Priefer UB. J Bacteriol. 1989;171:6161–6168. doi: 10.1128/jb.171.11.6161-6168.1989. [DOI] [PMC free article] [PubMed] [Google Scholar]
- 38.Zhang Y, Hollingsworth RI, Priefer UB. Carbohydr Res. 1992;231:261–271. doi: 10.1016/0008-6215(92)84024-m. [DOI] [PubMed] [Google Scholar]
- 39.Price NPJ, Kelly TM, Raetz CRH, Carlson RW. J Bacteriol. 1994;176:4646–4655. doi: 10.1128/jb.176.15.4646-4655.1994. [DOI] [PMC free article] [PubMed] [Google Scholar]
- 40.Price NJP, Jeyaretnam B, Carlson RW, Kadrmas JL, Raetz CRH, Brozek KA. Proc Natl Acad Sci U S A. 1995;92:7352–7356. doi: 10.1073/pnas.92.16.7352. [DOI] [PMC free article] [PubMed] [Google Scholar]
- 41.Brozek KA, Kadrmas JL, Raetz CRH. J Biol Chem. 1996;271:32112–32118. [PubMed] [Google Scholar]
- 42.Brozek KA, Carlson RW, Raetz CRH. J Biol Chem. 1996;271:32126–32136. doi: 10.1074/jbc.271.50.32126. [DOI] [PubMed] [Google Scholar]
- 43.Kadrmas JL, Allaway D, Studholme RE, Sullivan JT, Ronson CW, Poole PS, Raetz CRH. J Biol Chem. 1998;273:26432–26440. doi: 10.1074/jbc.273.41.26432. [DOI] [PubMed] [Google Scholar]
- 44.Que NLS, Basu SS, White KA, Raetz CRH. FASEB J. 1998;12:1284. abstr. [Google Scholar]
- 45.Rosner MR, Tang J, Barzilay I, Khorana HG. J Biol Chem. 1979;254:5906–5917. [PubMed] [Google Scholar]
- 46.Caroff M, Tacken A, Szabó L. Carbohydr Res. 1988;175:273–282. doi: 10.1016/0008-6215(88)84149-1. [DOI] [PubMed] [Google Scholar]
- 47.Caroff M, Deprun C, Karibian D, Szabó L. J Biol Chem. 1991;266:18543–18549. [PubMed] [Google Scholar]
- 48.Odegaard TJ, Kaltashov IA, Cotter RJ, Steeghs L, van der Ley P, Khan S, Maskell DJ, Raetz CRH. J Biol Chem. 1997;272:19688–19696. doi: 10.1074/jbc.272.32.19688. [DOI] [PubMed] [Google Scholar]
- 49.Zhou Z, White KA, Polissi A, Georgopoulos C, Raetz CRH. J Biol Chem. 1998;273:12466–124675. doi: 10.1074/jbc.273.20.12466. [DOI] [PubMed] [Google Scholar]
- 50.Bligh EG, Dyer JJ. Can J Biochem Physiol. 1959;37:911–918. doi: 10.1139/o59-099. [DOI] [PubMed] [Google Scholar]
- 51.Raetz CRH, Kennedy EP. J Biol Chem. 1973;248:1098–1105. [PubMed] [Google Scholar]
- 52.York WS, Darvill AG, McNeil M, Stevenson TT, Albersheim P. Methods Enzymol. 1985;118:3–40. [Google Scholar]
- 53.Costello CE, Vath JE. Methods Enzymol. 1990;193:738–768. doi: 10.1016/0076-6879(90)93448-t. [DOI] [PubMed] [Google Scholar]
- 54.Anderson MS, Robertson AD, Macher I, Raetz CRH. Biochemistry. 1988;27:1908–1917. doi: 10.1021/bi00406a017. [DOI] [PubMed] [Google Scholar]
- 55.Bertello LE, Salto ML, de Lederkremer RM. Lipids. 1997;32:907–911. doi: 10.1007/s11745-997-0117-x. [DOI] [PubMed] [Google Scholar]
- 56.Long SR, Staskawicz BJ. Cell. 1993;73:921–935. doi: 10.1016/0092-8674(93)90271-q. [DOI] [PubMed] [Google Scholar]
- 57.Downie JA. Trends Microbiol. 1994;2:318–324. doi: 10.1016/0966-842x(94)90448-0. [DOI] [PubMed] [Google Scholar]
- 58.Pueppke SG. Crit Rev Biotechnol. 1996;16:1–51. doi: 10.3109/07388559609146599. [DOI] [PubMed] [Google Scholar]
- 59.Schultze M, Kondorosi A. Annu Rev Genet. 1998;32:33–57. doi: 10.1146/annurev.genet.32.1.33. [DOI] [PubMed] [Google Scholar]
- 60.Kannenberg EL, Rathbun EA, Brewin NJ. Mol Microbiol. 1992;6:2477–2487. doi: 10.1111/j.1365-2958.1992.tb01424.x. [DOI] [PubMed] [Google Scholar]
- 61.Tao H, Brewin NJ, Noel KD. J Bacteriol. 1992;174:2222–2229. doi: 10.1128/jb.174.7.2222-2229.1992. [DOI] [PMC free article] [PubMed] [Google Scholar]
- 62.Sindhu SS, Brewin NJ, Kannenberg EL. J Bacteriol. 1990;172:1804–1813. doi: 10.1128/jb.172.4.1804-1813.1990. [DOI] [PMC free article] [PubMed] [Google Scholar]
- 63.Clover RH, Kieber J, Signer ER. J Bacteriol. 1989;171:3961–3967. doi: 10.1128/jb.171.7.3961-3967.1989. [DOI] [PMC free article] [PubMed] [Google Scholar]
- 64.Gonzalez JE, York GM, Walker GC. Gene (Amst) 1996;179:141–146. doi: 10.1016/s0378-1119(96)00322-8. [DOI] [PubMed] [Google Scholar]
- 65.Hoffmann JA, Kafatos FC, Janeway CA, Ezekowitz RA. Science. 1999;284:1313–1318. doi: 10.1126/science.284.5418.1313. [DOI] [PubMed] [Google Scholar]
- 66.Basu SS, White KA, Que NL, Raetz CR. J Biol Chem. 1999;274:11150–11158. doi: 10.1074/jbc.274.16.11150. [DOI] [PMC free article] [PubMed] [Google Scholar]
- 67.Basu SS, York JD, Raetz CR. J Biol Chem. 1999;274:11139–11149. doi: 10.1074/jbc.274.16.11139. [DOI] [PMC free article] [PubMed] [Google Scholar]
- 68.Takayama K, Qureshi N, Beutler B, Kirkland TN. Infect Immun. 1989;57:1336–1338. doi: 10.1128/iai.57.4.1336-1338.1989. [DOI] [PMC free article] [PubMed] [Google Scholar]
- 69.Loppnow H, Brade H, Dürrbaum I, Dinarello CA, Kusumoto S, Rietschel ET, Flad HD. J Immunol. 1989;142:3229–3238. [PubMed] [Google Scholar]
- 70.Golenbock DT, Hampton RY, Qureshi N, Takayama K, Raetz CRH. J Biol Chem. 1991;266:19490–19498. [PubMed] [Google Scholar]
- 71.Christ WJ, McGuinness PD, Asano O, Wang Y, Mullarkey MA, Perez M, Hawkins LD, Blythe TA, Dubuc GR, Robidoux AL. J Am Chem Soc. 1994;116:3637–3638. [Google Scholar]
- 72.Christ WJ, Asano O, Robidoux AL, Perez M, Wang Y, Dubuc GR, Gavin WE, Hawkins LD, McGuinness PD, Mullarkey MA, Lewis MD, Kishi Y, Kawata T, Bristol JR, Rose JR, Rossignol DP, Kobayashi S, Hishinuma I, Kimura A, Asakawa N, Katayama K, Yamatsu I. Science. 1995;265:80–83. doi: 10.1126/science.7701344. [DOI] [PubMed] [Google Scholar]
- 73.Que NLS, Ribeiro AA, Raetz CRH. J Biol Chem. 2000;275:28017–28027. doi: 10.1074/jbc.M004009200. [DOI] [PMC free article] [PubMed] [Google Scholar]


