

Abstract
In cardiac muscle, intracellular Ca2+ and Mg2+ are potent regulators of calcium release from the sarcoplasmic reticulum (SR). It is well known that the free [Ca2+] in the SR ([Ca2+]L) stimulates the Ca2+ release channels (ryanodine receptor [RYR]2). However, little is known about the action of luminal Mg2+, which has not been regarded as an important regulator of Ca2+ release.
The effects of luminal Ca2+ and Mg2+ on sheep RYR2 were measured in lipid bilayers. Cytoplasmic and luminal Ca2+ produced a synergistic increase in the opening rate of RYRs. A novel, high affinity inhibition of RYR2 by luminal Mg2+ was observed, pointing to an important physiological role for luminal Mg2+ in cardiac muscle. At diastolic [Ca2+]C, luminal Mg2+ inhibition was voltage independent, with Ki = 45 μM at luminal [Ca2+] ([Ca2+]L) = 100 μM. Luminal and cytoplasmic Mg2+ inhibition was alleviated by increasing [Ca2+]L or [Ca2+]C. Ca2+ and Mg2+ on opposite sides of the bilayer exhibited competitive effects on RYRs, indicating that they can compete via the pore for common sites.
The data were accurately fitted by a model based on a tetrameric RYR structure with four Ca2+-sensing mechanisms on each subunit: activating luminal L-site (40-μM affinity for Mg2+ and Ca2+), cytoplasmic A-site (1.2 μM for Ca2+ and 60 μM for Mg2+), inactivating cytoplasmic I1-site (∼10 mM for Ca2+ and Mg2+), and I2-site (1.2 μM for Ca2+). Activation of three or more subunits will cause channel opening. Mg2+ inhibition occurs primarily by Mg2+ displacing Ca2+ from the L- and A-sites, and Mg2+ fails to open the channel.
The model predicts that under physiological conditions, SR load–dependent Ca2+ release (1) is mainly determined by Ca2+ displacement of Mg2+ from the L-site as SR loading increases, and (2) depends on the properties of both luminal and cytoplasmic activation mechanisms.
INTRODUCTION
Excitation–contraction (E–C) coupling is the process by which muscle contracts in response to depolarization of its surface membrane during an action potential. Depolarization permits a Ca2+ influx via the L-type calcium channels and a small increase in cytoplasmic [Ca2+]. In the heart, this activates Ca2+ release channels (RYR2) in the SR via their cytoplasmic Ca2+ activation sites. The subsequent release of Ca2+ from the SR leads to a large increase in cytoplasmic [Ca2+], which is the signal for contraction (i.e., systole). The increase in cytoplasmic [Ca2+] strongly reinforces RYR activation and SR Ca2+ release, a process known as CICR. The process of CICR underlies the large amplification of the Ca2+ signal in which the SR supplies up to 95% of the Ca2+ entering the cytoplasm during systole (i.e., the amplifier gain of ∼20) (Fabiato, 1985). During diastole, the cytoplasmic [Ca2+] decreases as Ca2+ is sequestered into the SR by the ATP-driven Ca2+ pump (SERCa2) and extruded from the cell via the Na+/Ca2+ exchanger in the surface membrane. As a result of these Ca2+ uptake and release mechanisms, the free [Ca2+] within the SR varies between ∼0.3 and 1.0 mM during normal cardiac cycling (Ginsburg et al., 1998; Bers, 2001).
The Ca2+ content of the SR is a strong stimulator of CICR and a major determinant of E–C coupling gain (Fabiato and Fabiato, 1977). The dependence of Ca2+ release on SR Ca2+ content is a fundamental process underlying the function of smooth and cardiac muscle. It is believed that the cyclic variations in SR free [Ca2+], and its cyclic modulation of the E–C coupling gain constitutes a pacemaking mechanism in addition to that driven by the surface membrane current in pacemaking cells (Van Helden, 1993; Van Helden and Imtiaz, 2003; Vinogradova et al., 2005). Moreover, aberrant regulation of Ca2+ release by store load has been shown to generate cardiac arrhythmias (Venetucci et al., 2008).
Single-channel studies of RYRs using artificial bilayers have now shown that the activity of RYRs is modulated by luminal Ca2+ (Sitsapesan and Williams, 1994; Herrmann-Frank and Lehmann-Horn, 1996; Tripathy and Meissner, 1996; Gyorke and Gyorke, 1998). The regulation of RYRs by luminal Ca2+ has complex dependencies on membrane potential and luminal [Ca2+] (Xu and Meissner, 1998; Laver, 2007a) that indicate the presence of both Ca2+-dependent activation and inhibition mechanisms (Tripathy and Meissner, 1996). The effects of luminal Ca2+ have been attributed in different studies to either Ca2+ sites on the luminal side of the RYR2 (Sitsapesan and Williams, 1995) or to cytoplasmic Ca2+ sites via the flow of Ca2+ through the pore “Ca2+ feedthrough” (Herrmann-Frank and Lehmann-Horn, 1996; Xu and Meissner, 1998). It has been suggested that luminal regulation of RYRs could somehow involve Ca2+-sensing mechanisms on both the luminal and cytoplasmic sides of the membrane (Sitsapesan and Williams, 1997; Gyorke et al., 2002). A recent single-channel study has shown that Ca2+ regulation of RYR2 is due to a process of “luminal-triggered Ca2+ feedthrough” (see Fig. 1 A), in which both luminal and cytoplasmic Ca2+ sites meditate channel activation, and where these sites are functionally linked by Ca2+ feedthrough (Laver, 2007a). This process involved three Ca2+-sensing mechanisms on both the luminal and cytoplasmic side of the RYR. These were (1) a novel luminal Ca2+ activation site (L-site; 40-μM affinity), (2) the well-described cytoplasmic Ca2+ activation site (A-site; ∼1-μM affinity), and (3) a novel cytoplasmic Ca2+ inactivation site (I2-site; ∼1-μM affinity. There is also a low affinity Ca2+/Mg2+ inhibition site (I1-site, previously referred to as the I-site) (Laver, 2007a, 2007b).
Figure 1.

Model for luminal-triggered Ca2+ feedthrough. (A) Three Ca2+-sensing sites on each subunit have been linked to regulation of cardiac RYRs by luminal Ca2+: the luminal activation site (L-site), the cytoplasmic activation site (A-site), and the cytoplasmic Ca2+-inactivation site (I2-site). In addition, we show here that the low affinity Ca2+/Mg2+ inhibition site (I1-site) has a small effect on RYR2 activity under physiological conditions. Cardiac RYR activation by luminal Ca2+ (•) occurs by a multistep process in which Ca2+ binding to the L-site initiates brief (1-ms) openings at rates up to 1 per second. Once the pore is open, luminal Ca2+ has access to the A-site–producing prolongation of openings and to the I2-site–causing inactivation at high levels of Ca2+ feedthrough. (B) Optimal conditions for measuring L-site properties. Cytoplasmic [Ca2+] (≤0.1 μM) is at subactivating levels and (1) during intervals when the channel is shut (×) or (2) when there is a sufficiently large electrochemical gradient in opposition to Ca2+ feedthrough (e.g., +40 mV and luminal [Ca2+] ≤100 μM) can effectively prevent luminal Ca2+ from binding to the cytoplasmic sites. (C) Optimal conditions for measuring A- and I2-site activation by cytoplasmic Ca2+ (○). Luminal [Ca2+] (≤10 μM) is at subactivating levels and when electrochemical gradient opposes Ca2+ feedthrough.
Less recognized, but of similar general importance to Ca2+, is Mg2+, which antagonizes the excitatory effects of Ca2+. Magnesium in the cytoplasm (9 mM) is buffered by ATP (∼8 mM) so that the free cytoplasmic [Mg2+] is ∼1 mM (Godt and Maughan, 1988). Mg2+ deficiency has been linked to hypertension, cardiac arrhythmia, and sudden cardiac death (Eisenberg, 1992; Seelig, 1994; Touyz, 2004; Tong and Rude, 2005). Cytoplasmic Mg2+ is an inhibitor of RYRs, and it is now understood that it inhibits RYRs by a dual mechanism (Meissner et al., 1986; Laver et al., 1997). First, Mg2+ competes with Ca2+ for the A- site where it causes channel closure. Second, Mg2+ binds to a low affinity divalent cation site (I1-site, see above) where it also causes channel closure. The I1-site in RYR2 has a very low affinity (∼10 mM), but we show that it should have a minor inhibitory role at physiological [Mg2+].
The recent identification of two novel Ca2+ regulatory sites on the cytoplasmic and luminal sides of RYR2 complex (L- and I2-sites; Laver, 2007a) reveals new ways in which Mg2+ can potentially regulate RYR2. As yet, the free concentration of Mg2+ in the SR has not been directly determined but because there is no known active transport of Mg2+ across the SR membrane, the free [Mg2+] in the cytoplasm and lumen should be similar. In resting frog muscle, the total [Mg2+] in the terminal cisternae is approximately half that of Ca2+ (Somlyo et al., 1985). Because the calsequestrin (the main Ca2+ chelator in the SR) has about the same affinity for Ca2+ and Mg2+ (Ikemoto et al., 1974), it is likely that the free [Mg2+] will also be approximately half that of free Ca2+. During Ca2+ release in frog muscle (Somlyo et al., 1985), approximately half of the Ca2+ that is lost from terminal cisternae is replaced by Mg2+. Hence, over the course of the heartbeat, the free Mg2+ concentration in the SR most likely cycles between 0.7 mM in diastole and 1.0 mM in systole. However, no one has yet identified any role for luminal Mg2+ in regulating Ca2+ release from the SR. One study has measured the effect of luminal Mg2+ on RYRs (Xu and Meissner, 1998), which reported that physiological concentrations of luminal Mg2+ had no significant effect on the RYR2 in the presence of elevated cytoplasmic [Ca2+]. Here, we measure the effects of luminal Mg2+ on RYR2 over a range of cytoplasmic and luminal [Ca2+] and identify a novel, high affinity inhibition of RYR2 by luminal Mg2+.
In the previous formulation of the luminal-triggered Ca2+ feedthrough, a phenomenological set of equations was used to describe the action of Ca2+ binding at each site (Laver, 2007a). Here, we extend this model in two ways. First, we account for inhibition by luminal and cytoplasmic Mg2+ by allowing for competitive binding of Ca2+ and Mg2+ at the A-, L-, I1-, and I2-sites. This predicts an important physiological role for luminal Mg2+ in cardiac muscle. Second, we reconcile the luminal-triggered Ca2+ feedthrough model with the homotetrameric structure of the RYR using a similar approach to Zahradnik et al. (2005), who were the first to interpret its cytoplasmic Ca2+ activation in this way. Kinetic schemes now explicitly include contributions to channel gating from identical sites on the four RYR subunits.
MATERIALS AND METHODS
Lipid Bilayers, Chemicals, and Solutions.
SR vesicles (containing RYR2) were obtained from sheep hearts and reconstituted into artificial lipid bilayers as described previously (Laver et al., 1995). Lipid bilayers were formed from phosphatidylethanolamine and phosphatidylcholine (8:2 wt/wt) in 50 mg/ml n-decane. Vesicles were added to the cis solution and vesicle incorporation with the bilayer occurred as described by Miller and Racker (1976). During vesicle fusion the cis (cytoplasmic) and trans (luminal) solutions contained 250 mM Cs+ (230 mM CsCH3O3S, 20 mM CsCl) and 50 mM Cs+ (30 mM CsCH3O3S, 20 mM CsCl), respectively. Due to the orientation of RYRs in the SR vesicles, RYRs added to the cis chamber incorporated into the bilayer with the cytoplasmic face of the channel orientated to the cis solution. The osmotic gradient across the membrane and the Ca2+ (1–5 mM) in the cis solution aided vesicle fusion with the bilayer. The cesium salts were obtained from Aldrich Chemical Company, and Ca2+ and Mg2+ were added to these solutions as CaCl2, MgCl2, and MgSO4 from BDH Chemicals. Before channel recording, the trans [Cs+] was raised to 250 mM by the addition of an aliquot of 4 M CsCH3O3S.
Solutions were pH buffered with 10 mM TES (N-tris[hydroxymethyl]methyl-2-aminoethanesulfonic acid; MP Biomedicals) and solutions were titrated to pH 7.4 using CsOH (optical grade from MP Biomedicals). Free [Ca2+] up to 10 μM was buffered with 4.5 mM 1,2-bis(o-aminophenoxy)ethane-N,N,N',N'- tetraacetic acid (BAPTA; obtained as a tetra potassium salt from Invitrogen) and titrated with CaCl2. Free [Ca2+] between 10 and 50 μM in the luminal solution was buffered with either sodium citrate (up to 6 mM in the absence of Mg2+) or dibromo BAPTA (up to 2 mM). Determination of free [Ca2+] up to 100 nM was estimated using published association constants (Marks and Maxfield, 1991) and the program “Bound and Determined” (Brooks and Storey, 1992). A Ca2+ electrode (Radiometer) was used to determine the purity of Ca2+ buffers and Ca2+ stock solutions and was used to measure free [Ca2+] higher than 100 nM. Because all solutions contained ATP and ATP buffers Mg2+ and Ca2+, we took this into account when calculating free levels of Mg2+ and Ca2+. The required free [Mg2+] was determined using the estimates of ATP purity and effective Mg2+ binding constants determined previously under experimental conditions (Laver et al., 2004). ATP was obtained as sodium salts from Sigma Chemicals. During recordings, the composition of the cis solution was altered either by the addition of aliquots of stock solutions or by local perfusion of the bath. The local perfusion method allowed solution exchange within ∼1 s between solutions in random sequence (O'Neill et al., 2003). The perfusion method allowed us to apply solutions to the RYR in which free [Ca2+] and [Mg2+] had been accurately adjusted.
Acquisition and Analysis of Ion Channel Recordings.
Recording and analysis of ion channel activity were performed as described previously (Laver, 2007a). Electrical potentials are expressed using standard physiological convention (i.e., cytoplasmic side relative to the luminal side at virtual ground). Measurements were performed at 23 ± 2°C. During experiments the channel currents were recorded using a 50-kHz sampling rate and 5-kHz low pass filtering. Before analysis the current signal was digitally filtered at 1 kHz with a Gaussian filter and resampled at 5 kHz. Unitary current and time-averaged currents were measured using Channel2 software (P.W. Gauge and M. Smith, Australian National University, Canberra, Australia). Mean open and closed durations were generally calculated from recordings of 100–1,000 opening events. However, under conditions that produced extremely low channel activity, the mean durations were obtained from as few as 25 events covering >400 s of recording (sampling error of <25−1/2, i.e., < 20%).
RESULTS
Inhibition of Cardiac RYRs by Luminal Mg2+
To explore the action of Mg2+ binding to the luminal facing L-site of RYR2, we measured the effect of luminal Mg2+ on RYR2 under experimental conditions previously shown to highlight channel gating associated with the L-site (Fig. 1 B). We used diastolic cytoplasmic [Ca2+] ([Ca2+]C = 0.1 μM), which is too low to trigger channel openings via the cytoplasmic activation site (A-site), whereas the luminal [Ca2+] ([Ca2+]L = 0.1 mM) is sufficiently high to trigger openings via the L-site. (All recordings were made in the presence of near maximally activating concentrations of ATP [2 mM]). A negative membrane potential favors the flow of Ca2+ and Mg2+ from the luminal to cytoplasmic baths where these ions may interact with the A- and I2-sites. A positive membrane potential opposes that flow and will tend to restrict the site of action for luminal Ca2+ and Mg2+ to the luminal side of the channel. In fact, positive membrane potentials might support retrograde feedthrough (cytoplasmic to luminal bath) of Ca2+ or Mg2+ large enough to affect the L-site when their cytoplasmic concentrations exceed 0.1 mM. However, we cannot detect the effect of retrograde feedthrough because we show later that under these conditions the L-site does not contribute significantly to channel gating.
Fig. 2 shows the activity of a representative cardiac RYR under these conditions. In accord with previous findings (Laver, 2007a), RYRs were more active at −40 mV than at +40 mV. The addition of sub-mM levels of luminal Mg2+ was found to strongly inhibit the channel at both positive and negative potentials. Fig. 3 summarizes the effects of luminal Mg2+ on the gating kinetics of RYRs at a [Ca2+]L of 0.1 and 1 mM (−40 mV). Increasing [Mg2+]L decreased channel open probability, Po (Fig. 3 A), via reductions in both opening frequency, Fo (Fig. 3 B), and mean open time, τo (Fig. 3 C). The kinetics of inhibition were quantified by fitting the data to the Hill equation (fits not depicted). The fit parameters for the data in Fig. 3 are shown in Table I (nos. 1–6). The half inhibitory [Mg2+]L, Ki, for Po, Fo, and τo in the presence of 0.1 mM luminal [Ca2+] were ∼0.1 mM (Table I, nos. 1, 3, and 5). Ki was increased to ∼1 mM (Table I, nos. 2, 4, and 6) by increasing [Ca2+]L from 0.1 to 1 mM, indicating that inhibition involves competition between Mg2+ and Ca2+ for regulatory sites on the channel.
Figure 2.

Inhibition of RYR2 activity by luminal Mg2+. The traces were taken from a single experiment, and the luminal [Mg2+] is shown at the left of each trace. The cytoplasmic bath contained 2 mM ATP and 0.1 μM Ca2+ and did not contain any Mg2+. The luminal bath contained 0.1 mM Ca2+. Cytoplasmic and luminal baths also contained 230 mM CsCH3O3S and 20 mM CsCl, pH 7.4. Recordings obtained at +40 mV (top four traces) show channel openings as upward current jumps, whereas recordings at −40 mV show channel openings as downward current jumps.
Figure 3.

The effects of luminal Mg2+ on RYR2 open probability, Po (A), opening frequency, Fo (B), and mean open time, τo (C). (A) The membrane potential was −40 mV, which favors the flow of Ca2+ and Mg2+ from luminal to cytoplasmic baths (arrow). Increasing luminal [Ca2+] caused a decrease in channel sensitivity to luminal [Mg2+]. Data points show the mean ± SE, with labels indicating the number of samples (corresponding points in B and C have the same sample numbers). Note that the data in B and C is taken from a subset of channel recordings used in A. This is because not all recordings used in Po measurements were suitable for determining Fo and τo. The parameters derived from fitting Hill curves to the data are listed in Table I. The solid curves show theoretical fits to the data of the luminal-triggered feedthrough model as discussed in Results. The model parameters are listed in Table V.
TABLE I.
A Summary of the Hill Fit Parameters for Luminal Mg2+ Inhibition of Cardiac RYRs
| No. | [Ca2+]L mM |
[Ca2+]C μM |
V mV |
Ki μM |
ni | Pmax, Fmax, and τmax | n | Figure | |
|---|---|---|---|---|---|---|---|---|---|
| 1 | Po | 0.1 | 0.1 | −40 | 45 ± 5 | 1.8 ± 0.8 | 0.33 ± 0.07 | 17 | 3 A, 4 A |
| 2 | Po | 1.0 | 0.1 | −40 | 800 ± 180 | 1.5 ± 1.3 | 0.071 ± 0.020 | 11 | 3 A, 4 A |
| 3 | Fo | 0.1 | 0.1 | −40 | 76 ± 27 | 1.3 ± 1.0 | 8.8 ± 1.1 | 6 | 3 B, 4 B, 6 A |
| 4 | Fo | 1.0 | 0.1 | −40 | 876 ± 224 | 1.3 ± 1.0 | 11.8 ± 0.9 | 9 | 3 B, 4 B |
| 5 | τo | 0.1 | 0.1 | −40 | 123 ± 23 | 1.9 ± 1.6 | 10.0 ± 3.4 | 6 | 3 C, 4 C, 6 B |
| 6 | τo | 1.0 | 0.1 | −40 | 1,000 ± 330 | 2a | 9.4 ± 5.0 | 9 | 3 C, 4 C |
| 7 | Po | 0.1 | 0.1 | +40 | 84 ± 12 | 1.2 ± 0.5 | 0.051 ± 0.036 | 3 | 4 A |
| 8 | Po | 1.0 | 0.1 | +40 | 1,600 ± 1,000 | 2.6 ± 7.9 | 0.16 ± 0.05 | 11 | – |
| 9 | Fo | 0.1 | 0.1 | +40 | 73 ± 29 | 1.3 ± 1.0 | 3.4 ± 0.5 | 5 | 4 B |
| 10 | τo | 0.1 | 0.1 | +40 | 506 ± 83 | 1.0 ± 3.0 | 3.2 ± 2.0 | 5 | 4 C |
| 11 | Po | 0.1 | 3.0 | −40 | 18,000 ± 5,000 | 1a | 0.78 ± 0.12 | 6 | – |
| 12 | Po | 0.1 | 3.0 | +40 | >105 | – | 0.88 ± 0.05 | 6 | – |
| 13 | Fo | 0.1 | 3.0 | −40 | 2,400 ± 2,000 | 0.7 ± 1.2 | 70 ± 15 | 9 | 6 A |
| 14 | τo | 0.1 | 0.1 | −40 | 123 ± 23 | 1.9 ± 1.6 | 10.0 ± 3.4 | 6 | 6 B |
| 15 | τo | 0.1 | 3.0 | −40 | 480 ± 100 | 2.2 ± 2.0 | 73.0 ± 4.0 | 9 | 6 B |
| 16 | τo | 0.1 | 10 | −40 | 790 ± 150 | 1.5 ± 1.3 | 16.0 ± 7.0 | 7 | 6 B |
 |
The Hill coefficient was fixed during fitting.
To understand the possible role of Mg2+ feedthrough in Mg2+ inhibition, we compared the effects of luminal Mg2+ seen at negative membrane potentials (Fig. 3) with those at positive potentials that oppose the flow of Mg2+ through the channel (Fig. 4). Ion conduction models (Tinker et al., 1992) predict that at +40 mV the Mg2+ flux is 10-fold less than at −40 mV so that the Mg2+ inhibition will be more dependent on luminal facing sites and less dependent on cytoplasmic sites. Fig. 4 shows the kinetics of [Mg2+]L inhibition at both +40 and −40 mV. Although the Ki for [Mg2+]L inhibition of Po (Fig. 4 A and Table I, nos. 1 and 7) and Fo (Fig. 4 B and Table I, nos. 3 and 9) are similar at both voltages, the Ki for τo was fourfold higher at +40 mV than at −40 mV (Fig. 4 C and Table I, nos. 5 and 10). The substantial voltage dependence in the Ki for inhibition of τo suggests that [Mg2+]L inhibition during channel openings has contributions arising from Mg2+ binding with cytoplasmic sites on the RYR. The lack of any voltage dependence in the [Mg2+]L sensitivity of Fo is consistent with it being associated with luminal facing sites on the RYR2, as one would expect from a closed channel (the rate of channel openings is a property of the closed channel).
Figure 4.

The effect of membrane potential on luminal Mg2+ inhibition of RYR2 open probability, Po (A), opening frequency, Fo (B), and mean open time, τo (C). Changing the membrane potential from −40 to +40 mV, thereby opposing the flow of Ca2+ and Mg2+ from luminal to cytoplasmic baths, slightly decreased the sensitivity of Po and Fo to luminal [Mg2+] but had a substantial effect on the Mg2+ dependence of τo. Data points show the mean ± SE. Labels indicate the number of samples for +40 mV (corresponding points in B and C have the same sample numbers). Sample numbers for −40 mV data are displayed in Fig. 3. The parameters derived from fitting Hill curves to the data are listed in Table I. The solid curves show theoretical fits to the data of the luminal-triggered feedthrough model as discussed in Results. The model parameters are listed in Table V.
If the [Mg2+]L-induced reduction in τo is indeed due to Mg2+ passing through the pore and binding to the A-site, one would expect that elevated [Ca2+]C would alleviate this effect by competing with Mg2+ for the same site. To test this hypothesis, we measured the dose responses of luminal Mg2+ inhibition in the presence of [Ca2+]C's of 0.1, 3, and 10 μM. It is important to realize that at elevated [Ca2+]C, the A-site is the main trigger for channel openings. It has been shown that [Ca2+]C of 3 and 10 μM is sufficient to trigger channel openings via the A-site at rates of ∼100 Hz (Laver, 2007a), which is an order of magnitude faster than the maximal triggering rates observed with the L-site (10 Hz).
Fig. 5 shows single channel recordings of RYRs in the presence of 3 μM [Ca2+]C. Comparing the recordings in Figs. 2 and 5 shows that raising [Ca2+]C from 0.1 to 3 μM substantially decreased the channel's sensitivity to luminal Mg2+. At negative voltages, the Ki for [Mg2+]L inhibition of Po was raised from 45 μM at 0.1 μM [Ca2+]C to 18 mM at 3 μM [Ca2+]C (Table I, nos. 1 and 11), and the inhibition was virtually abolished at positive membrane potentials that oppose Mg2+ feedthrough (Ki > 100 mM; Table I, no. 12). These values of Ki tally well with the description of [Mg2+]L inhibition at 4 μM cytoplasmic Ca2+ reported by Xu and Meissner (1998).
Figure 5.

Inhibition of RYR2 activity by luminal Mg2+ in the presence of 3 μM cytoplasmic Ca2+. The traces were taken from a single experiment, and the luminal [Mg2+] is shown at the left of each trace. The cytoplasmic bath contained 2 mM ATP and 3 μM Ca2+, and the luminal bath contained 0.1 mM Ca2+. The dashed lines depict the closed current level in each trace.
The combined effects of cytoplasmic Ca2+ and luminal Mg2+ on Fo and τo are shown in Fig. 6 (−40 mV). Although increasing [Mg2+]L caused a marked reduction in Fo at 0.1 μM [Ca2+]C (the L-site being the main trigger; see above), it had very little effect at elevated [Ca2+]C where the A-site is the main trigger for channel openings (Fig. 6 A and Table I, no. 13). This indicates that although luminal Mg2+ can prevent RYR activation by luminal Ca2+ (see Fig. 3), it does not prevent triggering of the RYR by the cytoplasmic Ca2+. The effect of luminal Mg2+ on τo is shown in Fig. 6 B. The Ki for [Mg2+]L inhibition of τo was increased from 123 μM at 0.1 μM [Ca2+]C to 480 μM and 790 μM at 3 and 10 μM [Ca2+]C, respectively (Table I, nos. 14–16). This alleviation of [Mg2+]L inhibition by cytoplasmic Ca2+ is consistent with the hypothesis that the [Mg2+]L-induced reduction in τo is due to feedthrough of luminal Mg2+ to the A-site where it competes with cytoplasmic Ca2+.
Figure 6.

Antagonistic effects of cytoplasmic Ca2+ and luminal Mg2+ on RYR2. The effect of cytoplasmic Ca2+ on the luminal Mg2+ sensitivity of opening frequency (A) and mean open time (B). Data points show the mean ± SE. Labels indicate the number of samples in □ (A) and • (B; corresponding points in A and B have the same sample numbers). Sample numbers for ▪ are displayed in Fig. 3. The solid curves show theoretical fits to the data of the luminal-triggered feedthrough model as discussed in Results. The model parameters are listed in Table V.
Activation of Cardiac RYRs by Luminal and Cytoplasmic Ca2+
The first experiments described in this section were aimed at characterizing the [Ca2+]C-dependent gating kinetics associated with the A-site. The experimental conditions were designed so that channel openings were triggered primarily by the A-site. Therefore, we kept [Ca2+]L below 10 μM to minimize triggering by the L-site (Fig. 7, •) or the membrane potential was +40 mV (Fig. 8, ○) to minimize Ca2+ feedthrough from the luminal side when the channel was open. At +40 mV, Fo had a biphasic dependence on [Ca2+]C (Fig. 8 A, ○). At [Ca2+]C above 100 nM, Fo increased as third power of [Ca2+]C until it plateaued to ∼1,000 Hz at high concentrations. Corresponding measurements of τo show an increase in two stages: τo increases from 1 to 4 ms over the [Ca2+]C range 100 nM to 1 μM, and then from 4 to 20 ms between 10 and 100 μM. In the higher range of [Ca2+]C, we noticed substantial scatter in channel kinetics, which was associated with the modal gating phenomenon reported previously (Laver et al., 1995). Measurements at −40 mV revealed another aspect to the [Ca2+]C dependence of Fo (Fig. 7, •). At [Ca2+]C below 100 nM, Fo had a weak dependence on [Ca2+]C, increasing by a factor of 10 between 1 and 100 nM. Over this range Fo was extremely low, being equivalent to approximately one channel opening per minute. These measurements were only made possible because in some experiments bilayers contained 5–10 RYRs. The [Ca2+]C dependence of τo at −40 mV was larger than that seen at +40 mV for [Ca2+]C below 10 μM, but above this the [Ca2+]C dependencies were very similar. The [Ca2+]C dependencies of τo in Figs. 7 B and 8 B are quite complex, and the bases for these phenomena will be discussed in connection with the model (see below).
Figure 7.

Activation of RYR2 by luminal and cytoplasmic Ca2+. Cytoplasmic Ca2+ dependencies of opening frequency (A) and mean open time (B) in the presence of 2 mM ATP. Data points show the mean ± SE. Labels indicate the number of samples in • (A) and ○ (B; corresponding points in A and B have the same sample numbers). The inset shows the same data with Fo plotted on a linear scale. The solid and dashed curves show theoretical fits to the data of the luminal-triggered feedthrough model as discussed in Results. The model parameters are listed in Table V. (A and B) Dashed curves, 0.01 mM luminal Ca2+; solid curves, 0.1 mM luminal Ca2+.
Figure 8.

Inhibition of RYR2 by cytoplasmic Mg2+. The effect of Mg2+ (0.22 and 1 mM) on the cytoplasmic Ca2+ dependencies of opening frequency (A) and mean open time (B). Mg2+ shifts both Ca2+ dependencies of channel gating to higher [Ca2+]C. Data points show the mean ± SE. Labels indicate the number of samples in ○ and × (A) and • (B; corresponding points in A and B have the same sample numbers). The solid curves show theoretical fits to the data of the luminal-triggered feedthrough model as discussed in Results. The model parameters are listed in Table V.
In accord with previous findings (Laver, 2007a), raising [Ca2+]L from 10 to 100 μM caused a substantial increase in both Fo and τo (Fig. 7, ○) when [Ca2+]C was <1 μM. The inset in Fig. 7 A shows Fo on a linear scale that makes it quite apparent that raised [Ca2+]L increases the activating effect of [Ca2+]C. Thus, [Ca2+]C and [Ca2+]L can have a synergistic effect on Fo. This cannot be due to Ca2+ feedthrough because Fo is a property of close channels. Rather, it indicates that there is an allosteric interaction between the luminal and cytoplasmic activation sites.
Inhibition of Cardiac RYRs by Cytoplasmic Mg2+
The addition of Mg2+ to the cytoplasmic bath (0.22 and 1 mM free Mg2+; i.e., 1 mM and 2.7 MgCl2 mixed with 2 mM ATP, respectively) decreased τo and shifted the [Ca2+]C dependence of Fo by ∼10-fold to higher concentrations (Fig. 8). These results indicate that cytoplasmic Ca2+ and Mg2+ compete for the A-site as proposed by previous studies (Meissner et al., 1986; Laver et al., 1997), and they also provide the basis for quantifying the action of luminal Mg2+ at the A-site in the luminal-triggered Ca2+ feedthrough model (see below).
The effects of luminal Ca2+ on RYR inhibition by cytoplasmic Mg2+ are shown in Fig. 9. These experiments were designed so that most channel-triggering events were due to the interaction of luminal Ca2+ with the L-site (i.e., [Ca2+]C = 0.1 μM). The ability of luminal Ca2+ to trigger channel openings can be clearly seen in the [Ca2+]L dependence of Fo (Fig. 9 A, ○), which shows half-maximal activation, Ka, of 45 ± 17 μM (Ka value is seen to be a measure of the Ca2+ affinity of the L-site; Laver, 2007a). Cytoplasmic Mg2+ caused a marked reduction in Fo in the presence of both 0.1 and 1 mM [Ca2+]L (Fig. 9 C). However, in spite of its strong effect on channel gating, 0.22 mM [Mg2+]C had no significant effect on the [Ca2+]L sensitivity of the L-site (Ka = 60 ± 21 μM), indicating that cytoplasmic Mg2+ does not alter the Ca2+ affinity of the L-site.
Figure 9.

The effect of luminal [Ca2+] on the inhibition of RYR2 by cytoplasmic Mg2+. The effect of cytoplasmic Mg2+ on the luminal Ca2+ dependencies of opening frequency (A) and mean open time (B). The inset shows the corresponding absolute values of Fo (s−1) plotted on a linear scale. The effect of luminal Ca2+ on the cytoplasmic Mg2+ dependencies of opening frequency (C) and mean open time (D). Data points show the mean ± SE, with labels indicating the number of samples (corresponding points in A and B, and C and D have the same sample numbers). The solid and dashed curves show theoretical fits to the data of the luminal-triggered feedthrough model as discussed in Results. The model parameters are listed in Table V. (A and B) Dashed curves, zero cytoplasmic Mg2+; solid curves, 0.22 mM cytoplasmic Mg2+. (C and D) Dashed curves, 0.1 mM luminal Ca2+; solid curves, 1 mM luminal Ca2+.
In the absence of cytoplasmic Mg2+, τo had a bell-shaped [Ca2+]L dependence (Fig. 9 B, ○) reflecting reinforcement of channel activation via the A-site over the [Ca2+]L range of 0 to 0.1 mM and inactivation via the I2-site at higher [Ca2+]L (Laver, 2007a). The addition of cytoplasmic Mg2+ decreased τo at low [Ca2+]L (Fig. 9, B and D, ▵) but had no significant effect at [Ca2+]L of 1 mM Ca2+ (Fig. 9, B and D, ▴), indicating competitive interactions between luminal Ca2+ and cytoplasmic Mg2+. This is the converse of our earlier result (Fig. 6) showing competition between luminal Mg2+ and cytoplasmic Ca2+. In Fig. 9 B, it appears that the activating part of the [Ca2+]L bell curve for τo shifts to the right in the presence of cytoplasmic Mg2+. This would be expected from a mechanism in which feedthrough of luminal Ca2+ to the A-site is determining τo and where the apparent Ca2+ sensitivity of the A-site is decreased in the presence of cytoplasmic Mg2+ as seen in Fig. 8.
A Luminal-triggered Ca2+ Feedthrough Model for Mg2+ and Ca2+ Incorporating a Homotetrameric Channel Structure
Our previous study (Laver, 2007a) characterized the channel gating kinetics associated with three Ca2+ sites (A-, L-, and I2-sites) on the RYR2 and/or associated proteins that underlie regulation of RYR2 by cytoplasmic and luminal Ca2+ (see schematic representations in Fig. 1). It is envisaged that the channel can open if Ca2+ is bound to either the A- or L-sites. Thus, even in the absence of cytoplasmic Ca2+, luminal Ca2+ can open the channel by binding to the L-site. The subsequent flow of Ca2+ through the pore can increase the cytoplasmic [Ca2+] in the vicinity of the pore mouth and reinforce channel activation (increasing τo) by binding to the A-site or inactivate the channel by binding to the I2-site (decreasing τo).
Feedthrough of Mg2+ and Ca2+.
ICa and IMg were calculated using a rate theory model of RYR conductance (Tinker et al., 1992) (RYRs have nearly identical permeabilities to Ca2+ and Mg2+). The Ca2+ current through the RYR, ICa (pA), leads to an increase in the concentration of Ca2+ in the micro domain of the pore mouth. According to ion diffusion theory (Stern, 1992), the Ca2+ concentration profile, [Ca2+]r at a distance, r (nm), is given by:
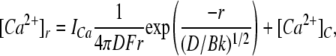 |
(1a) |
where D is the diffusion coefficient of Ca2+, k and B are the binding rate and concentration of the Ca2+ buffer, respectively, and F is the Faraday constant. In the experiments here (4.5 mM BAPTA with k = 1.7 × 10⁹ (Ms)−1) and D = 3 × 10⁻¹⁰ m2s−1 for Ca2+, the equation is expressed as:
 |
(1b) |
where a = 2,750 m−2A−1 (or 2,750 μM nm/pA) and b = 6 nm. Examination of equations 1a and 1b reveals that the Ca2+ concentrations at the A- and I2-sites ([Ca2+]A and [Ca2+]I2, respectively) will have linear dependencies on ICa.
 |
(2) |
 |
(3) |
A similar equation (Eq. 4) is used for [Mg2+] at the A-site:
 |
(4) |
The values of the parameters, XCa, YCa, and XMg, were determined from fits of the model to the experimental data.
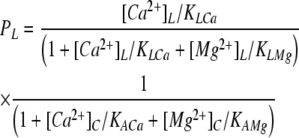
Ca2+ Activation Sites (A- and L-Sites).
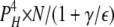
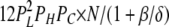
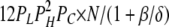
Previous work by Zahradnik et al. (2005) established that each subunit has independent Ca2+ sites that cause channel opening by an allosteric mechanism. We have incorporated these findings into the gating model for luminal and cytoplasmic Ca2+ and Mg2+ (Fig. 10, scheme 1). In this model, the pairs of open and closed states (C↔O) are associated with particular subunit stoichiometries of the RYR (i.e., particular combinations of subunits with bound sites). The Ca2+ and Mg2+ dependencies in gating arise from the transition rates between different subunit stoichiometries (Fig. 10, scheme 1, asterisks), whereas the rates within each C↔O pair are independent of Ca2+ and Mg2+.
Figure 10.

Kinetic schemes for luminal-triggered Ca2+ feedthrough. Ca2+ activation (scheme 1, A- and L- sites) and Ca2+ inactivation (scheme 3, I1 and I2-sites). Each pair of open and closed states is associated with different functional states of individual RYR2 subunits, and the numbers refer to the entries in Table IV describing these stoichiometries. Asterisks indicate changes in subunit stoichiometry, and these depend on binding of Ca2+ or Mg2+. Also shown are their corresponding simplified schemes (schemes 2 and 4) and the overall scheme (scheme 5) resulting from the combined action of activation and inactivation. The reaction rates in scheme 5 have complex dependencies on [Ca2+] and [Mg2+], and these are derived in Eqs. 2–13. Reaction rates that depend on the Ca2+ and Mg2+ concentrations at the cytoplasmic pore mouth will depend on the permeability of these ions in the channel (Eqs. 1–4). Hence, they are given subscripts “o” and “c” to indicate the different rates associated with open and closed channels, respectively. In scheme 5, the open and closed status of the channel associated with each kinetic state is indicated by the subscripts “O” and “C,” respectively.
From the following data, we derive a scheme for the way in which the binding of Ca2+ and Mg2+ to the A- and L-sites promotes high opening frequencies (H), low opening frequencies (L), or channel closures (C) (Table II A, H and L states are not the same as the H and L gating modes of the RYR analyzed by Zahradnikova and Zahradnik [1995]). (1) Both [Ca2+]L and [Ca2+]C trigger channel openings, and [Mg2+]L and [Mg2+]C exhibit competitive inhibition (Figs. 3 and 8). This indicates that the A- and L-sites cause channel opening in response to Ca2+ binding, and Mg2+ inhibits by competing with Ca2+ at these sites. (2) [Ca2+]C can trigger channel openings at high rates (1 kHz in Fig. 7 A), whereas the maximum for [Ca2+]L alone is much lower (10 Hz in Figs. 3 B, 4 B, and 8 C). This indicates that the A-site can promote high activity, whereas the L-site can only promote low activity. (3) Although [Mg2+]L inhibits triggering of the channel by [Ca2+]L, it does not prevent its triggering by [Ca2+]C (Fig. 6 A, □ and •). Thus, Ca2+ binding to the A-site will open the channel regardless of the Ca2+ or Mg2+ occupancy of the L-site. (4) Cytoplasmic Mg2+ decreases Fo regardless of luminal [Ca2+] (Fig. 8 C), indicating that at the L-site, Mg2+ inhibits simply by preventing luminal Ca2+ activation, whereas Mg2+ binding to the A-site will close the channel even if Ca2+ is bound to the L-site. From this functional matrix (see Table II A), one can calculate the probability that each subunit will contribute to high activity, low activity, and closed states of the channel, PH, PL, and PC, respectively.
 |
(5) |
 |
(6) |
 |
(7) |
where the K terms are the Ca2+ and Mg2+ binding affinities for the A- and L-sites as indicated by the subscripts.
TABLE II.
A Summary of the Functional Outcomes of the Various Binding States of the Luminal L-Site and the Cytoplasmic A- and I2-Sites Derived from the Data
| A | A-site | |||||
|---|---|---|---|---|---|---|
| Ca2+
|
empty
|
Mg2+
|
||||
| L-site | Ca2+ | H | L | C | ||
| empty | H | C | C | |||
| Mg2+ | H | C | C | |||
| B | I2-site | |||||
| Ca2+
|
empty
|
Mg2+
|
||||
| I | O | I | ||||
(A) Three levels of channel activity are promoted by the A- and L-sites. H, high Fo state; L, low Fo state; C, closed channels. Ca2+ binding to the A-site lead to high activity, whereas Mg2+ binding causes channel closure regardless of the state of the L-site. In the absence of ion binding to the A-site, Ca2+ binding to the L-site generates low activity, whereas Mg2+ binding leaves the channel closed. (B) The binding of either Ca2+ or Mg2+ to the open channel (O) is considered to promote channel inactivation (I). The activity of the channel depends on the number of subunits in each state (see Tables III and IV).
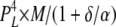
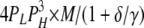
Here, we present [Ca2+]C dependencies of τo and Fo over an extended range (six orders of magnitude) to reveal new aspects of luminal and cytoplasmic Ca2+ activation. This data provides several clues about how the A-sites on each of the four RYR subunits contribute to channel gating. The fact that Fo increases as the third power of [Ca2+]C over the range of 1–10 μM (Fig. 7 A) suggests that Ca2+ needs to be bound to A-sites on three subunits to trigger channel opening. It also appears that several subunits are involved in [Ca2+]L activation because the Hill coefficients for Fo are ∼2 (Table I). The synergistic action of [Ca2+]C and [Ca2+]L on Fo in the [Ca2+]C range of 1–100 nM and the lack of any dependence of Fo on [Ca2+]L at high [Ca2+]C indicate the existence of specific cooperative interactions between the luminal- and cytoplasmic-triggered gating mechanisms (see below). Finally, the large increase in τo at high [Ca2+]C (Fig. 7 B) points to a stabilizing of the open conformation occurring when Ca2+ is bound to A-sites on all four subunits. To account for all these properties, we propose a gating scheme in which the gating mechanism has (1) a high opening rate (γ = 60 s−1) when either three or four subunits are in the H state (see Table II A for the conditions for the H, L, and C states), (2) an intermediate opening rate (β = 7 s−1) when at least three subunits are not in the C state and at least one subunit is in the H state, and (3) a low opening rate (α = 1 s−1) when no subunits are in the H state but at least three are in the L state. The closing rate of the gating mechanism is relatively fast (δ = 1,500 s−1) when three or fewer subunits are in the H state and slow (ε = 1.5 s−1) when all four are in the H state. It has been shown (Laver, 2007a) that opening rate associated with the L-site is voltage dependent. This effect can be accommodated in the model by introducing a voltage dependence in α and β (Fig. 10). The various subunit stoichiometries, their probabilities, and associated opening and closing rates are summarized in Table III.
TABLE III.
The RYR2 Activation Associated with Various Combinations of Functional States among Its Four Subunits
| Subunit stoichiometry |
i | Opening rate constant, RO |
Closing rate constant, RC |
Probability of stoichiometry PS |
Probability of stoichiometry given closed, PSC |
Probability of stoichiometry given open, PSO |
|---|---|---|---|---|---|---|
| 4L 0H | 1 | α | δ |  |
 |
 |
| 3L 1H | 2 | β | δ |  |
 |
 |
| 2L 2H | 3 | β | δ |  |
 |
 |
| 1L 3H | 4 | γ | δ |  |
 |
 |
| 0L 4H | 5 | γ | ε |  |
 |
 |
| 3L 0H 1C | 6 | α | δ |  |
 |
 |
| 2L 1H 1C | 7 | β | δ |  |
 |
 |
| 1L 2H 1C | 8 | β | δ |  |
 |
 |
| 0L 3H 1C | 9 | γ | δ |  |
 |
 |
| others | 10 | 0 | δ |  |
 |
0 |
 |
 |
To calculate mean open and closed times, the gating scheme for the A- and L-sites can be simplified to the two states shown in Fig. 10 (scheme 2). To calculate the total opening and closing rates of the A-site, we use the simplifying assumption that the transition rates between stoichiometries are faster than the O↔C transitions. Estimates of the Ca2+ on and off rates at the A-site are 2 × 10⁸ (Ms)−1 and 200 s−1, respectively (Schiefer et al., 1995), suggesting that the O↔C transition rates are not likely to be slower than those for transitions between stoichiometries. Hence, we approximate the total opening and closing rates, α' and δ', respectively, by the sums of the rates (the R terms) associated with the 10 subunit stoichiometries (PS; Table III) weighted by the open and closed state probabilities (PSO and PSC, respectively).
 |
(8) |
 |
(9) |
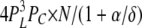
Ca2+ Inactivation Sites (I1- and I2-Sites).
The cytoplasmic I2-site was found to underlie the marked reductions in τo that occur with increasing [Ca2+]C in the presence of elevated [Ca2+]L (Figs. 7 B, ○, and 9 B, ○) (Laver, 2007a). Although we were unable to resolve an effect of Mg2+ binding to the I2-site in this study (see below), we make the initial proposition that inactivation is promoted when either Ca2+ or Mg2+ bind to the I2-site (Table II B). The probability that each subunit will contribute to inactivation (I), PI, is given by:
 |
(10) |
 |
(11) |
In this study, we found a substantial decrease in τo between 0.1 and 10 μM [Ca2+]C, followed by an increase in τo at [Ca2+]C above 10 μM (e.g., Fig. 7 B, ○). This onset and alleviation of inactivation could be explained by a model in which inactivation occurs when the I2-sites on three subunits are occupied (θ = 800 s−1) but not when sites are occupied on all four subunits (λ = 0). The subunit stoichiometries associated with the I2-sites, their probabilities, and associated opening and closing rates are summarized in Table IV. The gating scheme can be simplified to the two states shown in Fig. 10 (scheme 4) in which the opening and closing rates, φ' and θ', respectively, are given by:
 |
(12) |
 |
(13) |
TABLE IV.
The RYR2 Inactivation Associated with Various Combinations of Functional States among Its Four Subunits
| Subunit stoichiometry |
i | Opening rate constant, RO |
Closing rate constant, RC |
Probability of stoichiometry PS |
Probability of stoichiometry given closed, PSC |
Probability of stoichiometry given open, PSO |
|---|---|---|---|---|---|---|
| 3I 1O | 1 | φ | θ |  |
 |
 |
| 4I 0O | 2 | φ | λ |  |
 |
 |
| others | 3 | φ | 0 |  |
0 |  |
 |
 |
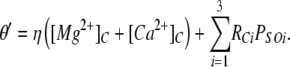
We find that as [Ca2+]C is increased to mM levels, τo decreases again as a result of the I1-site. Even though the degree of Ca2+/Mg2+ inhibition is minor at 1 mM (<10% change in Po; not depicted), it has a substantial effect on τo. The contribution of the I1-site to inactivation is included in the model as an additional empirical term in the inactivation rate involving η in Eq. 13. The existence of the I1-site has been known for some time. It was previously referred to as the I-site and was found to underlie low affinity (∼10 mM) Mg2+ inhibition (Laver et al., 1997). Because the effects of this site are minor, we have not developed a full allosteric scheme for this gating mechanism.
The combined effects of activation and inactivation mechanisms in schemes 2 and 4 in Fig. 10 were calculated by combining these into a four-state scheme (Fig. 10, scheme 5). The theoretical mean opening frequency (1/τc) and mean open times were calculated from scheme 5 using the Q-matrix method of Colquhoun and Hawkes (1981 and 1987). The tetrameric luminal-triggered Ca2+ feedthrough model accounts for the [Ca2+]L, [Ca2+]C, and voltage dependencies of Po, τo, and Fo (solid and dashed curves in Figs. 3, 4, and 6–9). The model was also able to account for quite complex [Ca2+]L and [Ca2+]C dependencies of the RYR gating properties and fitted the increase in τo at [Ca2+]C > 10 μM (Figs. 7 B, ○ and •, and 8 B, ○) without the benefit of an adjustable parameter. The model parameters (Table V) are only slightly different to the values quoted for the empirical predecessor of this model (Laver, 2007a; the data obtained here is consistent with this previous study).
TABLE V.
Parameters of the Luminal-triggered Ca2+ Feedthrough Model
| Affinity | Opening rates |
Closing rates |
Feedthrough | |
|---|---|---|---|---|
| L-site | KCaL = 40 μM | |||
|
KMgL = 40 μM
|
α = 1 s−1a | |||
| β = 7 s−1a | δ = 1,500 s−1 | |||
| A-site | KCaA = 1.2 μM | γ = 60 s−1 | ε = 1.5 s−1 | XCa = 12 μM/pA |
| KMgA = 60 μM | XMg = 120 μM/pA | |||
| I2-site | KCaI = 1.2 μM | φ = 800 s−1 | θ = 1,000 s−1 | YCa = 0.35 μM/pA |
| KMgI unknown | λ = 0 s−1 | |||
| I1-site | η = 1.5 ×10⁵ (Ms)−1 |
Mg2+ Inhibition of RYR2.
The model accounts for luminal and cytoplasmic Mg2+ inhibition using an additional three free parameters (solid and dashed curves in Figs. 3, 4, 6, 8, and 9). The Mg2+ affinity parameter for the A-site (KMgA in Eqs. 5 and 6) was adjusted until the model fitted the [Mg2+]C dependencies of τo and Fo (Figs. 8, A and B, and 9, C and D). The parameter for Mg2+ affinity of the L-site (KMgL in Eqs. 5 and 6) was determined by fitting the model to the [Mg2+]L dependency of Fo (Figs. 3 B and 4 B). We then calculated the parameter associated with Mg2+ feedthrough (XMg in Eq. 4) by fitting the voltage/[Mg2+]L dependencies of τo (Figs. 4 C and 6 B). Although there were no free parameters in the model for fitting the [Mg2+]L dependencies of Fo in Fig. 6 A (□ and •), the model did fit the data at [Ca2+]C = 3 μM fairly well, but it overestimated Mg2+ inhibition at [Ca2+]C = 10 μM. This probably reflects the existence of subtle inter-subunit interactions in the RYR that are not included in the current model. We were unable to detect any inhibition of RYR2 resulting from Mg2+ binding to the I2-site. The reason for this is that Mg2+ has a strong inhibitory effect at the A-site that probably masks any effect that it has at the I2-site. We found that adjusting the Mg2+ affinity of the I2-site in the model did not influence the overall fit of the model to the data. Therefore, we have assumed that Mg2+ binding to the I2-site did not have a significant role in regulating RYRs in bilayer or in the cell and have omitted this binding reaction from the model. The model parameters are listed in Table V. The binding of Mg2+ at the I1-site accounted for a modest reduction in τo (Figs. 7 B and 8 B) in the presence of elevated (1 mM) [Mg2+]C. The parameter associated with Mg2+ inhibition at the I1-site (η) was determined by Ca2+ inhibition at high [Ca2+]C so that is was not a free parameter for fitting the model to Mg2+ inhibition.
Alternative Models.
The fact that Fo was dependent on both [Ca2+]C and [Ca2+]L could not be explained by the independent triggering of channel openings by the A- and L-sites as proposed in the previous study (Laver, 2007a). According to that model, Fo should be virtually independent of [Ca2+]C over the range of 1–100nM when [Ca2+]L is in the range of 100–1,000 μM.
We also investigated schemes in which Ca2+ binding at either A- or L-sites modified either the affinity and/or gating rates associated with the contra-lateral site. However, these models predicted that a [Ca2+]L increase from 10 to 100 μM would cause a 10-fold increase in Fo in the presence of [Ca2+]C in excess of 10 μM, whereas our data shows that the effect of [Ca2+]L is very small once [Ca2+]C exceeds 1 μM.
Our proposal that the channel opens when three or more subunits get activated via L- or A-sites fitted well with the data. We also explored a model in which channel openings could be triggered by combinations of at least two active subunits and another model where four active subunits were required for a channel opening. These models could not fit simultaneously the [Ca2+]C dependencies of τo and Fo. In the case when two subunits could trigger an opening, we were unable to generate an increase in τo as [Ca2+]C increased from zero to 1 μM at the same time as fitting the [Ca2+]C dependencies of Fo. When four subunits were required to trigger openings, we were unable to generate any increase in τo with increasing [Ca2+]C.
DISCUSSION
The data reveals a multiplicity of mechanisms by which luminal and cytoplasmic Ca2+ and Mg2+ can regulate RYR2. We show that Ca2+/Mg2+ regulation of RYR2 involves two Ca2+ activation mechanisms (L- and A-sites) and two inactivation mechanisms (I1- and I2-sites) associated with different parts of the RYR molecule (Fig. 1). Mg2+ in either the cytoplasm or SR lumen inhibits RYR2 by binding to the L-, A-, and I1-sites. Mg2+ binding to the L-site has not been previously identified, and this study makes the first measurement of its Mg2+ affinity. We find that the L-site is nonselective with an affinity of 40 μM for both Ca2+ and Mg2+.
There are some important differences in how luminal and cytoplasmic Ca2+ activation mechanisms operate in RYR2. First, there is two orders of magnitude difference in the maximal opening frequencies attainable with the L- and A-sites. Second, the A-site has a relatively high (1.2 μM) Ca2+ affinity, which is ∼50-fold selective for Ca2+ over Mg2+, whereas the L-site has the same low affinity for Ca2+ and Mg2+. Finally, Mg2+ has different inhibitory actions at the A- and L-sites. Mg2+ at the L-site inhibits simply by preventing luminal Ca2+ activation, whereas Mg2+ binding to the A-site will close the channel even if Ca2+ is bound to the L-site. Therefore, just like we have previously seen in skeletal RYRs (Laver et al., 2004), Mg2+ at the A-site is an antagonist that does not simply prevent Ca2+ activation; it closes the channel even if it has been opened by another process (e.g., L-site activation).
Models incorporating several subunit interaction schemes were tested (see Results), but the only scheme that fitted the data was one in which channel activation or inactivation required ion binding to corresponding sites on at least three subunits. The same requirement for three subunits has also been reported for cytoplasmic activation of the IP3R calcium release channels (Shuai et al., 2007), indicating that similar molecular mechanisms may underlie gating in these closely related channels. Here, we develop the first subunit-based model for both luminal and cytoplasmic regulation of any Ca2+ release channel type. The synergistic activation by luminal and cytoplasmic Ca2+ was explained by a process in which channel opening required at least three active subunits where each subunit may be activated from both luminal and cytoplasmic sides. Although the molecular structure of the divalent cation sites has not been determined, bilayer studies have showed that the luminal proteins, calsequestrin, triadin, and junctin, play an important role in regulating the RYR2 response to luminal Ca2+ (Gyorke et al., 2004). RYR2 incorporated into lipid bilayers from SR vesicles appear to retain their association with these luminal proteins (Gyorke et al., 2004, and Beard, N.A., personal communication). Therefore, the Ca2+/Mg2+ mechanisms of RYRs explored in this study should encompass the regulatory actions of those co-proteins.
Accessibility of Cytoplasmic Sites to Luminal Ca2+ and Mg2+
Several studies have now proposed that divalent ions on the luminal side of the membrane can flow through the pore and bind to sites on the cytoplasmic domain of the RYR and regulate channel activity. This proposal is based on several lines of evidence. First, RYR sensitivities to both activation and inhibition by luminal Ca2+ are closely correlated with the magnitude of Ca2+ feedthrough (Tripathy and Meissner, 1996; Laver, 2007a). Biasing the membrane voltage against Ca2+ feedthrough reduces the Ca2+ sensitivities of activation and inhibition. Second, heavy Ca2+ buffering of the cytoplasmic bath alleviates inactivation by luminal Ca2+, indicating that luminal Ca2+ must be traversing the cytoplasmic solution to reach the inactivation site (Tripathy and Meissner, 1996). Finally, the effects of luminal and cytoplasmic Ca2+ are not additive, indicating that Ca2+ competes for the same activating and inactivating sites from opposite sides of the membrane (Laver, 2007a).
We can estimate the distances of the A- and I2-sites from the pore mouth by substituting the experimentally derived ratios of local [Ca2+]/ICa at each site (XCa and YCa in Table V) into Eq. 1b and solving for the variable r in each case. Thus, we estimate that the A- and I2-sites are 16.5 and 34 nm from the pore, respectively. Given that the RYR protein does not extend beyond 20 nm from the pore mouth, it is likely that the I2-site involves inhibitory effects via interacting accessory proteins. A candidate for this is calmodulin, which has been shown to cause Ca2+-dependent inactivation of cardiac RYRs in lipid bilayers (Xu and Meissner, 2004).
Here, we have used the antagonistic effects of Ca2+ and Mg2+ on τo to provide stronger tests for the presence of feedthrough-mediated regulation of the channel (during openings it is possible for luminal Ca2+ and Mg2+ to have access to cytoplasmic domains of the RYR via the pore). Our data (Fig. 8 B) and those of others (Xu and Meissner, 1998) have shown that in the presence of ATP, τo increases with increasing cytoplasmic [Ca2+] and upon the addition of cytoplasmic Mg2+, it decreases τo in a competitive manner. We now show that luminal Mg2+ also decreases τo and that this is alleviated by cytoplasmic Ca2+ (Fig. 6 B), indicating that cytoplasmic Ca2+ and luminal Mg2+ compete for a common site (the A-site). In the converse experiment, we found that luminal Ca2+ alleviated the effect of cytoplasmic Mg2+ on τo (Fig. 8 B). These results clearly demonstrate that Ca2+ and Mg2+ compete from opposite sides of the open channel. Moreover, in agreement with the findings of Xu and Meissner (1998), we find that the effect of luminal Mg2+ on τo is abolished when the membrane potential is biased against Mg2+ feedthrough (Fig. 4 C). Collectively, these results strongly support the existence and importance of feedthrough regulation of RYR2 in vitro.
Efficacy of Luminal Ca2+ Activation Is Increased by Cytoplasmic Agonists and Reduced by Antagonists
A clear pattern is emerging in which cytoplasmic and luminal regulation of RYRs are closely linked. The results here and those of our recent studies (Laver, 2007a, 2008) suggest that this link occurs via two distinct mechanisms. First, activation of subunits by luminal Ca2+ may reduce the number of subunits that need to be activated by cytoplasmic agonists to achieve channel opening. This accounts for the synergy we observe in [Ca2+]L and [Ca2+]C activation and how this is antagonized by [Mg2+]C. It is possible that the same inter-subunit processes underlie the ability of other cytoplasmic regulators to modify the responsiveness of RYR2 to [Ca2+]L. Second, luminal Ca2+ can alter τo via Ca2+ feedthrough to the A-site. The luminal-triggered Ca2+ feedthrough model predicts that any antagonist that shortens channel openings triggered by cytoplasmic Ca2+ (the A-site) will reduce RYR activation by luminal Ca2+. The converse has already been found to hold true for the cytoplasmic agonists ATP (Laver, 2007a) and activating peptide DPc10 (Laver et al., 2008), which increase [Ca2+]L activation of RYRs by lengthening channel openings triggered by [Ca2+]C. ATP was found to increase τo in response to Ca2+ binding at the A-site. The model calculations showed that Ca2+ feedthrough could fully account for marked increase in the [Ca2+]L dependence of τo (Fig. 9 B, ○ and dashes). Moreover, in the presence of ATP, [Mg2+]C, which reduces τo by shifting its [Ca2+]C dependence to higher concentrations (Fig. 8 B), reduces the [Ca2+]L dependence of τo (Fig. 9 B, ○ and •), and this effect of [Mg2+]C is in close alignment with predictions of the model.
Physiological Implications
Applying the Model to Ca2+ Release in Cardiomyocytes.
To gain an understanding of how RYRs might be regulated by Ca2+ and Mg2+ in cardiomyocytes, we extrapolate the luminal-triggered feedthrough model to the physiological situation. This is done here in four respects: (1) The free concentrations of Mg2+ in the cytoplasm and lumen are both set to 1 mM to match the likely intracellular concentrations (see Introduction); (2) The membrane potential across the SR membrane is considered to be zero. Although this has not been directly measured, electron probe analyses indicate that SR potentials are near zero at rest and during tetanus in skeletal muscle (Somlyo et al., 1981; Baylor et al., 1984); (3) Feedthrough of Ca2+ and Mg2+ was calculated in the presence of 150 mM K+ rather than the 250 mM Cs+ used in the bilayer experiments. ICa and IMg calculated in the presence of K+ were only 10% larger that those in the presence of Cs+; and (4) The values of the Ca2+ feedthrough parameters were set according to predictions of diffusion theory (Stern, 1992) for the Ca2+ buffering conditions in the cytoplasm as follows: In the cell, the cytoplasmic Ca2+ buffering is believed to be equivalent to that provided by ∼0.05 mM EGTA (Fabiato, 1983), and the Ca2+ binding rates for intracellular buffers (k = 108 (Ms)−1; Sipido and Wier, 1991) are 17-fold slower than for BAPTA, which was used in the bilayer experiments. Incorporating these cellular buffering parameters values into Eq. 1a gives [Ca2+]r = 2750 × ICa/r. (Note that the exponential term in Eq. 1a vanishes because k is very large.) By substituting the values of r for the A- and I2-sites (see above), we get the cellular values for XCa = 2,750/16.5 = 167 μM/pA and YCa = 2,750/34 = 80 μM/pA. Therefore, the concentrations of Ca2+ reaching the A- and I2-sites on the RYR as a result of feedthrough will be >10-fold higher in cardiomyocytes than in these bilayer experiments.
Luminal [Ca2+] Dependence of RYR Is Different in Diastole and Systole.
Fig. 11 (A and B) shows the model predictions of the dependence of Fo and τo on [Ca2+]L in the SR at diastole ([Ca2+]C = 0.1 μM). The opening frequency increases fourfold with increasing [Ca2+]L over the physiological range (0.3–1 mM), whereas the increase in τo is 1.8-fold over this range. Collectively, these data indicate that the open probability of RYRs increases approximately eightfold between 0.3 and 1 mM [Ca2+]L. Note that under diastolic conditions the RYR opening frequency is extremely low (<3.0 × 10⁻⁴ s−1) and equates to less than one channel opening per hour, far too infrequent to be reliably measured in bilayer experiments. Examination of the legend for Fig. 11 reveals that these low triggering rates are due both to the lack of stimulation by the low [Ca2+]C (0.1 and 1 μM [Ca2+]C) and to the strong inhibitory effect of 1 mM [Mg2+]C.
Figure 11.

Theoretical predictions of RYR2 modulation by free Ca2+ in the SR lumen. The calculations are derived from application of the luminal-triggered feedthrough model to the physiological context as described in the Discussion (Physiological implications). (A and B) The effect of various factors on the opening frequency, Fo, normalized to their values at [Ca2+]L = 1 mM and mean open time, τo, of RYRs. See below for the absolute values of Fo at [Ca2+]L = 1 mM for each condition. Diastolic conditions ([Ca2+]C = 0.1 μM) and systole ([Ca2+]C = 1 μM; in B both lines coincide). The contribution of various factors is seen by setting associated parameters to zero (dashed lines). For Ca2+ feedthrough, the Ca2+ current was set to zero (ICa = 0). Elimination of luminal Mg2+ inhibition ([Mg2+]L = 0 and 0.2 mM; they coincide with the thick line in B). Elimination of cytoplasmic Mg2+ inhibition from the I1- and A- sites ([Mg2+]C = 0) and from the I1-site only (–I1). (C and D) The effects of perturbing A- and L-sites on SR load dependence of Fo and τo under diastolic conditions (solid line, KACa = 1.2 μM and KLCa = 40 μM). Dashed lines show the effect of increasing Ca2+ sensitivities of either the A-site (KACa = 0.6 μM) or L-site (KLCa = 15 μM; in B this coincides with the solid line). (A and B) [Ca2+]C = 0.1 μM (normalizing factor, 3.0 × 10⁻⁴); [Ca2+]C = 1 μM (normalizing factor, 2.9 × 10⁻²); [Mg2+]C = 0 (normalizing factor, 1.07); [Mg2+]L = 0 (normalizing factor, 1.2 × 10⁻³); [Mg2+]L = 0.2 (normalizing factor, 0.8 × 10⁻³); -I1 site (normalizing factor, 2.9 × 10⁻⁴); ICa = 0 (normalizing factor, 1.6 × 10⁻⁴).
During systole ([Ca2+]C =1 μM), the model predicts that Fo varies by <20% over the physiological [Ca2+]L. This is because at 1 μM [Ca2+]C, the A-sites on three or more subunits have Ca2+ bound so that the A-site alone is sufficient to trigger openings and consequently the channel opening rates are independent of luminal Ca2+.
Luminal Mg2+ Is the Main Contributor to Store Load Dependence of RYR Activity in Diastole.
What is particularly striking in Fig. 11 A is the weakening of the [Ca2+]L dependence of Fo when Mg2+ is removed from the SR lumen ([Mg2+]L = 0). Although Fo at 1 mM [Ca2+]L is elevated approximately fourfold, its relative dependence on [Ca2+]L is reduced to only 20% over the physiological range. The reason for this is that the Ca2+ occupancy of the L-site determines the [Ca2+]L dependence of Fo, but in the absence of luminal Mg2+ this site is saturated at physiological [Ca2+]L and generates channel openings at a nearly constant maximal rate between 0.3 and 1 mM. However, in the presence of 1 mM [Mg2+]L, the apparent affinity of the L-site for Ca2+ is raised from 40 μM to 1 mM, causing Fo to increase over this concentration range. Because [Mg2+]L has not been measured, we examined the range of [Mg2+]L that could retain a substantial [Ca2+]L dependence on Fo. Even if the SR lumen only contained 0.2 mM Mg2+, the model predicts that there would be a [Ca2+]L dependence on Fo nearly as large as that seen at [Mg2+]L = 1 mM ([Mg2+]L = 0.2; Fig. 11 A). The removal of luminal Mg2+ had no effect on τo and, the [Ca2+]L dependence of τo at zero [Mg2+]L in Fig. 11 B is obscured by the line for the [Ca2+]L dependence in the presence of 1 mM [Mg2+]L. Thus, the model predicts that luminal Mg2+ is a strong contributor to the store load dependence of Fo but not τo.
The removal of cytoplasmic Mg2+ caused a 300-fold increase in Fo (from 3.0 × 10⁻⁴ s−1 to 1.07 s−1; Fig. 11 legend; [Mg2+]C = 0) and a 10-fold increase in τo. However, in spite of this strong effect, [Mg2+]C did not contribute to the relative [Ca2+]L dependence of channel activity as this form of Mg2+ inhibition was the same over the physiological [Ca2+]L range.
Ca2+ and Mg2+ Micro-domains Are Minor Contributors to the Store Load Dependence of Host Channel Activity.
We used the model to examine the role of feedthrough on the activity of the channel passing the ions. Tinker's permeation model (Tinker et al., 1992) predicts that the Ca2+ current through a single RYR during Ca2+ release will be ∼1 pA per mM of [Ca2+]L, which we expect to cause the cytoplasmic Ca2+ levels to rise to 167 μM/mM [Ca2+]L at the A-site and 80 μM/mM [Ca2+]L at the I2-site. The contribution of Ca2+ feedthrough can be seen by comparing the solid curve with the dashed curve (labeled ICa = 0 in Fig. 11 B) showing τo when Ca2+ feedthrough is set to zero. Ca2+ feedthrough increased τo by up to 10-fold and produced the [Ca2+]L dependence of τo. Although Ca2+ feedthrough had a large effect on τo, it is only a minor contributor to the [Ca2+]L dependence of overall RYR activity as it had no effect on Fo (Fig. 11 A) so that even in the absence of feedthrough, RYR open probability would retain most of its dependence on [Ca2+]L.
Based on estimates of Somlyo et al. (1985), the Mg2+ current through the RYR is approximately half that of the Ca2+ current. The model predicts that perturbations in the [Mg2+] near the A-site will be 120 μM/pA of Mg2+ current. Even if the Mg2+ current is as large as the Ca2+ current itself, feedthrough of Mg2+ is unlikely to cause a [Mg2+] perturbation >120 μM near any of the Ca2+ sites. Consequently, Mg2+ feedthrough will not make a big enough relative change in [Mg2+] at any sites to have an effect on Ca2+ release.
Luminal Activation Can Be Increased by Changes in Either L- or A-Site.
RYR2 mutations associated with sudden cardiac death are known to enhance activation by luminal Ca2+ (Jiang et al., 2005). Many of these mutations are known to reside in the cytoplasmic domains of the RYR, which raises the question of how can luminal activation be increased by cytoplasmic mutations (George et al., 2007). The model predicts that the enhanced luminal activation of mutant RYR2 may result from changes in gating associated with either luminal (L-site) or cytoplasmic (A-site) domains of RYR2. This is shown in Fig. 11 for the case where the affinities of these sites to Ca2+ were increased. The solid line shows the dependencies of Fo (Fig. 11 C) and τo (Fig. 11 D) for RYRs studied here. The dashed lines show the predicted outcomes if the Ca2+ affinity of the A-site is changed from 1.2 to 0.6 μM or the affinity of the L-site is changed from 40 to 15 μM. In both cases, the [Ca2+]L dependence of Fo increased as a result of the synergistic interactions between RYR2 subunits. The channel open time was only affected by a change in the A-site, which increased channel open times in conjunction with Ca2+ feedthrough.
Concluding Remarks.
Bilayer experiments have revealed a multiplicity of mechanisms by which luminal and cytoplasmic Ca2+ and Mg2+ can regulate RYR2. However, processes that play an important role in RYR gating in bilayer experiments are not necessarily important for store load–dependent regulation of Ca2+ release in cardiomyocytes. The role of ion feedthrough depends on the creation of dynamic micro-domains of Ca2+ and Mg2+ at the cytoplasmic face of the channel. Feedthrough of Mg2+ contributed to RYR inhibition via τo in the bilayer experiments but is unlikely to play a significant role in the cell because of the high ambient [Mg2+]. The model predicts that Ca2+ micro-domains do play a role in stimulating RYR activity. Although much has been made of Ca2+ feedthrough in regard to luminal activation of RYRs in bilayer experiments, we find that it is not likely to be the main contributor to store load dependence of Ca2+ release in vivo. A more substantial contributor to this is luminal Mg2+, which competes with Ca2+ for the L-site. Even though the Mg2+ concentrations within the cell are relatively constant, luminal triggering of RYR2 is an interplay between Ca2+ and Mg2+ where increased luminal [Ca2+] leads to displacement of Mg2+ from the L-site. Thus, the inhibitory effects of Mg2+ vary during the cardiac cycle because the effects of Mg2+ are quite different between diastole and systole. In the absence of Mg2+, the L-site would saturate at sub-physiological [Ca2+]L causing a loss of luminal regulation of RYR activity at physiological [Ca2+]L and SR depletion.
At present, it is unclear what precise concentrations of Mg2+ exist in the SR and how [Mg2+]L changes throughout the cardiac cycle. We demonstrate the robustness of our predication that luminal Mg2+ is important to load dependent Ca2+ release by showing that this prediction is valid over the [Mg2+]L range of 0.2–1 mM; a range likely to bracket physiological concentration. Nevertheless, this study highlights the importance of gaining precise measurements of the free Ca2+ and Mg2+ concentrations in the SR lumen.
This study elucidates several new aspects of the close link between luminal and cytoplasmic regulation of RYRs reported in many studies. The synergy we observe between [Ca2+]L and [Ca2+]C activation can be understood in terms of molecular processes that may equally apply to transmembrane synergies between other regulators of RYRs. The model, which explains this synergy, also predicts that regulation of RYR2 activity by store load can result from changes in gating associated with either luminal or cytoplasmic Ca2+ activation sites on the channel protein, thus providing an explanation for how luminal Ca2+ activation of RYRs is increased by mutations in their cytoplasmic domains.
Acknowledgments
Thanks to Professor Graham Lamb for critically reading the manuscript and to Paul Johnson and Katherine Bradley for assisting with the experiments.
B.N. Honen was supported by an NH&MRC grant 234420, and D.R. Laver was supported by a Senior Brawn Fellowship from the University of Newcastle and by an infrastructure grant from NSW Health through Hunter Medical Research Institute.
Lawrence G. Palmer served as editor.
Abbreviations used in this paper: BAPTA, 1,2-bis(o-aminophenoxy)ethane-N,N,N',N'-tetraacetic acid; E–C, excitation–contraction.
References
- Baylor, S.M., W.K. Chandler, and M.W. Marshall. 1984. Calcium release and sarcoplasmic reticulum membrane potential in frog skeletal muscle fibres. J. Physiol. 348:209–238. [DOI] [PMC free article] [PubMed] [Google Scholar]
- Bers, D.M. 2001. Excitation-contraction coupling and cardiac contractile force. Kluwer Academic Publications, Dordrecht, Netherlands. 426 pp.
- Brooks, S.P., and K.B. Storey. 1992. Bound and determined: a computer program for making buffers of defined ion concentrations. Anal. Biochem. 201:119–126. [DOI] [PubMed] [Google Scholar]
- Colquhoun, D., and A.G. Hawkes. 1981. On the stochastic properties of single ion channels. Proc. R. Soc. Lond. B. Biol. Sci. 211:205–235. [DOI] [PubMed] [Google Scholar]
- Colquhoun, D., and A.G. Hawkes. 1987. A note on correlations in single ion channel records. Proc. R. Soc. Lond. B. Biol. Sci. 230:15–52. [DOI] [PubMed] [Google Scholar]
- Eisenberg, M.J. 1992. Magnesium deficiency and sudden death. Am. Heart J. 124:544–549. [DOI] [PubMed] [Google Scholar]
- Fabiato, A. 1983. Calcium-induced release of calcium from the cardiac sarcoplasmic reticulum. Am. J. Physiol. 245:C1–C14. [DOI] [PubMed] [Google Scholar]
- Fabiato, A. 1985. Simulated calcium current can both cause calcium loading in and trigger calcium release from the sarcoplasmic reticulum of a skinned canine cardiac Purkinje cell. J. Gen. Physiol. 85:291–320. [DOI] [PMC free article] [PubMed] [Google Scholar]
- Fabiato, A., and F. Fabiato. 1977. Calcium release from the sarcoplasmic reticulum. Circ. Res. 40:119–129. [DOI] [PubMed] [Google Scholar]
- George, C.H., H. Jundi, N.L. Thomas, D.L. Fry, and F.A. Lai. 2007. Ryanodine receptors and ventricular arrhythmias: emerging trends in mutations, mechanisms and therapies. J. Mol. Cell. Cardiol. 42:34–50. [DOI] [PubMed] [Google Scholar]
- Ginsburg, K.S., C.R. Weber, and D.M. Bers. 1998. Control of maximum sarcoplasmic reticulum Ca load in intact ferret ventricular myocytes. Effects of thapsigargin and isoproterenol. J. Gen. Physiol. 111:491–504. [DOI] [PMC free article] [PubMed] [Google Scholar]
- Godt, R.E., and D.W. Maughan. 1988. On the composition of the cytosol of relaxed skeletal muscle of the frog. Am. J. Physiol. 254:C591–C604. [DOI] [PubMed] [Google Scholar]
- Gyorke, I., and S. Gyorke. 1998. Regulation of the cardiac ryanodine receptor channel by luminal Ca2+ involves luminal Ca2+ sensing sites. Biophys. J. 75:2801–2810. [DOI] [PMC free article] [PubMed] [Google Scholar]
- Gyorke, I., N. Hester, L.R. Jones, and S. Gyorke. 2004. The role of calsequestrin, triadin, and junctin in conferring cardiac ryanodine receptor responsiveness to luminal calcium. Biophys. J. 86:2121–2128. [DOI] [PMC free article] [PubMed] [Google Scholar]
- Gyorke, S., I. Gyorke, V. Lukyanenko, D. Terentyev, S. Viatchenko-Karpinski, and T.F. Wiesner. 2002. Regulation of sarcoplasmic reticulum calcium release by luminal calcium in cardiac muscle. Front. Biosci. 7:d1454–d1463. [DOI] [PubMed] [Google Scholar]
- Herrmann-Frank, A., and F. Lehmann-Horn. 1996. Regulation of the purified Ca2+-release channel/ryanodine receptor complex of skeletal muscle sarcoplasmic reticulum by luminal calcium. Pflugers Arch. 432:155–157. [DOI] [PubMed] [Google Scholar]
- Ikemoto, N., B. Nagy, G.M. Bhatnagar, and J. Gergely. 1974. Studies on a metal-binding protein of the sarcoplasmic reticulum. J. Biol. Chem. 249:2357–2365. [PubMed] [Google Scholar]
- Jiang, D., R. Wang, B. Xiao, H. Kong, D.J. Hunt, P. Choi, L. Zhang, and S.R. Chen. 2005. Enhanced store overload-induced Ca2+ release and channel sensitivity to luminal Ca2+ activation are common defects of RyR2 mutations linked to ventricular tachycardia and sudden death. Circ. Res. 97:1173–1181. [DOI] [PubMed] [Google Scholar]
- Laver, D.R. 2007. a. Ca2+ stores regulate ryanodine receptor Ca2+ release channels via luminal and cytosolic Ca2+ sites. Biophys. J. 92:3541–3555. [DOI] [PMC free article] [PubMed] [Google Scholar]
- Laver, D.R. 2007. b. Ca2+ stores regulate ryanodine receptor Ca2+ release channels via luminal and cytosolic Ca2+ sites. Clin. Exp. Pharmacol. Physiol. 34:889–896. [DOI] [PubMed] [Google Scholar]
- Laver, D.R., L.D. Roden, G.P. Ahern, K.R. Eager, P.R. Junankar, and A.F. Dulhunty. 1995. Cytoplasmic Ca2+ inhibits the ryanodine receptor from cardiac muscle. J. Membr. Biol. 147:7–22. [DOI] [PubMed] [Google Scholar]
- Laver, D.R., T.M. Baynes, and A.F. Dulhunty. 1997. Magnesium inhibition of ryanodine-receptor calcium channels: evidence for two independent mechanisms. J. Membr. Biol. 156:213–229. [DOI] [PubMed] [Google Scholar]
- Laver, D.R., E.R. O'Neill, and G.D. Lamb. 2004. Luminal Ca2+-regulated Mg2+ inhibition of skeletal RyRs reconstituted as isolated channels or coupled clusters. J. Gen. Physiol. 124:741–758. [DOI] [PMC free article] [PubMed] [Google Scholar]
- Laver, D.R., B.N. Honen, G.D. Lamb, and N. Ikemoto. 2008. A domain peptide of the cardiac ryanodine receptor regulates channel sensitivity to luminal Ca2+ via cytoplasmic Ca2+ sites. Eur. Biophys. J. 37:455–467. [DOI] [PubMed] [Google Scholar]
- Marks, P.W., and F.R. Maxfield. 1991. Preparation of solutions with free calcium concentration in the nanomolar range using 1,2-bis(o-aminophenoxy)ethane-N,N,N',N'-tetraacetic acid. Anal. Biochem. 193:61–71. [DOI] [PubMed] [Google Scholar]
- Meissner, G., E. Darling, and J. Eveleth. 1986. Kinetics of rapid Ca2+ release by sarcoplasmic reticulum. Effects of Ca2+, Mg2+, and adenine nucleotides. Biochemistry. 25:236–244. [DOI] [PubMed] [Google Scholar]
- Miller, C., and E. Racker. 1976. Ca++-induced fusion of fragmented sarcoplasmic reticulum with artificial planar bilayers. Cell. 9:283–300. [DOI] [PubMed] [Google Scholar]
- O'Neill, E.R., M.M. Sakowska, and D.R. Laver. 2003. Regulation of the calcium release channel from skeletal muscle by suramin and the disulfonated stilbene derivatives DIDS, DBDS, and DNDS. Biophys. J. 84:1674–1689. [DOI] [PMC free article] [PubMed] [Google Scholar]
- Schiefer, A., G. Meissner, and G. Isenberg. 1995. Ca2+ activation and Ca2+ inactivation of canine reconstituted cardiac sarcoplasmic reticulum Ca2+-release channels. J. Physiol. 289:337–348. [DOI] [PMC free article] [PubMed] [Google Scholar]
- Seelig, M.S. 1994. Consequences of magnesium deficiency on the enhancement of stress reactions; preventive and therapeutic implications (a review). J. Am. Coll. Nutr. 13:429–446. [DOI] [PubMed] [Google Scholar]
- Shuai, J., J.E. Pearson, J.K. Foskett, D.O. Mak, and I. Parker. 2007. A kinetic model of single and clustered IP3 receptors in the absence of Ca2+ feedback. Biophys. J. 93:1151–1162. [DOI] [PMC free article] [PubMed] [Google Scholar]
- Sipido, K.R., and W.G. Wier. 1991. Flux of Ca2+ across the sarcoplasmic reticulum of guinea-pig cardiac cells during excitation-contraction coupling. J. Physiol. 435:605–630. [DOI] [PMC free article] [PubMed] [Google Scholar]
- Sitsapesan, R., and A.J. Williams. 1994. Gating of the native and purified cardiac SR Ca2+-release channels with monovalent cations as permeant species. Biophys. J. 67:1484–1494. [DOI] [PMC free article] [PubMed] [Google Scholar]
- Sitsapesan, R., and A.J. Williams. 1995. The gating of the sheep skeletal sarcoplasmic reticulum Ca2+-release channel is regulated by luminal Ca2+. J. Membr. Biol. 146:133–144. [DOI] [PubMed] [Google Scholar]
- Sitsapesan, R., and A.J. Williams. 1997. Regulation of current flow through ryanodine receptors by luminal Ca2+. J. Membr. Biol. 159:179–185. [DOI] [PubMed] [Google Scholar]
- Somlyo, A.V., H.G. Gonzalez-Serratos, H. Shuman, G. McClellan, and A.P. Somlyo. 1981. Calcium release and ionic changes in the sarcoplasmic reticulum of tetanized muscle: an electron-probe study. J. Cell Biol. 90:577–594. [DOI] [PMC free article] [PubMed] [Google Scholar]
- Somlyo, A.V., G. McClellan, H. Gonzalez-Serratos, and A.P. Somlyo. 1985. Electron probe X-ray microanalysis of post-tetanic Ca2+ and Mg2+ movements across the sarcoplasmic reticulum in situ. J. Biol. Chem. 260:6801–6807. [PubMed] [Google Scholar]
- Stern, M.D. 1992. Buffering of calcium in the vicinity of a channel pore. Cell Calcium. 13:183–192. [DOI] [PubMed] [Google Scholar]
- Tinker, A., A.R. Lindsay, and A.J. Williams. 1992. A model for ionic conduction in the ryanodine receptor channel of sheep cardiac muscle sarcoplasmic reticulum. J. Gen. Physiol. 100:495–517. [DOI] [PMC free article] [PubMed] [Google Scholar]
- Tong, G.M., and R.K. Rude. 2005. Magnesium deficiency in critical illness. J. Intensive Care Med. 20:3–17. [DOI] [PubMed] [Google Scholar]
- Touyz, R.M. 2004. Magnesium in clinical medicine. Front. Biosci. 9:1278–1293. [DOI] [PubMed] [Google Scholar]
- Tripathy, A., and G. Meissner. 1996. Sarcoplasmic reticulum lumenal Ca2+ has access to cytosolic activation and inactivation sites of skeletal muscle Ca2+ release channel. Biophys. J. 70:2600–2615. [DOI] [PMC free article] [PubMed] [Google Scholar]
- Van Helden, D.F. 1993. Pacemaker potentials in lymphatic smooth muscle of the guinea-pig mesentery. J. Physiol. 471:465–479. [DOI] [PMC free article] [PubMed] [Google Scholar]
- Van Helden, D.F., and M.S. Imtiaz. 2003. Ca2+ phase waves: a basis for cellular pacemaking and long-range synchronicity in the guinea-pig gastric pylorus. J. Physiol. 548:271–296. [DOI] [PMC free article] [PubMed] [Google Scholar]
- Venetucci, L.A., A.W. Trafford, S.C. O'Neill, and D.A. Eisner. 2008. The sarcoplasmic reticulum and arrhythmogenic calcium release. Cardiovasc. Res. 77:285–292. [DOI] [PubMed] [Google Scholar]
- Vinogradova, T.M., V.A. Maltsev, K.Y. Bogdanov, A.E. Lyashkov, and E.G. Lakatta. 2005. Rhythmic Ca2+ oscillations drive sinoatrial nodal cell pacemaker function to make the heart tick. Ann. NY Acad. Sci. 1047:138–156. [DOI] [PubMed] [Google Scholar]
- Xu, L., and G. Meissner. 1998. Regulation of cardiac muscle Ca2+ release channel by sarcoplasmic reticulum lumenal Ca2+. Biophys. J. 75:2302–2312. [DOI] [PMC free article] [PubMed] [Google Scholar]
- Xu, L., and G. Meissner. 2004. Mechanism of calmodulin inhibition of cardiac sarcoplasmic reticulum Ca2+ release channel (ryanodine receptor). Biophys. J. 86:797–804. [DOI] [PMC free article] [PubMed] [Google Scholar]
- Zahradnik, I., S. Gyorke, and A. Zahradnikova. 2005. Calcium activation of ryanodine receptor channels—reconciling RyR gating models with tetrameric channel structure. J. Gen. Physiol. 126:515–527. [DOI] [PMC free article] [PubMed] [Google Scholar]
- Zahradnikova, A., and I. Zahradnik. 1995. Description of modal gating of the cardiac calcium release channel in planar lipid membranes. Biophys. J. 69:1780–1788. [DOI] [PMC free article] [PubMed] [Google Scholar]