Abstract
We describe the steady-state function of the ubiquitous mammalian Na/H exchanger (NHE)1 isoform in voltage-clamped Chinese hamster ovary cells, as well as other cells, using oscillating pH-sensitive microelectrodes to quantify proton fluxes via extracellular pH gradients. Giant excised patches could not be used as gigaseal formation disrupts NHE activity within the patch. We first analyzed forward transport at an extracellular pH of 8.2 with no cytoplasmic Na (i.e., nearly zero-trans). The extracellular Na concentration dependence is sigmoidal at a cytoplasmic pH of 6.8 with a Hill coefficient of 1.8. In contrast, at a cytoplasmic pH of 6.0, the Hill coefficient is <1, and Na dependence often appears biphasic. Results are similar for mouse skin fibroblasts and for an opossum kidney cell line that expresses the NHE3 isoform, whereas NHE1−/− skin fibroblasts generate no proton fluxes in equivalent experiments. As proton flux is decreased by increasing cytoplasmic pH, the half-maximal concentration (K1/2) of extracellular Na decreases less than expected for simple consecutive ion exchange models. The K1/2 for cytoplasmic protons decreases with increasing extracellular Na, opposite to predictions of consecutive exchange models. For reverse transport, which is robust at a cytoplasmic pH of 7.6, the K1/2 for extracellular protons decreases only a factor of 0.4 when maximal activity is decreased fivefold by reducing cytoplasmic Na. With 140 mM of extracellular Na and no cytoplasmic Na, the K1/2 for cytoplasmic protons is 50 nM (pH 7.3; Hill coefficient, 1.5), and activity decreases only 25% with extracellular acidification from 8.5 to 7.2. Most data can be reconstructed with two very different coupled dimer models. In one model, monomers operate independently at low cytoplasmic pH but couple to translocate two ions in “parallel” at alkaline pH. In the second “serial” model, each monomer transports two ions, and translocation by one monomer allosterically promotes translocation by the paired monomer in opposite direction. We conclude that a large fraction of mammalian Na/H activity may occur with a 2Na/2H stoichiometry.
INTRODUCTION
Na/H exchangers (NHEs) are present in simple prokaryotes, lower eukaryotes, and higher eukaryotes, including plants, fungi, and animals (Doktor et al., 1991). In prokaryotes, yeast, and plants, the driving force of ΔμH energizes NHEs to export Na from the cytosol, whereas in animal cells, ΔμNa drives NHEs to extrude H. In mammals, at least 11 NHE isoforms (NHE1-9 and NHA1-2) exist (Brett et al., 2005; Orlowski and Grinstein, 2007), with the possibility of an additional evolutionarily distinct NHE-like gene expressed exclusively in sperm (Wang et al., 2003). NHE1 is the ubiquitous “housekeeping” NHE that regulates intracellular pH and cell volume (Orlowski and Grinstein, 2004). It is also implicated to regulate diverse cellular functions, including cell proliferation, adhesion, and migration (Denker et al., 2000).
Although many studies have addressed the biological roles of NHEs and their regulation, transport kinetics and the molecular operation of mammalian NHEs have received little attention because the transport methods available to study NHEs are rather limited. Plasmalemmal NHE activities are typically determined by changes in bulk cytoplasmic pH using fluorescent, pH-sensitive dyes, Na22 isotopic flux, or radioactive/fluorescent membrane–permeant buffer trapping (Wakabayashi et al., 1994). Problems of the methods include low sensitivity, poor time resolution, and limited control of cytoplasmic ion concentrations. To overcome some of these limitations, we recently developed a new technique using pH microelectrodes during whole cell patch clamp recording to measure NHE-induced proton fluxes (Fuster et al., 2004).
The bacterial NHE, NhaA (Hunte et al., 2005; Arkin et al., 2007), functions with an electrogenic 2H/1Na stoichiometry (Padan et al., 2004). In contrast, mammalian NHEs are thought to operate as simple alternating access transporters with 1:1 stoichiometry whose activity is then modified by proton binding to regulatory sites on the cytoplasmic side (Aronson et al., 1982; Demaurex et al., 1995; Wakabayashi et al., 1997b) by interacting proteins (Pang et al., 2004; Meima et al., 2007) and by phosphorylation at multiple sites (Slepkov et al., 2007). As with many other mammalian transporters, NHE1 exists as a dimer in cells (Moncoq et al., 2008). Although recent biochemical and structural studies demonstrate that dimer formation is important for NHE1 function (Hisamitsu et al., 2004, 2006; Moncoq et al., 2008), it remains largely enigmatic how and if monomer interactions influence transport function.
At least three studies raise significant doubt that mammalian NHEs monomers operate as independent transporters with 1:1 exchange stoichiometry. First, attempts to define pre–steady-state kinetics of NHE3 at low temperatures revealed a highly cooperative activation by Na that was suggested to reflect dimer coupling (Otsu et al., 1989, 1993). Second, activation of reverse Na/H exchange by cytoplasmic Na is cooperative with a Hill coefficient close to 2 (Green et al., 1988). Third, analysis of NHE1 mutants with altered regulatory function suggests that the ion dependencies of transport per se are more steep than expected for 1:1 exchange (Lacroix et al., 2004), and a functional dimer model was proposed in which regulatory sites and transport sites interact allosterically across monomers.
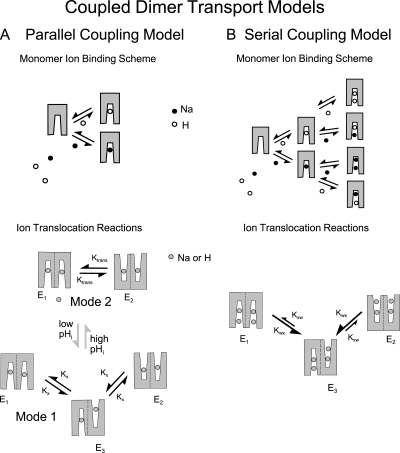
Using oscillating pH electrodes combined with whole cell patch clamp, we describe first that the extracellular Na concentration dependence of forward Na/H exchange can be either biphasic or steep, and we describe second that the functional interactions of ions from opposite membrane sides contradict simple consecutive transport models. To address the potential significance of these complexities, we compared numerous mathematical transport models with an emphasis on the possible functional coupling of NHE monomers, as suggested to occur by the literature introduced above. In brief, we can account in first order for most results by two different dimer coupling models, dubbed parallel (left) and serial (right) coupling models in Fig. 1. For simplicity, it is assumed in both models (1) that Na and H bind competitively to the same transport sites (see upper cartoons in each panel), (2) that monomers can carry out ion exchange reactions without obligatory coupling to a partner monomer (see lower cartoons in each panel), (3) that ion binding reactions are in equilibrium during transport (i.e., that ion binding is fast with respect to ion translocation), and (4) that ion translocation reactions occur without slippage (see lower cartoons). E1 states refer to the dimer configuration in which both sites are open to the cytoplasmic side, E2 to the configurations with both monomers open to the outside, and E3 to the configuration with the monomers open to the opposite sides. In the parallel coupling model, shown in Fig. 1 A, monomers operate independently as 1Na/1H exchangers in Mode 1, but they can enter an interaction in which they become coupled (Mode 2) to carry out ion exchange with a 2:2 stoichiometry. To account for the dataset, transitions between the two transport modes are assumed to be controlled by regulatory proton binding sites on the cytoplasmic side. In the serial coupling model, shown in Fig. 1 B, each monomer carries out transport with a 2Na/2H exchange stoichiometry. Coupling between monomers occurs because translocation of two ions by one monomer favors translocation of two ions by the other monomer in the opposite direction. Thus, ion exchange takes place statistically in a serial fashion with some characteristics of a simultaneous exchange mechanism (Lauger, 1987). We discuss predictions of these two models in relation to all available data on NHE1.
Figure 1.
Cartoons of two models of NHE1 function as a “coupled dimer” that can carry out 2Na/2H exchange. A “parallel” model is shown in A and a “serial” model is shown in B. The upper cartoons in each panel show the assumed ion translocation reactions, whereby binding of either Na ions or protons enables the same translocation reactions of both ions with the same rates. The lower cartoons show the relevant ion binding schemes, whereby Na ions and protons bind competitively to one or two sites. (A) Parallel model. In this model, it is assumed that monomers carry out Na/H exchange activity independently at low cytoplasmic pH (Mode 1). As cytoplasmic pH rises, proton dissociation from regulatory sites favors the development of an interaction between monomers, such that they become coupled to translocate two ions in a parallel or symport fashion (Mode 2). The ion binding scheme is a simple competition of Na and protons for a single site. (B) Serial model. Each monomer of the dimer can bind two substrates, and ion translocation requires occupation of both sites. Each monomer can translocate ions and allows them to dissociate on the opposite membrane side, but the rates of translocation (Kxw and Kwx) are higher when binding sites of both monomers are open to one membrane side (E1 and E2), Thus, transport reactions become coupled in a serial fashion: Translocation of two ions in one direction promotes the translocation of two ions in the opposite direction. The ion binding scheme for each monomer assumes that two protons or Na ions can bind in random order and that all configurations with two ions bound can undergo conformational changes that allow ion dissociation on the opposite membrane side.
MATERIALS AND METHODS
Cell Culture
Chinese hamster ovary (CHO) and opossum kidney (OK) cell cultures were maintained as described previously (Kang et al., 2003; Fuster et al., 2004). Immortalized mice skin fibroblasts were maintained in high glucose Dulbecco's modified Eagle's medium (DMEM; Invitrogen). Culture media were supplemented with 10% heat-inactivated FBS (Invitrogen) with 100 U/ml penicillin and 100 U/ml streptomycin. Cells were propagated in a humidified 95%/5% air/CO2 atmosphere incubator at 37°C. For patch clamp experiments, cells were trypsinized (Ca- and Mg-free solution with 0.25% [wt/vol] trypsin and 2 mM EGTA) for 3–5 min and then resuspended in culture medium. Cells were then maintained at room temperature and used within 8 h. Human HVCN1 encoding the human voltage–gated proton channel in pQBI25-fC3 vector (Quantum Biotechnologies) was provided by D. Clapham (Harvard Medical School, Boston, MA) (Ramsey et al., 2006).
Generation of NHE1−/− and NHE1+/+ Skin Fibroblasts
Dermal fibroblasts were isolated from NHE1 wild-type or knock-out mice (provided by G. Shull, University of Cincinnati, Cincinnati, OH). Subcutaneous dermal tissue was dissected into chilled, sterile PBS, minced, and washed by centrifugation (200 g for 3 min) with ice-cold 50:50 low glucose DMEM/Ham's F12 medium (Invitrogen), and the pellet was resuspended in prewarmed, preoxygenated DMEM/Ham's F12 medium containing 0.35% collagenase type I (Invitrogen) and incubated at 37°C for 30 min with continuous, vigorous agitation. Digestion was stopped with 2 ml of prechilled DMEM/Ham's F12 medium supplemented with 10% FBS. Cell pellets were washed three times and then serially diluted into 3–6 wells of a 48-well tissue culture plate. Incubation was continued until colony formation was apparent. Within 2–3 wk of colony formation, cells were subjected to SV40 immortalization (pBRSV plasmid; American Type Culture Collection) by electroporation. Immortalized NHE1−/− and NHE1+/+ cells were then characterized for NHE1 expression by RNA and Western blotting.
Patch Clamp
Electrophysiological methods were also as described previously (Kang et al., 2003; Fuster et al., 2004). Unless stated otherwise, the holding potential was 0 mV. The data points in figures are nearly proportional to potential differences recorded by the pH electrode when the cell was moved away from the pH electrode. All results are at 35–37°C.
Proton-selective Microelectrodes
The pH microelectrodes were prepared largely as described previously (Kang et al., 2003; Fuster et al., 2004). In brief, for measurements in bath solution, borosilicate glass electrodes (1.2 mm) without filament (WPI) were pulled to yield tip diameters of 2–4 μm. Electrodes for intrapipette measurements were manufactured from flexible quartz capillary tubing (PolymicroTechnologies) and pulled on a custom devise using an acetylene flame. When the tip diameters were <2 μm, tips were beveled on a soft glass bead on the patch pipette microforge to give diameters of ∼3 μm. Electrode tips were dipped briefly in Sigmacote (Sigma-Aldrich), and excess liquid was blown out by a syringe connected to the electrode through a polyethylene tube. The electrode was exposed to a stream of hot air for ∼10 s, back-filled with 100 mM KCl (pH 7.0 with 10 mM HEPES), and finally dipped in hydrogen ionophore I cocktail B (Fluka) until column lengths were 100–200 μm. Average electrode responses were 58 mV per pH unit from pH 6.0 to 8.
Recording Chamber and the Patch Pipette Oscillation
The methods and diffusion models used were described previously (Kang et al., 2003; Fuster et al., 2004). In brief, extrapipette pH microelectrodes were mounted with sticky wax in a 1.3-mm wide slit of a temperature-controlled recording chamber. A fine chlorinated silver wire was then inserted into the back-filled electrolyte solution and connected to the probe of a high input resistance (1015 Ohms) electrometer (WPI). After obtaining the whole cell patch clamp configuration, the microscope stage was moved to a position with the cell in front of the ion-selective microelectrode (∼5–10 μm). The patch pipette was then moved manually, either laterally or longitudinally, between two positions (usually 50 μm), far apart enough to detect the ion gradient. Pipette perfusion was performed as described previously (Hilgemann and Lu, 1998) with perfusion capillaries placed 50–150 μm from the patch pipette tip. Individual experiments are representative of at least four experiments. All experiments were performed at 34–36°C.
Solutions (in mM)
The following solutions were used in Figs. 2–6: bath solution: 0–140 NaCl, 2 CaCl2, 1 MgCl2, 0.1 Tris, pH 8.2; pipette solution: 60 KOH, 30 l-aspartate acid, 10 KCl, 1 EGTA, 0.5 MgCl2, 10 MgATP, and 50 Mes, pH 6.0, 50 Pipes, pH 6.8, 50 Mops, pH 7.2, or 50 HEPES, pH 7.6 (7.6).
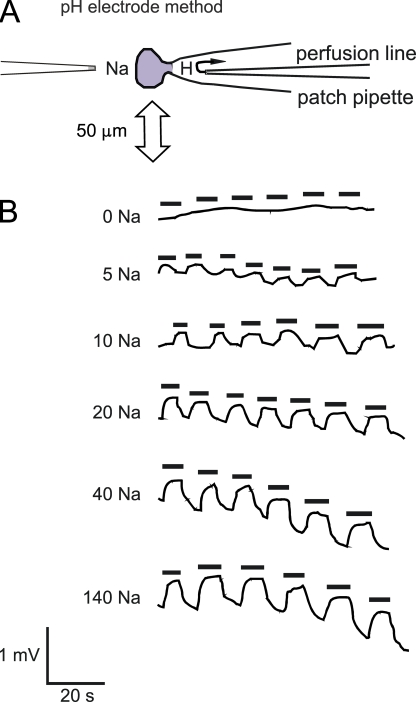
Figure 2.
Detection of NHE1-induced proton fluxes by oscillating an extracellular pH microelectrode. (A) The cell is held in whole cell configuration with its edge 5 μm from the tip of a pH microelectrode, and it is manually oscillated laterally by 50 μm to detect pH gradients. Both bath and pipette solution can be changed rapidly, the latter by the intra-pipette perfusion technique (see Materials and methods). (B) Example of a recording set for NHE1 transport activity in a single CHO cell using different bath sodium concentrations at fixed extracellular (8.2) and intracellular pH (6.0). Black bars mark time points when the cell was moved away from the pH microelectrode.
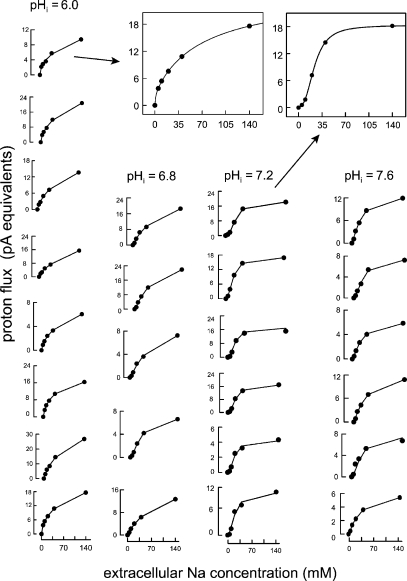
Figure 3.
The extracellular Na dependence of proton flux mediated by NHE1 in 25 CHO cells with a cytoplasmic pH of 6.0 (eight cells), 6.8 (five cells), 7.2 (six cells), and 7.6 (six cells). Data points in each experiment represent the average of 5–20 flux determinations. The lines connect the calculated values from the best fits of data points to Hill equations. The insets illustrate the two strikingly different wave forms obtained at pH 6.0 and 7.2 with the corresponding best fits to Hill equations. At pH 6.0, the extracellular Na dependence often appeared biphasic, showing an apparent high affinity component, such that the overall Hill slope <1. At pH 7.2, the extracellular Na concentration dependence of proton flux showed cooperativity with Hill slopes of ∼2. Composite data shown in Fig. 4 C and 5 document the significance of these differences.
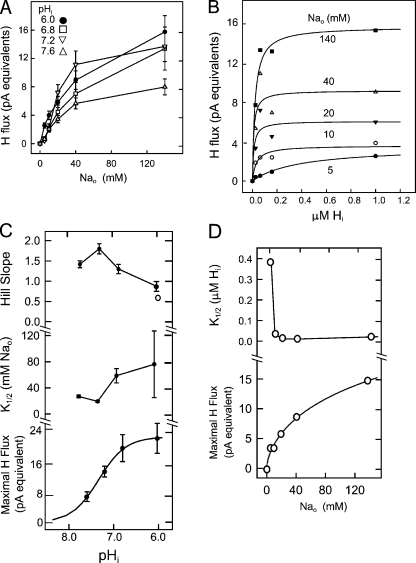
Figure 4.
Extracellular Na and cytoplasmic proton dependence of NHE1 in voltage-clamped CHO cells. (A) Composite data from Fig. 3 plotted with standard errors. (B) Average proton fluxes at different Na concentrations plotted in dependence on the cytoplasmic free proton concentration. Lines in the plot represent the best fit of data to a Michaelis-Menton relation. (C) Parameters of the Hill equations fitted to the individual records in Fig. 3. Top plot, Hill coefficients; middle plot, half maximal extracellular Na concentrations; bottom plot, maximal proton fluxes. The open circle gives the Hill coefficient for the maximal fluxes extrapolated in B for the different Na concentration (i.e., the bottom plot in D). (D) Extracellular Na dependence of parameters from the Michaelis-Menton fits given in B. Top plot, half-maximal cytoplasmic proton concentration determined for different extracellular Na concentrations; bottom plot, extrapolated maximal proton fluxes.
Figure 5.
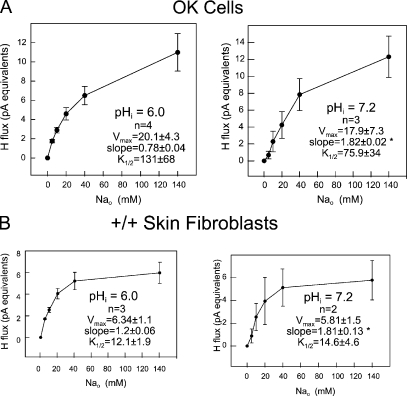
Extracellular Na dependence for native NHE3 in OK cells and native NHE1 in mouse NHE1 wild-type skin fibroblasts. (A) Extracellular Na dependence of native NHE3-induced proton fluxes at intracellular pH (pHi) 6.0 (left) and 7.2 (right) in OK cells. Note biphasic shape of Na dependence of NHE3 transport at pHi 6.0 and sigmoidal shape at pHi 7.2, similar to that observed for NHE1 in CHO cells (see Fig. 4) and NHE1 wild-type mouse skin fibroblasts (see below). (B) Extracellular Na dependence of native NHE1-induced proton fluxes at intracellular pH (pHi) 6.0 (left) and 7.2 (right) in wild-type NHE1 mouse skin fibroblasts. Note biphasic shape of Na dependence of NHE1 transport at pHi 6.0 and sigmoidal shape at pHi 7.2. Magnitude of Na-induced proton fluxes and extracellular Na dependence are very similar to CHO cells, which express natively NHE1 on the plasma membrane (see Fig. 4). No proton fluxes were detected in NHE1 knockout mouse fibroblasts or in CHO-derived AP-1 cells, which are devoid of plasmalemmal NHE1 (not depicted).
Figure 6.
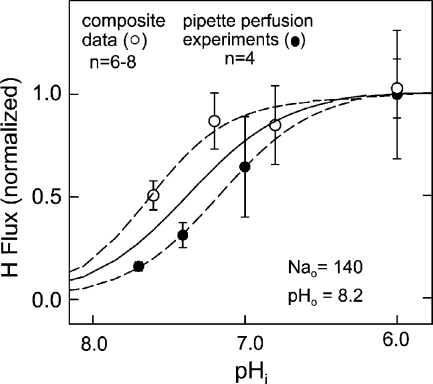
Cytoplasmic Na dependence of NHE1 proton flux with 140 mM of extracellular Na, nominally no cytoplasmic Na, and with an extracellular pH of 8.2. Filled circles show average data from four individual experiments where pHi was changed serially in the same cell via pipette perfusion (for details see Materials and methods). Open circles show data for 140 mM of extracellular Na obtained in the experiments presented in Fig. 3. The best Hill equation fit to all data points in the figure is given as a solid line.
In Fig. 7: bath solution: 20 NaCl (Nao = 20) or 140 NaCl (Nao = 140), 2 CaCl2, 1 MgCl2, 0.1 Mops, pH 7.2, 0.1 HEPES, pH 7.6, 0.1 Tris, pH 8.2; pipette solution: 60 KOH, 30 l-aspartate acid, 10 KCl, 1 EGTA, 0.5 MgCl2, 10 MgATP, 50 Pipes pH 6.8.
Figure 7.
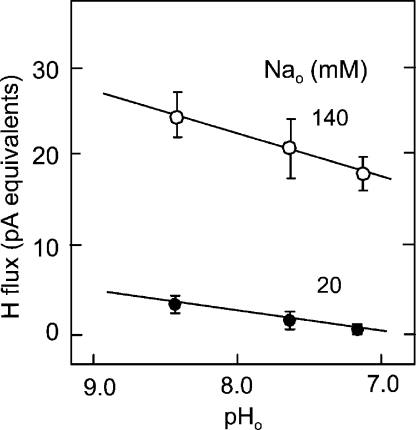
Dependence of forward-mode NHE1 proton flux on extracellular pH with 140 and 20 mM of extracellular Na with a cytoplasmic pH of 6.8 and with nominally 0 mM of cytoplasmic Na (n = 4).
In Fig. 8: bath solution: 140 KCl, 2 CaCl2, 1 MgCl2, 0.1 Mes, pH 6.5, 0.1 Mops, pH 7.2, 0.1 HEPES, pH 7.6, 0.1 Tris, pH 8.2, 0.1 CAPSO, pH 9.0; pipette solution: 70 NaOH (Nai = 70) or 10 NaOH and 60 KOH (Nai = 10), 30 l-aspartate acid, 10 KCl, 1 EGTA, 0.5 MgCl2, 10 MgATP, 50 HEPES, pH 7.6 (7.6).
Figure 8.
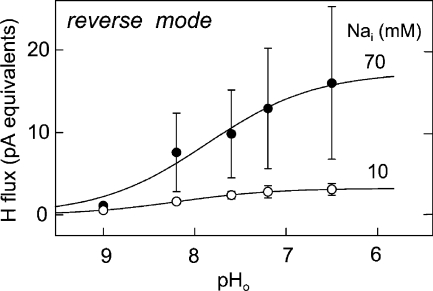
Dependence of reverse-mode NHE1 proton flux on extracellular pH with 70 and 10 mM of cytoplasmic Na, a cytoplasmic pH of 7.6 and nominally no extracellular Nao (n = 4).
Determination of Proton Fluxes
The calculation of ion fluxes from ion gradients was described previously (Kang et al., 2003; Fuster et al., 2004). All calculations including a proton buffer assumed an instantaneous equilibrium with the proton buffers used:
 |
1 |
 |
2 |
where KD is the dissociation constant of the proton buffer, BT is the total buffer concentration, and PT is the total proton concentration (i.e., initial proton concentration plus the concentration change resulting from proton flux across the membrane).
For whole cell recording, we approximate the cell shape as a sphere. The flux (JH) can then be estimated from the free H concentration difference between the cell surface and the bulk solution (ΔH), the H and buffer diffusion coefficients (DH and DB), the total buffer concentration (BT), and the KD of the buffer. For a spherical cell,
 |
3 |
Here, r is the cell radius, and ΔBH/ΔH is the steady-state concentration change of bound protons for a small change of free H:
 |
4 |
The flux carried by free H is negligible in most experiments. As in previous studies, we relate our results on H fluxes to electrophysiological flux units by calculating the current equivalents of the fluxes (i.e., JH/Faraday) in pA.
Simulation of the “Parallel Coupling Model”
As described in the Introduction, the central assumption of the parallel coupling model is that NHE monomers can function either as independent monomers or can become coupled such that the two monomers bind and transport two Na ions or two H ions simultaneously. In the simulations presented it is assumed that transitions between Mode 1 and Mode 2 are controlled by cytoplasmic proton binding regulatory sites. Specifically, the transition from Mode 2 to Mode 1 requires the binding of two protons at regulatory sites. In short, NHE1 functions as a dimer at alkaline cytoplasmic pH and as a monomer at low cytoplasmic pH. To simulate the model with the least possible assumptions, binding sites are assumed to have the same affinities in Mode 1 and Mode 2.
The simulation proceeds by calculating the fractions of binding sites occupied by ions from the four respective ion concentrations and dissociation constants for cytoplasmic and extracellular binding sites (Kno, 34.0 mM; Khi, 0.054 μM; Kni, 102 mM ; Kho, 0.0183 μM) with microscopic reversibility given by the relationship Kno · Khi = Kni · Kho and the assumption that all translocation rates are equal. We mention in this connection that there is no data available to our knowledge on the real dissociation constants of ions for mammalian NHEs.
In Mode 2, the fractions of transporter populations with two ions bound are the square of the fractional occupancy for a monomer.
 |
5 |
 |
6 |
 |
7 |
 |
8 |
Next, the fractions of transporters with binding sites open to the cytoplasmic (E1) and extracellular side (E2) are calculated for each mode, assuming that monomers function independently in Mode 1:
 |
9 |
 |
10 |
 |
11 |
 |
12 |
The fraction of dimers in Mode 1 (FMode1) is then calculated as a simple Hill function, assuming that the binding of two protons to regulatory sites determines the fraction of transporters in Mode 1.
 |
13 |
For the simulations presented, Kswitch is 0.3 μM.
The overall ion translocation rate (Rnhe) is then calculated as the sum of translocation rates for the two modes using a translocation rate of 1,000 s−1 (Ktrans) for all transport reactions.
 |
14 |
Simulation of the “Serial Coupling Model”
Each of two homologous monomers is assumed to bind two ions, either Na ions (Na) or protons (H), in random sequential order. From the extracellular side, the first and second ions bind with the same dissociation constants, 35 mM for Na and 15 nM for protons (KNa and KH):
 |
15 |
 |
16 |
 |
17 |
 |
18 |
 |
19 |
where Dout is a temporary variable, and Fnno, Fhho, Fnho, and Fhno are the fractions of binding sites with two Na bound, two H bound, one Na followed by one H, and one H followed by one Na, respectively. To account for the entire dataset, we assume that ion binding from the cytoplasmic side occurs with an asymmetry with respect to the extracellular side, namely that binding of the first Na ion or proton takes place with an affinity that is a factor of 100, Fin, lower than at the extracellular side.
 |
20 |
 |
21 |
 |
22 |
 |
23 |
 |
24 |
where Din is a temporary variable, and Fnni, Fhhi, Fnhi, and Fhni are fractions of binding sites with two Na bound, two H bound, one Na followed by one H, and one H followed by one Na, respectively.
As shown in Fig. 1 B, the minimum model is a three-state model. The coupled function between monomers arises from the assumption that the dimer configuration, with ion binding sites open to opposite membrane sides (E3), is stabilized versus configurations with both binding sites open to the cytoplasmic (E1) or the extracellular sides (E2). Therefore, the intrinsic rate constants that open binding sites to the double-open configurations, i.e., to E1 and E2 from E3, are low (Kxw, 300 s−1) with respect to the opposing reactions to the E3 state from E1 and E2 states (Kwx, 30,000 s−1). A second asymmetry that allows more accurate simulations is that the reactions opening binding sites to the cytoplasmic side (E2 to E3, and E3 to E1) occur more rapidly by a factor of five (Fkin) than the opposing reactions that open binding sites to the extracellular side (E1 to E3, and E3 to E2). We mention that the asymmetries introduced are entirely consistent with the principle of microscopic reversibility. The calculation of model states and ion fluxes proceeds as follows:
 |
25 |
 |
26 |
 |
27 |
 |
28 |
 |
29 |
 |
30 |
 |
31 |
 |
32 |
 |
33 |
 |
34 |
where rates of the individual translocation reactions are subscripted R variables, D is temporary, and FNa and RH are the single dimer transport rates for Na and H, respectively, from the extracellular to the cytoplasmic side.
Chemicals
All chemicals were from Sigma-Aldrich and were the highest grade available.
Online Supplemental Material
A Supplemental material section describes our efforts to monitor and quantify proton fluxes in giant excised patches and to define NHE activities in excised patches. The data documents that significant complexities of the excised patch configuration hinder accurate determination of proton fluxes and that NHE activity is in some ways disrupted by formation of gigaseals, probably as a result of mechanical deformation of the membrane. The online supplemental material is available at http://www.jgp.org/cgi/content/full/jgp.200810016/DC1.
RESULTS
Extracellular Na and Cytoplasmic H Dependencies of NHE1 Activity under Near Zero-trans Conditions
One of the most powerful mechanistic analyses of transporter function is to determine how the concentration of a solute on one membrane side affects the solute concentration dependence on the other side (Lauger, 1987). To our knowledge, this analysis has not been performed in detail for mammalian NHEs. Therefore, we performed the relevant studies for both forward and reverse exchange operation. Fig. 2 shows data from a typical experiment to determine the extracellular Na dependence of NHE1 activity in the “forward” proton-out/Na-in mode. Cytoplasmic solutions were heavily buffered, here to pH 6.0, and contained no Na. In random order, the proton gradient next to the cell was determined at different Na concentrations by oscillating the cell up to and away from the ion-selective electrode. Here, the solutions contained 0, 5, 10, 20, 40, and 140 mM Na. As described previously (Fuster et al., 2004), we found that the NHE activity was stable for up to 40 min. From multiple results for each ionic condition, we determined the average ion-selective electrode response. Then, we calculated the average proton gradient and proton flux, as described in Materials and methods, assuming that the cell was spherical. In the initial work, we determined proton gradients multiple times with the same Na concentration, rather than attempt to determine the Na dependence at multiple cytoplasmic pH values in the same cell.
Fig. 3 shows our initial data from 25 experiments in which extracellular Na was varied with cytoplasmic pH set to 6.0, 6.8, 7.2, and 7.6. Averaged data from each cell, with 6–10 measurements per point, is presented with the best fit to a Hill equation. As highlighted by examples in the insets, the extracellular Na dependence shows strikingly different profiles at different cytoplasmic pH values. At low cytoplasmic pH, the Hill coefficients are <1, and the Na dependence often appears to contain high and low affinity components. In contrast, the extracellular Na dependence has a pronounced “sigmoidicity” at a cytoplasmic pH of 7.2 with Hill coefficients of ∼2. Both of these complexities were confirmed when solutions were applied in different orders and when other cell lines were used, as described later.
Fig. 4 (A and B) shows the averaged data from the experiments of Fig. 3. Fig. 4 A shows the Na dependence at the different cytoplasmic pH values, together with the standard errors, and Fig. 4 B shows the cytoplasmic proton concentration dependence in a linear plot at the different extracellular Na concentrations examined. It is striking in these experiments that NHE1 can be highly active at neutral cytoplasmic pH. In fact, the average fluxes at 20 and 40 mM Na are larger at pH 7.2 than at 6.8, and the difference of the pooled data (namely a larger flux at pH 7.2 vs. 6.8) for the two Na concentrations is significant (P < 0.05). As considered in detail below in the Discussion, this outcome is different from almost all datasets up to now on NHE1 (e.g., Wakabayashi et al., 1997a, 2003; Kinsella et al., 1998). Here, we point out simply that three experimental factors may contribute. First, the cytoplasmic solution is Na free in our experiments. Second, the cytoplasmic pH is heavily buffered with exogenous pH buffers. And third, the cells are voltage clamped through a large pipette tip that allows all small molecules, including soluble proteins, to diffuse out of cells.
The data points for Na dependence are simply connected by lines in Fig. 4 A because Hill equation fits were given in Fig. 3. In Fig. 4 B, the composite data points for the proton concentration–flux relations are given with the best fits to a simple hyperbolic function, and it is clear that the proton–flux relations cannot be described well with any simple function. Nevertheless, it is striking that the midrange of the proton dependencies shifts strongly to a lower concentration range as the extracellular Na concentration is increased. With 140 mM Na, for example, the proton flux is nearly maximal with 0.1 μM free protons on the cytoplasmic side, a concentration at which the flux with 5 mM Na reaches only 20% of the projected maximum with a high proton concentration. This behavior is opposite to that expected for a simple consecutive transport model (Lauger, 1987).
From the Hill fits for Na–flux relations presented in Fig. 3, Fig. 4 C shows the cytoplasmic pH dependence of the slopes, the K1/2's for extracellular Na, and the extrapolated maximal proton fluxes (i.e., the maxima of the Hill fits). As cytoplasmic pH is decreased from 7.6 to 7.2, the Hill coefficients determined for Na–flux relations (Fig. 4 C, top plot) increase from 1.45 to 1.86. With further decreases of pH to 6.8 and 6.0, the coefficients then decrease from 1.86 to 1.40 and 0.89. As described subsequently, the Hill coefficient for the Na dependence of maximal proton fluxes from Fig. 4 B is still smaller, namely 0.62 (open circle in the middle plot). The extrapolated maximal fluxes from the Na dependencies, shown in the bottom plot in Fig. 4 C, give a Hill coefficient of 1.42 with half-maximal activity occurring at a cytoplasmic pH of 7.33. The middle plot in Fig. 4 C shows the K1/2's for extracellular Na in dependence on cytoplasmic pH. First, we note that the variability of the K1/2's at pH 6.0 is large. This stems from the fact that concentration–flux relations are rather shallow with 140 mM Na and therefore that determination of half-maximal concentrations becomes inaccurate. However, the K1/2 decreases significantly as the free proton concentration is decreased from pH 6.8 to 7.2, and the standard errors of the curve fitting are much smaller. Between pH 7.2 and 7.8, the K1/2 values do not decrease further. Thus, although the direction of shifts is expected from simple consecutive transporter models, the shifts are substantially smaller than expected.
From the Michaelis-Menton fits of proton–flux relations, shown in Fig. 4 B, Fig. 4 D shows the Na dependence of the K1/2's for protons and the extrapolated maximal proton fluxes. We suspect that the large decrease of apparent proton affinity between 10 and 5 mM of extracellular Na is exaggerated because the data, especially at 10 mM Na, do not follow well a hyperbolic function. The extrapolated maximal proton fluxes with respect to Na are shown in the bottom plot in Fig. 4 D. The maximal fluxes at 5 and 10 mM Na are only a little different, and the fit of this data to a Hill equation, given as a line, gives a slope coefficient of 0.62 (Fig. 4 C, open circle in the plot of Hill coefficients). Notably, the waveform of this concentration–activity relation is similar to that for single experiments at a cytoplasmic pH of 6.0 (see Fig. 3), although the method of deriving the Na dependence was very different.
OK Cells and Mouse Skin Fibroblasts from Wild-type and NHE1 Knockout Animals
To test whether the patterns described in Figs. 3 and 4 are relevant to other NHE isoforms, we performed the same protocols with the same solutions using the OK cell line that only expresses the NHE3 isoform on the plasma membrane (Fuster et al., 2004). Fig. 5 A shows the average proton fluxes determined in OK cells at a cytoplasmic pH of 6.0 (left; n = 4) and 7.2 (right; n = 3). All results were fit to Hill equations, and the parameters obtained by the least-squares fitting routine show very similar shape changes to those determined in CHO cells. At a cytoplasmic pH of 6.0, the average Hill slopes were significantly <1 (P < 0.01), namely 0.78. At a cytoplasmic pH of 7.2, the average Hill slopes were 1.82 (P < 0.02). As in CHO cells, the half-maximal extracellular Na concentration decreased with decreased cytoplasmic proton concentration (131 vs. 76 mM at pH 6.0 vs. pH 7.2; P = 0.05). From these results, we conclude that the changes described in Fig. 3 may be a general property of mammalian NHE function.
Next, we used an immortalized skin fibroblast cell line from NHE1 knockout mice to test whether pH gradients arise exclusively from NHE1 activity in a relevant cell type. In five experiments, no pH gradients were found in knockout fibroblasts under these conditions. We then used the equivalent wild-type mouse skin fibroblast line to verify that the patterns described in Fig. 3 indeed can be specifically ascribed to NHE1. Fig. 5 B shows the equivalent results for wild-type–immortalized skin fibroblasts. The average Hill slope was 1.2 at a cytoplasmic pH of 6.0 versus 1.8 at a pH of 7.2 (P < 0.02). Thus, the general principle of cooperative behavior at alkaline cytoplasmic pH is verified. Notably, the half-maximal Na concentration was 12.1 mM at pH 6.0 versus 14.6 at pH 7.2. Thus, the apparent affinity for Na is substantially higher in these skin fibroblasts than in CHO fibroblasts.
Cytoplasmic pH Dependence of Forward Transport with Physiological Extracellular Na
Fig. 6 presents the cytoplasmic pH dependencies of NHE1 activity at 140 mM Na from two types of experiments. Open circles give the cytoplasmic pH dependence of proton fluxes with 140 mM of extracellular Na from the dataset just described, comparing average proton fluxes from different cells. The half-maximal activity occurs at a pH of 7.62, and the Hill coefficient is 1.61. Filled circles in Fig. 6 give the average of normalized fluxes from another set of experiments (n = 4) in which the cytoplasmic pH was varied by pipette perfusion at a constant extracellular Na concentration (140 mM). The fluxes are half-maximal at pH 6.9, and the average Hill coefficient is 1.40. Although the half-maximal pH is 0.4 units lower than for the composite data, it is still substantially higher than determined in most previous studies (Wakabayashi et al., 1997a, 2003; Kinsella et al., 1998).
Extracellular pH Dependence of Forward Transport
In the experiments just described, a relatively alkaline extracellular pH of 8.2 was used to establish nearly zero-trans transport conditions. Therefore, we examined next the extracellular pH dependence of NHE activity in CHO cells at different extracellular Na concentrations (140 and 20 mM). Results are shown in Fig. 7 for a cytoplasmic pH of 6.8. At 140 mM of extracellular Na, extracellular acidification from pH 8.2 to 7.2 results in a 24% decrease of exchange activity. With 20 mM of extracellular Na, exchange activity is ∼15% of activity with 140 mM, and acidification from pH 8.2 to 7.2 inhibits ∼80% of the proton flux. Thus, acidification of the extracellular medium to a pH of 8.2 to 7.2 has only a modest effect on exchange activity with normal (140 mM) extracellular Na, but the inhibition is relatively much larger when the Na concentration is submaximal, as expected for a competitive behavior of Na and H binding sites.
Extracellular pH Dependence of Reverse Transport
As described previously (Fuster et al., 2004), we detect robust reverse NHE1 activity when the cytoplasmic Na is increased to ∼20 mM. Somewhat surprisingly, compared with previous work (Wakabayashi et al., 2003), the activity remains robust in our hands with a quite alkaline cytoplasmic pH of 7.6. Fig. 8 presents the extracellular pH dependence of the reverse transport using multiple pH buffers to set the extracellular pH to values from 7.5 to 9.0 (see Materials and methods). With 70 mM cytoplasmic Na, the half-maximal flux occurs at an extracellular pH of 7.84, and the Hill coefficient is 0.74. With 10 mM cytoplasmic Na, the half-maximal flux occurs at an extracellular pH of 8.1, and the Hill coefficient is 0.78, whereby the maximal proton flux is decreased by 81% (i.e., fivefold).
Description of Dataset by Two Functional Dimer Models
Figs. 9–12 describe the function of the dimer models, introduced in Fig. 1 and in Materials and methods, in relation to the experimental data. Regarding model parameters, transport rates were selected so that maximal proton fluxes per dimer are consistent with estimates from the literature of a maximal NHE turnover of 2,000 per second (Dixon et al., 1987). For both models, it was essential to assume that Na and H affinities could be significantly different for binding sites open to the cytoplasmic or the extracellular side. For the parallel model, it was essential to assume that transitions between Mode 1 and Mode 2 are long-lived compared with the ion translocation reactions. In the parallel model presented here, it is simply assumed that the fraction of transporters operating in Mode 1 is given by a Hill equation with a slope of 2 and a K1/2 of 0.3 μM.
Figure 9.
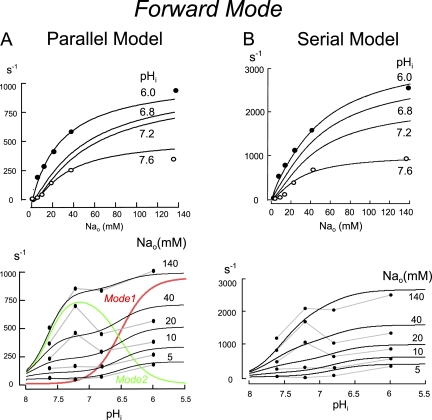
Simulations of forward transport by a single NHE1 dimer using the parallel (A) and serial (B) coupling models. The top panels give the simulated extracellular Na dependence of NHE activity at cytoplasmic pH values of 6.0, 6.8, 7.2, and 7.6. Data points are from the insets in Fig. 3. Bottom panels give the simulated cytoplasmic pH dependencies of NHE activity at extracellular Na concentrations of 140, 40, 20, 10, and 5 mM. Data points are replotted from the linear proton concentration plot in Fig. 4 B and scaled to the simulations. For the parallel model in A, the contributions of Mode 1 and Mode 2 to total proton transport are given.
Figure 10.
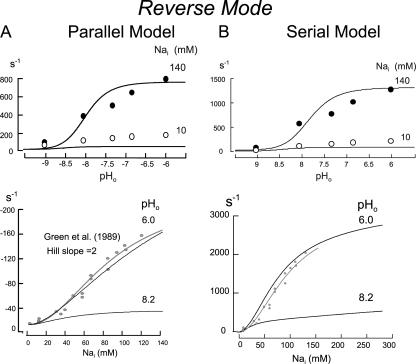
Simulations of reverse mode activity for the parallel (A) and serial (B) exchange models. Simulated extracellular pH dependence of NHE activity at cytoplasmic Na concentrations of 140 and 10 mM are given in the top panels with data points replotted from Fig. 8 and scaled to the simulations. Simulated cytoplasmic Na dependence of reverse NHE activity at extracellular pH values of 6.0 and 8.2 are given in the bottom panels together with data points from Green et al. (1988) for the cytoplasmic Na dependence of reverse NHE1 activity, fitted to a Hill equation with a slope coefficient of 2.
Figure 11.
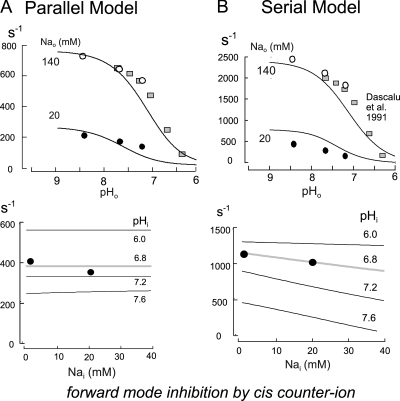
Simulations of the inhibition of forward transport by counter-transported ions on the “cis” membrane side for the parallel (A) and serial (B) exchange models. Simulated inhibition of forward transport with ion concentrations as in Fig. 7 are given in the top panels, together with data points replotted from Fig. 7. Also scaled to the simulations are data from Dascalu et al. (1991) mentioned in the text. Bottom panels give the simulated inhibition of forward transport by cytoplasmic Na with 140 mM of extracellular Na, an extracellular pH of 8.2, and cytoplasmic pH values of 6.0, 6.8, 7.2, and 7.6. The data points are from experiments described previously for a cytoplasmic pH of 6.8 (Hilgemann et al., 2006).
Figure 12.
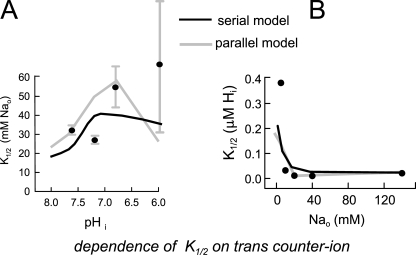
Simulations of the cis–trans interactions of Na and H under near zero-trans conditions, as in Figs. 3–5. (A) The dependence of half-maximal extracellular Na concentration of NHE activity on cytoplasmic pH under the conditions shown in Fig. 4 together with data points from Fig. 4 C. (B) The dependence of half-maximal cytoplasmic proton concentrations, based on fits of simulated data to Michaelis-Menton relations, on the extracellular Na concentration under the conditions of Fig. 4 together with data points from Fig. 4 D.
For the serial model, the ratio of the rates, Kwx to Kxw, must be at least 50 to roughly reproduce the shapes of the extracellular Na–activity relations described in Fig. 3. A factor of 100 was used in the simulations to be presented. This ratio generates an Na dependence of the fully activated exchangers (i.e. with a cytoplasmic pH of 6.0) that is nearly Michaelis-Mention in shape. A larger asymmetry is required to generate a more biphasic Na–flux relation, as pointed out later. The asymmetry of reactions opening binding sites to the cytoplasmic side (Fkin) must be at least three to reproduce a higher apparent extracellular versus cytoplasmic proton affinity (see Figs. 8 and 9), as well as some other details outlined subsequently. A factor of five was used in the simulations presented. The ion affinities were selected to reproduce reasonably, by eye, the concentration dependencies determined in the experiments. Also, the experimental datasets presented with the simulations were scaled to the simulated NHE1 function by eye.
Fig. 9 shows extracellular ion dependencies of forward exchange (Rnhe) in relation to experimental results from Figs. 3 and 4. The simulated Na concentration–activity relations for the two models (top panels) were fit by a least-squares method to Hill equations, and slopes at pH 6.0 and 7.6 were 0.8 and 1.7 for the parallel model and 1.0 and 1.5 for the serial model, respectively. Thus, the cooperativity of the serial model with respect to Na at pH 7.6 is somewhat less strong than determined experimentally, even though transport occurs with strict 2:2 stoichiometry. Maximal transport activities are roughly threefold greater at pH 6.0 versus 7.6 in both simulations and data, and simulated Na–activity relations at pH 6.0 show small high affinity phases in the range of 0–3 mM Na. The simulated Na concentration–flux relations reproduce reasonably shape changes that occur with variation of cytoplasmic pH on the basis of composite data. As shown in the bottom panel of Fig. 9, the parallel model generates biphasic concentration–flux relations that reproduce broadly the experimental data. To illustrate how this comes about, the relative contributions of Mode 1 and Mode 2 transport operation are shown in color. Mode 2 is responsible for exchange at high cytoplasmic pH, and the transporter shifts to Mode 1 as the cytoplasm is acidified beyond pH 7.0. The serial model, in contrast, generates a monophasic concentration–flux relationship with the chosen simulation parameters, whereby the overall cytoplasmic pH dependencies of transporter turnover reproduce the global shape of the data with respect to cytoplasmic pH. At low cytoplasmic pH, Hill slopes determined from simulated data are consistent with slopes determined experimentally in Figs. 4 C and 5, namely 1.4 to 1.6.
Fig. 10 shows predictions of the models for reverse transport, whereby no critical differences arise between the two models. The predicted extracellular pH dependencies of reverse transport are shown in the top panels with the respective data for cytoplasmic Na concentrations of 140 and 10 mM. The predicted pH–activity relations are steeper than the data. The half-maximal extracellular pH values in simulations are ∼7.7 with 140 mM cytoplasmic Na, which fits well with the data. We did not determine in detail the Na dependence of reverse transport on cytoplasmic Na, but it is evident that the transport activities predicted by the models underestimate by ∼30% the relative reverse exchange activity determined experimentally with 10 mM of cytoplasmic Na. In other words, the apparent cytoplasmic Na affinity is somewhat too low to accurately predict the data. The bottom panels of Fig. 10 show the predicted cytoplasmic Na dependence of reverse transport at extracellular pH values of 6.0 and 8.2. In contrast to the Na–activity relations for maximal forward transport, the reverse transport activity shows cooperative activation by cytoplasmic Na at all pH values on the trans side. As noted in the Introduction, this pattern was described in a previous study (Green et al., 1988), and results from that study are scaled to the simulations together with a Hill equation with a slope of 2. As with the forward mode, the Hill coefficients that would be derived from our simulations (1.8–1.9) are somewhat smaller than the coefficient determined from the experimental data.
In Fig. 11 the predicted inhibition of forward transport by extracellular acidification is shown in the top panels, and inhibition by cytoplasmic Na is shown in the bottom panels in relation to our data and another relevant dataset from the literature (Dascalu et al., 1991). These latter data are from a study of rat calvari cells (RCJ1.20), and a similar dataset is available from Green et al. (1988). Again, no critical differences between the two models are noteworthy. The simulated inhibition by extracellular acidification in both models describes well our data at 140 mM Na, given as open circles, as well as the equivalent inhibition curve from Dascalu et al. (1991) over an extended pH range. In addition, the simulations predict reasonably the wave form of inhibition at 20 mM of extracellular Na. The bottom panels of Fig. 11 show the inhibition of forward transport predicted by the models for increasing cytoplasmic Na concentrations at different cytoplasmic pH values. The data points for 0 and 20 mM of cytoplasmic Na and a cytoplasmic pH of 6.8 are from our previous study in which cells were treated with pertussis toxin to block a strong Na-dependent regulatory mechanism (Hilgemann et al., 2006). As described in that article and by others (Ishibashi et al., 1999), a rise of cytoplasmic Na to just 10 mM can cause a long-term inhibition of NHE1 activity that can be prevented by pretreatment of cells with pertussis toxin. Obviously, the presence of a long-term regulatory process that depends on cytoplasmic Na compromises predictions of a simple model. Presumably, this phenomenon reflects the function of an Na-dependent G protein. Without further analysis, it seems reasonable to assume that the near lack of effect of 20 mM of cytoplasmic Na on forward transport in cells treated with pertussis toxin reflects the true Na dependence of the transport mechanism. The available data at a cytoplasmic pH of 6.8 are predicted well by the simulations.
Fig. 12 shows the predicted half-maximal extracellular Na and cytoplasmic proton concentrations predicted from the models for forward transport under the conditions shown in Figs. 2–4. In contrast to simple consecutive transport models, the half-maximal concentrations can shift in either direction as the counter ion concentration is varied on the trans membrane side. For extracellular Na (Fig. 12 A), the predicted half-maximal concentrations increase over the pH range of 8.0–7.0. For both models, the K1/2 then decreases somewhat at lower pH. Although the model predictions do not match the average data points well, the large magnitude of data scatter at pH 6.0 does not allow a clear conclusion as to whether contradictions are significant for evaluation of the models. As shown in Fig. 12 B, the predicted half-maximal cytoplasmic proton concentrations decrease as the extracellular Na concentration is increased in both models, as is the case for the experimental data. We point out that the shifts occurring in simulations are less than those determined experimentally, but the shifts are in qualitative agreement with the experimental data.
DISCUSSION
We have characterized steady-state function of the ubiquitous Na/H exchanger, NHE1, using patch clamp to control the composition of the cytoplasm and oscillating extracellular pH electrodes to quantify proton fluxes from transport-induced pH gradients. Although these methods have not been used widely, they are well established and validated (Smith and Trimarchi, 2001; Kang et al., 2003). We have analyzed our data in relation to two coupled dimer transport models that appear broadly consistent with our new data and data from the literature. In one model, coupling can occur when paired monomers are open to the same side, such that the two monomers subsequently carry out transport in a parallel fashion. In the second model, monomers operate with strict 2Na/2H stoichiometry, and translocation of two ions to one side favors the reverse translocation reaction by the paired monomer. In discussing this work, we point out first differences between our data and previous work on mammalian NHEs. Second, we discuss the specific transport data, and finally we discuss the transport models per se.
Discrepancies between This Study and Previous Studies
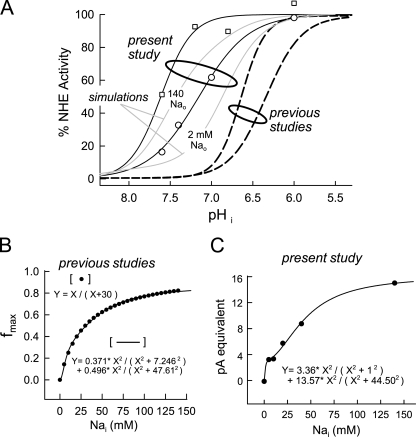
Fig. 13 summarizes discrepancies between the present and previous studies. In Fig. 13 A, the pH dependencies of forward transport are given as a percentage of maximal activity. Open symbols give the two relevant datasets from Fig. 6, and gray lines show the simulated pH dependence of forward transport for the serial model with 140 and 2 mM of extracellular Na. Results for the parallel model were only a little different. The simulation with 140 mM Na generates a Na–activity relation that falls roughly halfway between the two datasets. Most published values for the half-maximal transport activity under control conditions fall in a pH range of 6.8–6.5 with Hill slopes in the range of 1.6–3 (Fig. 13, dotted black lines). Still higher Hill slopes have sometimes been observed for activation by cytoplasmic protons, presumably reflecting proton regulatory sites that activate transporters as pH falls and/or exchangers are activated by cell signaling pathways (Wakabayashi and Goshima, 1981; Wakabayashi et al., 1997a, 2003). Our results are shifted by nearly one pH unit in the alkaline direction. For isotope flux studies that use very low Na concentrations, our simulations offer a partial explanation in that the apparent cytoplasmic proton affinity increases as extracellular Na is reduced.
Figure 13.
Summary of apparent discrepancies between this study and previous studies of NHE. (A) Symbols reiterate the cytoplasmic pH dependence obtained with 140 mM of extracellular Na from composite data using different cells (open squares) and from experiments in which the cytoplasmic pH was changed (open circles). Simulated results are given as gray lines for 140 and 2 mM of extracellular Na, whereby the fluxes are scaled and plotted as a percentage of maximum. Dotted lines give the range of “typical” pH–flux relations from the literature. (B) A simple Michaelis-Menton curve is given as pseudo-data points. The line that fits the data points is the sum of two Hill equations with slope coefficients of two, as given in the figure. (C) Data points give the maximal proton fluxes obtained from analysis of the cytoplasmic proton concentration dependence of forward NHE activity in Fig. 4. The curve describing the relation is the sum of two Hill equations with slope coefficients of two, as given in the figure.
The second discrepancy concerns the extracellular Na dependence of exchange, whereby we observe both biphasic and steep extracellular Na dependence. For both models, the overall Na dependence of transport activity can be viewed as the composite function of two populations of transporters in different regulatory states, whereby the serial model readily reconstructs more details of the study. In Fig. 13 B we point out how well the sum of two cooperative reactions can account for apparently simple transport data. Plotted in Fig. 13 B is a rectangular hyperbola as 20 data points: Y = X/(X + 30). These points reproduce the typical extracellular Na dependence of NHE1 given in the literature, and the line in Fig. 13 B is the best fit of the data points to the sum of two Hill equations with slope coefficients of 2. One has a K1/2 of 7.24 mM, and one has a K1/2 of 47.6 mM. The sum of the functions approximates the function of the serial model, namely that two transporter species operate with 2:2 stoichiometry, but with different apparent affinities. To underscore this issue further, Fig. 13 C shows the Na concentration–flux relation determined in Fig. 4 D for the maximal (extrapolated) NHE activity with saturating cytoplasmic proton concentrations. To our knowledge, this relationship was never before predicted. The slope of the Hill equation fit to these data was 0.6. The line in Fig. 13 C is again the sum of two Hill equations, both with slopes of 2, as roughly expected from the serial model. To describe the data well, the high affinity component has a K1/2 of 1 mM, and the low affinity component has a K1/2 of 44.5 mM.
Cytoplasmic pH Dependence of NHE1
NHE1 activity is thought to be controlled by cytoplasmic pH sensors that ensure that exchange is activated only when the cytoplasm is significantly acidified (Wakabayashi et al., 1992). In our experiments, however, exchange activity appears to be “deregulated,” and multiple factors may contribute to this impression. First, we have used cytoplasmic solutions with high proton buffer concentrations. Ca transporters are reported to be activated by Ca buffers, independent of free Ca (Al-Jobore and Roufogalis, 1981; Kotagal et al., 1983; Trosper and Philipson, 1984; Romero and Salas, 1995), and the presence of proton buffers might in some way affect proton binding by NHEs. We cannot completely discount a possibility that proton transport is limited by proton diffusion in intact cells, but from simple calculations and simulations this appears unlikely with mobile proton buffers at concentrations of 1 mM or more. Second, we used EGTA with no added cytoplasmic Ca. Complete chelation of Ca might dissociate important regulatory factors from the cell membrane. Third, and most probable to us as a key factor, our solutions contained nominally no cytoplasmic Na. On the one hand, cytoplasmic Na does not appear to strongly compete with cytoplasmic protons (see Fig. 11). But on the other hand, as noted in Results, cytoplasmic Na can have very large regulatory effects on NHE1 activity (Ishibashi et al., 1999; Hilgemann et al., 2006). Specifically, cytoplasmic Na concentrations in the range of 5–10 mM can have long-term inactivating effects that are G protein dependent, so that complete Na removal from the cytoplasm might have long-term activating effects that modify regulation by protons. The idea that cytoplasmic Na ions, as well as protons, might importantly regulate NHE activity bears a direct parallel to findings for Na/Ca exchange, where both cytoplasmic Na and Ca are critical (Hilgemann et al., 2006).
Na Dependence of NHE1
Our findings about the extracellular Na dependence of NHE1 have potential implications for the exchanger's stoichiometry and the exchange mechanism itself. As pointed out in the Introduction, a simple transport function of mammalian NHEs (Kinsella and Aronson, 1982; Jean et al., 1985; Schmalzing et al., 1986; Semplicini et al., 1989; Doktor et al., 1991; Levine et al., 1993; Demaurex et al., 1995; Wu and Vaughan-Jones, 1997; Slepkov et al., 2007) was challenged by multiple previous studies that showed cooperative activating effects of Na (Green et al., 1988; Otsu et al., 1989, 1993). On the basis of the present work and the cited articles, it is established that the Na dependence of exchange activity can be cooperative from both membrane sides. This cooperativity is unlikely to reflect Na-dependent activation processes (i.e., regulatory processes) because in this case exchange activity in both directions would be activated by Na on the opposite membrane side. In contrast, reverse NHE transport is robust in the absence of extracellular Na (Fig. 8), and forward transport is robust in the absence of cytoplasmic Na (Figs. 3–5). Thus, it appears probable to us that the usual, nearly hyperbolic shapes of published Na–flux relations for NHE1 indeed mask complex transport functions, as illustrated in Fig. 13 and in our simulations.
Cis-trans Ion Interactions
As mentioned in Results, it is predicted for a consecutive exchange mechanism (Lauger, 1987) that under the zero-trans condition half-maximal concentrations for transport from the cis side will shift to lower concentrations in proportion to the reduction of the maximal activity, as the concentration of the counter-transported ion on the trans side is reduced. For the forward transport mode (Fig. 4 C), we find that the half-maximal extracellular Na concentration shifts from 78 mM at a cytoplasmic pH of 6.0 to 34 mM at a cytoplasmic pH of 7.6, whereby the maximal proton flux at high Na is decreased by a factor of 2.9 (Fig. 4, C and D). The shift occurs in the direction expected for a consecutive model, but it is clearly smaller than expected.
We are aware of only one other study in the literature in which the extracellular Na dependence of exchange was determined systematically at different cytoplasmic acidities, and there was no clear change with changes of cytoplasmic pH (Green et al., 1988). In that study using osteoblasts, the extracellular Na dependence of exchange was unaffected by cytoplasmic alkalinization from 6.3 to 6.8, and it was unaffected by the presence of 40 mM of cytoplasmic Na at a cytoplasmic pH of 6.3. For reverse transport, we find that reduction of maximal transport activity by a factor of five with a reduction of cytoplasmic Na from 70 to 10 mM causes only a very modest 40% reduction of the half-maximal proton concentration on the extracellular side (Fig. 8). One would have expected transport to remain robust at more alkaline pH values with reduction of cytoplasmic Na, if a simple consecutive transport mechanism were operative.
For reasons outlined here and in the Results, it seems possible that two Na ions are transported per cycle most or all of the time by NHE1. Our modeling effort was guided by strong evidence that the exchanger is a dimer (Hisamitsu et al., 2004, 2006; Moncoq et al., 2008), by the previous studies suggesting a more complex NHE transport mechanism than generally assumed (Otsu et al., 1989, 1993), and by other transporters for which evidence has accumulated that multiple substrate sites exist in a single functional unit (Carruthers and Helgerson, 1991). In the case of glucose transporters (Carruthers and Helgerson, 1991), as in our serial model, it is suggested that substrates can bind on opposite sides simultaneously with functional consequences for transport function.
Reiteration of Different Possibilities for Dimer Coupling
Ion dependencies of NHE1 activity, described here, are accounted for in the parallel model as follows: At cytoplasmic pH values of more alkaline than 6.5, exchangers exist primarily in the Mode 2 form that carries out transport with a 2H/2Na stoichiometry. Na dependence is therefore steep and displays a Hill coefficient of ∼2. With acidification, transporters shift to the Mode 1 and then transport with a 1Na/1H stoichiometry, whereby the shift between modes can generate a biphasic dependency on cytoplasmic protons (see Fig. 9). There is one discrepancy to the dataset: At low cytoplasmic pH, the Na dependency follows a simple Michaelis-Menton form. High and low affinity components (see left inset in Fig. 3) are not reproduced, and the serial model does somewhat better.
The extracellular Na dependencies of NHE1 are explained in detail by the serial model as follows: When the cytoplasmic proton concentration is high and extracellular Na is low, transporters accumulate in the E2 configuration with both binding sites open to the outside (see Fig. 1 B). In this configuration, the reaction transporting Na to the cytoplasmic side is very fast, resulting in a transport component with high apparent Na affinity. As cytoplasmic pH is increased, the Na dependence becomes shaped by the 2:2 stoichiometry of the monomer. With the model parameters used, these complexities are less pronounced in simulations than in the experimental results (Fig. 9 B). As implied in Fig. 13, the model can readily produce a dataset that could be interpreted as a simple 1:1 Na/H exchange process.
Experimental Distinction between Models and Alternative Models
The major remaining question is how such different models can be distinguished experimentally and/or what other models or modeling approaches will be required to understand the basic operation of mammalian NHEs. First, definitive evidence for the stoichiometry of ion binding by NHE1 monomers must be achieved, and crystallographic studies are the obvious pathway to such data for Na binding sites. Second, if mutations could be developed that block dimerization while maintaining robust monomer function, it would be possible to analyze definitively the function of NHE monomers. Third, it may be revealing to develop dimers of different mutated exchangers with the expectation that new phenotypes will be generated if physical interactions between monomers are critical for NHE1 function.
In summary, we have shown that the extracellular Na dependence of forward NHE1 transport can take on a form consistent with transport of two Na ions per cycle, similar to a previous study (Green et al., 1988) for the cytoplasmic Na dependence of reverse exchange. We have documented multiple complexities of NHE1 function that are not explained by simple transport models, and we have presented two different models that can account reasonably for the available data. This work underscores a great need for new functional approaches to study NHE1 if fundamental issues about its molecular operation are to be resolved with confidence.
Supplementary Material
Acknowledgments
We thank Dr. Gary Shull (Cincinnati) for providing skin fibroblasts from NHE−/− mice and Dr. John Orlowski (Montreal) for comments on an early version of this article.
This work was supported by NIH grants HL0679420 and HL051323 to D.W. Hilgemann and grants DK48482 and DK20543 to O.W. Moe. D. Fuster was supported by a fellowship grant from the Swiss National Science Foundation and a Seed Grant from the Charles and Jane Pak Center of Mineral Metabolism.
Edward N. Pugh Jr. served as editor.
Abbreviations used in this paper: CHO, Chinese hamster ovary; DMEM, Dulbecco's modified Eagle's medium; NHE, Na/H exchanger; OK, opossum kidney.
References
- Al-Jobore, A., and B.D. Roufogalis. 1981. Influence of EGTA on the apparent Ca2+ affinity of Mg2+-dependent, Ca2+-stimulated ATPase in the human erythrocyte membrane. Biochim. Biophys. Acta. 645:1–9. [DOI] [PubMed] [Google Scholar]
- Arkin, I.T., H. Xu, M.O. Jensen, E. Arbely, E.R. Bennett, K.J. Bowers, E. Chow, R.O. Dror, M.P. Eastwood, R. Flitman-Tene, et al. 2007. Mechanism of Na+/H+ antiporting. Science. 317:799–803. [DOI] [PubMed] [Google Scholar]
- Aronson, P.S., J. Nee, and M.A. Suhm. 1982. Modifier role of internal H+ in activating the Na+-H+ exchanger in renal microvillus membrane vesicles. Nature. 299:161–163. [DOI] [PubMed] [Google Scholar]
- Brett, C.L., M. Donowitz, and R. Rao. 2005. Evolutionary origins of eukaryotic sodium/proton exchangers. Am. J. Physiol. Cell Physiol. 288:C223–C239. [DOI] [PubMed] [Google Scholar]
- Carruthers, A., and A.L. Helgerson. 1991. Inhibitions of sugar transport produced by ligands binding at opposite sides of the membrane. Evidence for simultaneous occupation of the carrier by maltose and cytochalasin B. Biochemistry. 30:3907–3915. [DOI] [PubMed] [Google Scholar]
- Dascalu, A., Z. Nevo, and R. Korenstein. 1991. Regulation of the Na+/H+ exchanger under conditions of abolished proton gradient: isosmotic and hyperosmotic stimulation. FEBS Lett. 282:305–309. [DOI] [PubMed] [Google Scholar]
- Demaurex, N., J. Orlowski, G. Brisseau, M. Woodside, and S. Grinstein. 1995. The mammalian Na+/H+ antiporters NHE-1, NHE-2, and NHE-3 are electroneutral and voltage independent, but can couple to an H+ conductance. J. Gen. Physiol. 106:85–111. [DOI] [PMC free article] [PubMed] [Google Scholar]
- Denker, S.P., D.C. Huang, J. Orlowski, H. Furthmayr, and D.L. Barber. 2000. Direct binding of the Na–H exchanger NHE1 to ERM proteins regulates the cortical cytoskeleton and cell shape independently of H(+) translocation. Mol. Cell. 6:1425–1436. [DOI] [PubMed] [Google Scholar]
- Dixon, S.J., S. Cohen, E.J. Cragoe Jr., and S. Grinstein. 1987. Estimation of the number and turnover rate of Na+/H+ exchangers in lymphocytes. Effect of phorbol ester and osmotic shrinking. J. Biol. Chem. 262:3626–3632. [PubMed] [Google Scholar]
- Doktor, H.S., N. Benjamin, S.D. Todd, and J.M. Ritter. 1991. Sodium dependence of sodium-proton exchange in platelets from patients with essential hypertension. J. Hum. Hypertens. 5:161–165. [PubMed] [Google Scholar]
- Fuster, D., O.W. Moe, and D.W. Hilgemann. 2004. Lipid- and mechanosensitivities of sodium/hydrogen exchangers analyzed by electrical methods. Proc. Natl. Acad. Sci. USA. 101:10482–10487. [DOI] [PMC free article] [PubMed] [Google Scholar]
- Green, J., D.T. Yamaguchi, C.R. Kleeman, and S. Muallem. 1988. Cytosolic pH regulation in osteoblasts. Interaction of Na+ and H+ with the extracellular and intracellular faces of the Na+/H+ exchanger. J. Gen. Physiol. 92:239–261. [DOI] [PMC free article] [PubMed] [Google Scholar]
- Hilgemann, D.W., and C.C. Lu. 1998. Giant membrane patches: improvements and applications. Methods Enzymol. 293:267–280. [DOI] [PubMed] [Google Scholar]
- Hilgemann, D.W., A. Yaradanakul, Y. Wang, and D. Fuster. 2006. Molecular control of cardiac sodium homeostasis in health and disease. J. Cardiovasc. Electrophysiol. 17:S47–S56. [DOI] [PubMed] [Google Scholar]
- Hisamitsu, T., T. Pang, M. Shigekawa, and S. Wakabayashi. 2004. Dimeric interaction between the cytoplasmic domains of the Na+/H+ exchanger NHE1 revealed by symmetrical intermolecular cross-linking and selective co-immunoprecipitation. Biochemistry. 43:11135–11143. [DOI] [PubMed] [Google Scholar]
- Hisamitsu, T., A.Y. Ben, T.Y. Nakamura, and S. Wakabayashi. 2006. Dimerization is crucial for the function of the Na+/H+ exchanger NHE1. Biochemistry. 45:13346–13355. [DOI] [PubMed] [Google Scholar]
- Hunte, C., E. Screpanti, M. Venturi, A. Rimon, E. Padan, and H. Michel. 2005. Structure of a Na+/H+ antiporter and insights into mechanism of action and regulation by pH. Nature. 435:1197–1202. [DOI] [PubMed] [Google Scholar]
- Ishibashi, H., A. Dinudom, K.F. Harvey, S. Kumar, J.A. Young, and D.I. Cook. 1999. Na(+)-H(+) exchange in salivary secretory cells is controlled by an intracellular Na(+) receptor. Proc. Natl. Acad. Sci. USA. 96:9949–9953. [DOI] [PMC free article] [PubMed] [Google Scholar]
- Jean, T., C. Frelin, P. Vigne, P. Barbry, and M. Lazdunski. 1985. Biochemical properties of the Na+/H+ exchange system in rat brain synaptosomes. Interdependence of internal and external pH control of the exchange activity. J. Biol. Chem. 260:9678–9684. [PubMed] [Google Scholar]
- Kang, T.M., V.S. Markin, and D.W. Hilgemann. 2003. Ion fluxes in giant excised cardiac membrane patches detected and quantified with ion-selective microelectrodes. J. Gen. Physiol. 121:325–347. [DOI] [PMC free article] [PubMed] [Google Scholar]
- Kinsella, J.L., and P.S. Aronson. 1982. Determination of the coupling ratio for Na+ -H+ exchange in renal microvillus membrane vesicles. Biochim. Biophys. Acta. 689:161–164. [DOI] [PubMed] [Google Scholar]
- Kinsella, J.L., P. Heller, and J.P. Froehlich. 1998. Na+/H+ exchanger: proton modifier site regulation of activity. Biochem. Cell Biol. 76:743–749. [DOI] [PubMed] [Google Scholar]
- Kotagal, N., J.R. Colca, and M.L. McDaniel. 1983. Activation of an islet cell plasma membrane (Ca2+ + Mg2+)-ATPase by calmodulin and Ca-EGTA. J. Biol. Chem. 258:4808–4813. [PubMed] [Google Scholar]
- Lacroix, J., M. Poet, C. Maehrel, and L. Counillon. 2004. A mechanism for the activation of the Na/H exchanger NHE-1 by cytoplasmic acidification and mitogens. EMBO Rep. 5:91–96. [DOI] [PMC free article] [PubMed] [Google Scholar]
- Lauger, P. 1987. Voltage dependence of sodium-calcium exchange: predictions from kinetic models. J. Membr. Biol. 99:1–11. [DOI] [PubMed] [Google Scholar]
- Levine, S.A., M.H. Montrose, C.M. Tse, and M. Donowitz. 1993. Kinetics and regulation of three cloned mammalian Na+/H+ exchangers stably expressed in a fibroblast cell line. J. Biol. Chem. 268:25527–25535. [PubMed] [Google Scholar]
- Meima, M.E., J.R. Mackley, and D.L. Barber. 2007. Beyond ion translocation: structural functions of the sodium-hydrogen exchanger isoform-1. Curr. Opin. Nephrol. Hypertens. 16:365–372. [DOI] [PubMed] [Google Scholar]
- Moncoq, K., G. Kemp, X. Li, L. Fliegel, and H.S. Young. 2008. Dimeric structure of human Na+/H+ exchanger isoform 1 overproduced in Saccharomyces cerevisiae. J. Biol. Chem. 283:4145–4154. [DOI] [PubMed] [Google Scholar]
- Orlowski, J., and S. Grinstein. 2004. Diversity of the mammalian sodium/proton exchanger SLC9 gene family. Pflugers Arch. 447:549–565. [DOI] [PubMed] [Google Scholar]
- Orlowski, J., and S. Grinstein. 2007. Emerging roles of alkali cation/proton exchangers in organellar homeostasis. Curr. Opin. Cell Biol. 19:483–492. [DOI] [PMC free article] [PubMed] [Google Scholar]
- Otsu, K., J. Kinsella, B. Sacktor, and J.P. Froehlich. 1989. Transient state kinetic evidence for an oligomer in the mechanism of Na+-H+ exchange. Proc. Natl. Acad. Sci. USA. 86:4818–4822. [DOI] [PMC free article] [PubMed] [Google Scholar]
- Otsu, K., J.L. Kinsella, P. Heller, and J.P. Froehlich. 1993. Sodium dependence of the Na(+)-H+ exchanger in the pre-steady state. Implications for the exchange mechanism. J. Biol. Chem. 268:3184–3193. [PubMed] [Google Scholar]
- Padan, E., T. Tzubery, K. Herz, L. Kozachkov, A. Rimon, and L. Galili. 2004. NhaA of Escherichia coli, as a model of a pH-regulated Na+/H+ antiporter. Biochim. Biophys. Acta. 1658:2–13. [DOI] [PubMed] [Google Scholar]
- Pang, T., T. Hisamitsu, H. Mori, M. Shigekawa, and S. Wakabayashi. 2004. Role of calcineurin B homologous protein in pH regulation by the Na+/H+ exchanger 1: tightly bound Ca2+ ions as important structural elements. Biochemistry. 43:3628–3636. [DOI] [PubMed] [Google Scholar]
- Ramsey, I.S., M.M. Moran, J.A. Chong, and D.E. Clapham. 2006. A voltage-gated proton-selective channel lacking the pore domain. Nature. 440:1213–1216. [DOI] [PMC free article] [PubMed] [Google Scholar]
- Romero, P.J., and V. Salas. 1995. Alteration by EGTA of the human red cell Ca(2+)-ATPase. Biochim. Biophys. Acta. 1240:115–117. [DOI] [PubMed] [Google Scholar]
- Schmalzing, G., T. Schlosser, and P. Kutschera. 1986. Li+ as substrate of the synaptosomal Na+/H+ antiporter. J. Biol. Chem. 261:2759–2767. [PubMed] [Google Scholar]
- Semplicini, A., A. Spalvins, and M. Canessa. 1989. Kinetics and stoichiometry of the human red cell Na+/H+ exchanger. J. Membr. Biol. 107:219–228. [DOI] [PubMed] [Google Scholar]
- Slepkov, E.R., J.K. Rainey, B.D. Sykes, and L. Fliegel. 2007. Structural and functional analysis of the Na+/H+ exchanger. Biochem. J. 401:623–633. [DOI] [PMC free article] [PubMed] [Google Scholar]
- Smith, P.J., and J. Trimarchi. 2001. Noninvasive measurement of hydrogen and potassium ion flux from single cells and epithelial structures. Am. J. Physiol. Cell Physiol. 280:C1–C11. [DOI] [PubMed] [Google Scholar]
- Trosper, T.L., and K.D. Philipson. 1984. Stimulatory effect of calcium chelators on Na+-Ca2+ exchange in cardiac sarcolemmal vesicles. Cell Calcium. 5:211–222. [DOI] [PubMed] [Google Scholar]
- Wakabayashi, S., and K. Goshima. 1981. Na+-Ca2+ exchange system and its physiological role (author's transl). Tanpakushitsu Kakusan Koso. 26:2055–2069. [PubMed] [Google Scholar]
- Wakabayashi, S., P. Fafournoux, C. Sardet, and J. Pouyssegur. 1992. The Na+/H+ antiporter cytoplasmic domain mediates growth factor signals and controls “H(+)-sensing.” Proc. Natl. Acad. Sci. USA. 89:2424–2428. [DOI] [PMC free article] [PubMed] [Google Scholar]
- Wakabayashi, S., B. Bertrand, M. Shigekawa, P. Fafournoux, and J. Pouyssegur. 1994. Growth factor activation and “H(+)-sensing” of the Na+/H+ exchanger isoform 1 (NHE1). Evidence for an additional mechanism not requiring direct phosphorylation. J. Biol. Chem. 269:5583–5588. [PubMed] [Google Scholar]
- Wakabayashi, S., T. Ikeda, T. Iwamoto, J. Pouyssegur, and M. Shigekawa. 1997. a. Calmodulin-binding autoinhibitory domain controls “pH-sensing” in the Na+/H+ exchanger NHE1 through sequence-specific interaction. Biochemistry. 36:12854–12861. [DOI] [PubMed] [Google Scholar]
- Wakabayashi, S., M. Shigekawa, and J. Pouyssegur. 1997. b. Molecular physiology of vertebrate Na+/H+ exchangers. Physiol. Rev. 77:51–74. [DOI] [PubMed] [Google Scholar]
- Wakabayashi, S., T. Hisamitsu, T. Pang, and M. Shigekawa. 2003. Kinetic dissection of two distinct proton binding sites in Na+/H+ exchangers by measurement of reverse mode reaction. J. Biol. Chem. 278:43580–43585. [DOI] [PubMed] [Google Scholar]
- Wang, D., S.M. King, T.A. Quill, L.K. Doolittle, and D.L. Garbers. 2003. A new sperm-specific Na+/H+ exchanger required for sperm motility and fertility. Nat. Cell Biol. 5:1117–1122. [DOI] [PubMed] [Google Scholar]
- Wu, M.L., and R.D. Vaughan-Jones. 1997. Interaction between Na+ and H+ ions on Na-H exchange in sheep cardiac Purkinje fibers. J. Mol. Cell. Cardiol. 29:1131–1140. [DOI] [PubMed] [Google Scholar]
Associated Data
This section collects any data citations, data availability statements, or supplementary materials included in this article.


