

Abstract
T cell receptor engagement results in the reorganization of intracellular and membrane proteins at the T cell-antigen presenting cell interface forming the immunological synapse (IS), an event required for Ca2+ influx. KCa3.1 channels modulate Ca2+ signaling in activated T cells by regulating the membrane potential. Nothing is known regarding KCa3.1 membrane distribution during T cell activation. Herein we determined whether KCa3.1 translocates to the IS in human T cells using YFP-tagged KCa3.1 channels. These channels showed identical electrophysiological and pharmacological properties as wild-type channels. IS formation was induced using either anti-CD3/CD28 antibody coated beads for fixed microscopy experiments, or Epstein Barr virus-infected B cells for fixed and live cell microscopy. In fixed microscopy experiments T cells were also immunolabeled for F-actin or CD3ε that served as IS formation markers. The distribution of KCa3.1 was determined with confocal and fluorescence microscopy. We found that upon T cell activation KCa3.1 channels localize with F-actin and CD3ε to the IS but remain evenly distributed on the cell membrane when no stimulus is provided. Detailed imaging experiments indicated that KCa3.1 channels are recruited in the IS shortly after antigen presentation and are maintained there for at least 15–30 min. Interestingly, pre-treatment of activated T cells with the specific KCa3.1 blocker, TRAM-34, blocked Ca2+ influx but channel re-distribution to the IS was not prevented. These results indicate that KCa3.1 channels are a part of the signaling complex that forms at the IS upon antigen presentation.
Keywords: T cell activation, ion channels, membrane distribution
INTRODUCTION
T cell receptor (TCR) engagement by an antigen presenting cell (APC) carrying a foreign antigen results in T cell activation. The process is initiated by reorganization of membrane and cytosolic proteins at the T cell-APC contact interface forming a “signalosome”, the immunological synapse (IS)(9). As a result of IS formation multiple signal transduction pathways are elicited and enhanced leading to the generation of mitogenic signals.
The onset of T cell activation is marked by an increase in intracellular Ca2+ that occurs immediately upon TCR engagement by the APC/antigen. Moreover, increased intracellular Ca2+ levels must be sustained for a long time before interleukin-2 (IL-2) is produced and activation becomes antigen independent (22). A sustained intracellular Ca2+ concentration is thus necessary for T cell activation and gene expression (7, 18). Calcium signaling in human T lymphocytes is modulated via two K channels, the voltage-gated K channel, Kv1.3, and the calcium-activated K channel, KCa3.1. Kv1.3 channels regulate the membrane potential in resting T cells where they represent the dominant conductance (22). However when naïve and central memory T cells are exposed to an antigen and become activated the expression of KCa3.1 channels is strongly enhanced compared to a modest increase in Kv1.3 channels, and KCa3.1 channels become the major regulators of membrane potential in these cells (11, 13). Via regulation of the membrane potential these channels provide the driving force for Ca2+ entry since the efflux of K+ ions assists in maintaining the necessary electrochemical gradient (22).
Interestingly, although recent evidence suggests that Kv1.3 channels localize in the IS in T cells, nothing is known regarding KCa3.1 channel ability to compartmentalize in the IS (21). In the present study we investigated KCa3.1 channel distribution on the plasma membrane upon T cell activation. By utilizing electrophysiological methods and fluorescence microscopy we demonstrate that KCa3.1 channels redistribute to the IS upon TCR binding and become part of the IS signaling complex that facilitates T cell activation.
MATERIALS AND METHODS
Cells and transfection
CD3+ and CD4+ lymphocytes were isolated from healthy donors by E-rosetting (StemCell Tech., Vancouver, Canada) and Ficoll-Paque density gradient centrifugation (ICN Biomedicals, Aurora, OH, USA) and maintained as previously described (23). Freshly isolated human T cells were pre-activated with 4 μg/ml phytohemmaglutinin (PHA, Sigma-Aldrich, St. Louis, MO) and transfected 18–24 hours later with YFP-KCa3.1 with the Amaxa Nucleofector technology (Amaxa Biosystems, Cologne, Germany) using 10×106 cells, 5 μg DNA, and program T20 according to the manufacturer’s instructions. For ratiometric Ca2+ imaging experiments human T cells were activated with 4 μg/ml PHA for 48–72 hr allowing for sufficient expression of the native KCa3.1 channels (13). This became necessary due to a low transfection efficiency that did not allow us to use the transfected T cells (ca. 10%). Blood was obtained from either healthy volunteers or healthy blood bank donors (unutilized blood units from the Hoxworth Blood Bank Center). The blood collection was approved by the IRB of the University of Cincinnati. Epstein Barr virus (EBV)-infected B cells (gift of A.H. Filipovich) were cultured in RPMI 1640 supplemented with 10% fetal bovine serum (FBS), 2 mM glutamine, 100 U/ml of penicillin, and 100 μg/ml of streptomycin. Human embryonic kidney (HEK 293) cells (American Tissue Culture Collection, Manassas, VA) were cultured in Dulbecco’s modified eagle’s medium (Invitrogen, Carlsbad, CA) supplemented with 10% fetal bovine serum, 100 U/ml penicillin and 100 μg/ml streptomycin. HEK 293 cells were transfected with YFP-KCa3.1 using Lipofectamine 2000 (Invitrogen, Carlsbad, CA) according the manufacturer’s instructions at a ratio of DNA to Lipofectamine of 1:5.
Molecular Biology
YFP was appended onto the C-terminus of KCa3.1 via the addition of SalI and BamHI sites to the N- and C-terminus, respectively in a single step PCR reaction resulting in the removal of the stop codon in KCa3.1. This PCR product was subcloned in-frame into the pEYFP-N1 vector (Clontech, Mountain View, CA). The fidelity of this construct was confirmed by sequencing (ABI PRISM 377 automated sequencer, University of Pittsburgh) and subsequent sequence alignment (NCBI BLAST) with KCa3.1 (GenBank™ accession number AF022150).
Measurement of intracellular calcium
Resting and PHA pre-activated T cells were plated on poly-L-lysine coated coverslips and loaded with 1 μM Fura-2/AM (Molecular probes, Eugene, OR) for 35 min at room temperature (22–24°C) in RPMI and rinsed with 0.5 mM Ca2+ Ringer solution containing (in mM): 155 NaCl, 4.5 KCl, 2.5 MgCl2, 10 HEPES, 10 glucose and 0.5 CaCl2, pH 7.4. Cells were stored at 37°C in the dark for up to 2 hr before use. All cell imaging experiments were performed on a Cyt-Im2 Ca2+ imaging system (Intracellular Imaging, Cincinnati, OH) using a ratiometric method as previously described (14, 23). Cells were imaged on a Nikon inverted epifluorescence microscope equipped with a heated microscopy chamber, a 20 X objective and a xenon arc lamp, which was used for the alternative excitation of Fura-2 at 340 and 380 nm. Emitted light passed through a 535 WB35 emission filter and intensity values averaged over either 10 sec (experiments with CD3+ T cells) or 0.5–0.7 sec intervals (experiments with CD4+ T cells) for analysis. For activation with EBV-infected B cells, B cells were pre-pulsed for 2 hr at 37°C with 7 μg/ml staphylococcal enterotoxin B (SEB) (Sigma-Aldrich, St. Louis, MO), centrifuged and re-suspended in 1 ml 0.5 mM Ca2+ Ringer solution and stored at 37°C. For experiments with the KCa3.1 blocker TRAM-34, cells were pre-incubated with 1 μM TRAM-34 (in 0.5 mM Ringer solution) for 15 min before recording. Fura-2 loaded T cells were recorded while bathed in 0.5 mM Ca2+ Ringer solution for 2 min before addition of SEB-pulsed B cells. The cells were then allowed to interact for 15 min before 1–2 μM ionomycin was added as a positive control. Visual inspection showed formation of APC/T cell stable conjugates in the bath. Initial experiments were performed in CD3+ T cells but since SEB only activates CD4+ T cells subsequent experiments were performed in CD4+ T cells to increase the proportion of responding T cells. Cells that had an increase in 340/380 ratio ≥0.1 ratio units were regarded as cells responding to antigen presentation. This value was well above two standard deviations of the average background noise: 0.023±0.024 ratio units as determined in three separate experiments from 440 cells (≥110 cells per experiment) that showed no apparent response. In addition, to obtain the average of the 340/380 ratio the cells that exhibited a calcium response were synchronized to reflect initiation of Ca2+ influx.
T Cell Activation
Transfected T cells were stimulated with 4.5 μm polystyrene beads coated with anti-CD3/CD28 antibodies (Dynal Biotech, Lake Success, NY) as formerly described (30). Transfected T lymphocytes were mixed with the beads at a ratio of 1:1.5 and centrifuged for 5 min at 100 × g. The cells were then incubated at 37°C for 30 min, resuspended and plated onto poly-L-lysine (Sigma-Aldrich, St. Louis, MO) coated coverslips and allowed to attach for 3–5 min. Activation experiments were also performed using EBV-infected B cells as APCs. EBV-infected B cells were pulsed with SEB (7 μg/ml for 2 hr) and loaded with 1 μM DDAO Far Red Cell Tracker (Molecular Probes, Inc., Eugene, OR) for 20 min. T and B cells were then mixed at a ratio of 1:1.5, spun briefly at 1100 rpm and incubated at 37°C for 1–30 min. Finally the cells were plated onto poly-L-lysine coated coverslips.
Immunocytochemistry
Immunolabeling was carried out, in part, as previously described (4). Cells attached onto poly-L-lysine coated coverslips were washed with PBS and fixed with 4% paraformaldehyde (PFA) for 20 min. To double label with CD3ε the cells were blocked using 10% fetal bovine serum (FBS), permeabilized with 0.2% Triton X-100, incubated for 1 hr with goat anti-CD3ε antibody (Santa Cruz Biotechnology, Inc., Santa Cruz, CA) washed and incubated with donkey anti-goat Alexa Fluor 546 fluorescent secondary antibody (Molecular Probes, Inc., Eugene, OR) for one hour. To stain for F-actin Alexa Fluor 546 phalloidin (Molecular Probes, Inc., Eugene, OR) was added for 20 min. Finally the cells were washed and mounted onto glass slides. Samples were visualized by confocal microscopy (Axioscope, Carl Zeiss, Microimaging Inc) using a 63X oil objective lens. The fluorescent probes were excited using an Ar ion laser and a HeNe laser. Data were obtained using the “Multi Track” option of the microscope to exclude cross-talk between detection channels.
Image quantification
To evaluate co-localization of proteins and their position within the IS, unprocessed images were analyzed using the linescan function of the MetaMorph program (Molecular Devices, Downingtor, PA 19335). Briefly, a reference line was drawn along the T/B cell contact site. The software calculates the mean red and green fluorescence intensities along the reference line for 4 pixels of width and plots the measurements in respect to their position within the selected portion of the membrane. To determine the percentage of T/B cell conjugates that formed in the presence or absence of 1 μM TRAM-34 we counted the number of T/B cell conjugates/total number of T cells. Eight random fields were analyzed for each donor and each treatment condition.
Time-lapse microscopy
CD4+ T cells were transfected with YFP-tagged KCa3.1 channels and used for live microscopy experiments 6 hr after transfection. EBV-infected B cells were pre-pulsed with SEB and loaded with 1 μM Far Red DDAO cell tracer (Molecular Probes, Inc., Eugene, OR). T cells were seeded into a heated microscopy chamber (37°C) on poly-L-lysine coated coverslips. Next, B cells were added and time-lapse images were recorded using a Plan- Apochromat 60 X oil immersion objectives on a Nikon Microphot FXA inverted microscope coupled to an Orca-ER cooled camera (Axioscope, Carl Zeiss, Microimaging Inc). Images were processed using the Metamorph software.
Electrophysiology
Experiments were performed in the whole cell configuration using an Axopatch 200B amplifier (Axon Instruments, Foster City, CA, USA) at room temperature (22°C). The external solution was (in mM): 140 NaCl, 4.5 KCl, 2 CaCl2, 1 MgCl2, 10 Hepes, pH 7.4. The pipette solution was (in mM): 145 K aspartate, 8.5 CaCl2, 10 EGTA, 2 MgCl2 and 10 Hepes, pH 7.2, with an estimated free Ca2+ concentration of 1 μM (13). All solutions were 290–310 mOsm. The cells were continuously perfused at a constant rate of 2 ml min−1. Electrodes were pulled from TW150F-4 glass micropipettes (World Precision Instruments, Sarasota, FL) on a horizontal pipette puller (model P-97, Sutter instrument CO., USA) and had a resistance of 4–6 MΩ. KCa3.1 current was measured in voltage-clamp mode and induced by ramp depolarization from −120 mV to +40 mV, 200 ms duration, every 10 s, −80 mV holding potential (HP). Data were corrected for a liquid junction potential of −10 mV (23). KCa3.1 slope conductance was measured between −100 mV and −60 mV. The digitized signals were stored and analyzed using pClamp 9 software (Axon Instruments).
Statistical Analysis
All data are presented as means ± SEM. Statistical analyses were performed using Student’s t-test (paired or unpaired); p≤0.05 was defined as significant.
RESULTS
Electrophysiological and pharmacological profile of the cloned YFP-KCa3.1 channel in HEK 293 cells matches the native KCa3.1 channel in human T cells
YFP-tagged KCa3.1 channels were expressed in HEK 293 cells which lack endogenous KCa3.1 channels. Their pharmacological and electrophysiological properties were investigated and compared to native KCa3.1 channels previously described in the literature (13). KCa3.1 currents were recorded using the whole cell configuration and with a pipette solution of 1 μM [Ca2+] that allows KCa3.1 activation (13). Ramp pulse depolarization induced K currents with a reversal potential of −79.0±0.3 mV (n=6) (Fig. 1A). This was indicative of a K+-selective current. Mock-transfected HEK 293 cells transfected with the empty YFP-vector displayed very small background K current (Fig 1A). Overall the KCa3.1 conductance was significantly higher in YFP-KCa3.1 transfected HEK 293 cells as compared to mock transfected cells (Fig. 1B). Furthermore, KCa3.1 current in YFP-KCa3.1 transfected cells was blocked by the specific KCa3.1 blocker TRAM-34 (kind gift of K.G. Chandy) (Fig. 1A-B) (28). Collectively these electrophysiological and pharmacological studies confirm that transfection of HEK 293 cells with the YFP-KCa3.1 clone resulted in the expression of functional KCa3.1 channels which are functionally identical with their native counterparts as their characteristics are in agreement with previous reports (13).
Figure 1. Functional and pharmacological properties of recombinant YFP-tagged KCa3.1 channels.

A. Representative traces shown were obtained in HEK 293 cells transfected with YPF-KCa3.1 and YFP-vector (pEYFP-N1, control). YFP-KCa3.1 currents were blocked by 1 μM TRAM-34. Currents were induced by ramp depolarization from −120 mV to +40 mV (−80 mV HP). The theoretical EK was −88 mV. B. The KCa3.1 conductance increased significantly in YPF-KCa3.1 transfected HEK 293 cells compared with mock-transfected cells (n=6, #p=0.003). The YFP-KCa3.1 currents decreased significantly after application of 1 μM TRAM-34 (n=6, **, p=0.02).
Overexpression of functional YFP-tagged KCa3.1 channels in human primary T lymphocytes
Next, functional YFP-KCa3.1 channels were expressed in primary human T lymphocytes. To achieve this, pre-activated human T cells were transfected with YFP-tagged KCa3.1 channels and subsequently used for whole-cell voltage-clamp experiments six hours after transfection. Our results revealed an up-regulation of KCa3.1 current in transfected as compared to non-transfected T cells (Fig. 2A). Similar membrane capacitance, a measure of cell surface area, was measured in transfected and non-transfected cells: 1.10±0.10 pF (n=5) and 1.08±0.11 pF (n=5, p=0.89), respectively (27). This indicated that there was a significant increase in the number of functional KCa3.1 channels/cell expressed in transfected as compared to non-transfected T cells. However, the degree of this increase may be accentuated or diminished if differences in channel open probability were great between the control and transfected groups. Moreover YFP-KCa3.1 channel transfected T cells were visualized with confocal microscopy (Fig. 2A inset) and these data showed that KCa3.1 channels were evenly distributed on the plasma membrane although we did observe some intracellular expression of YFP-tagged KCa3.1 channels in some cells (data not shown). Further experiments indicated that YFP-KCa3.1 channels in T cells are sensitive to TRAM-34 as exposure to 1 μM TRAM-34 induced 68±8% inhibition of KCa3.1 current (n=6, p=0.009) (Fig. 2B) (28). Overall these data demonstrate that functional YFP-tagged KCa3.1 channels were successfully expressed on the plasma membrane of human T lymphocytes and this enabled us to use these cells for colocalization studies.
Figure 2. Expression of functional YFP-tagged KCa3.1 channels in human T cells.
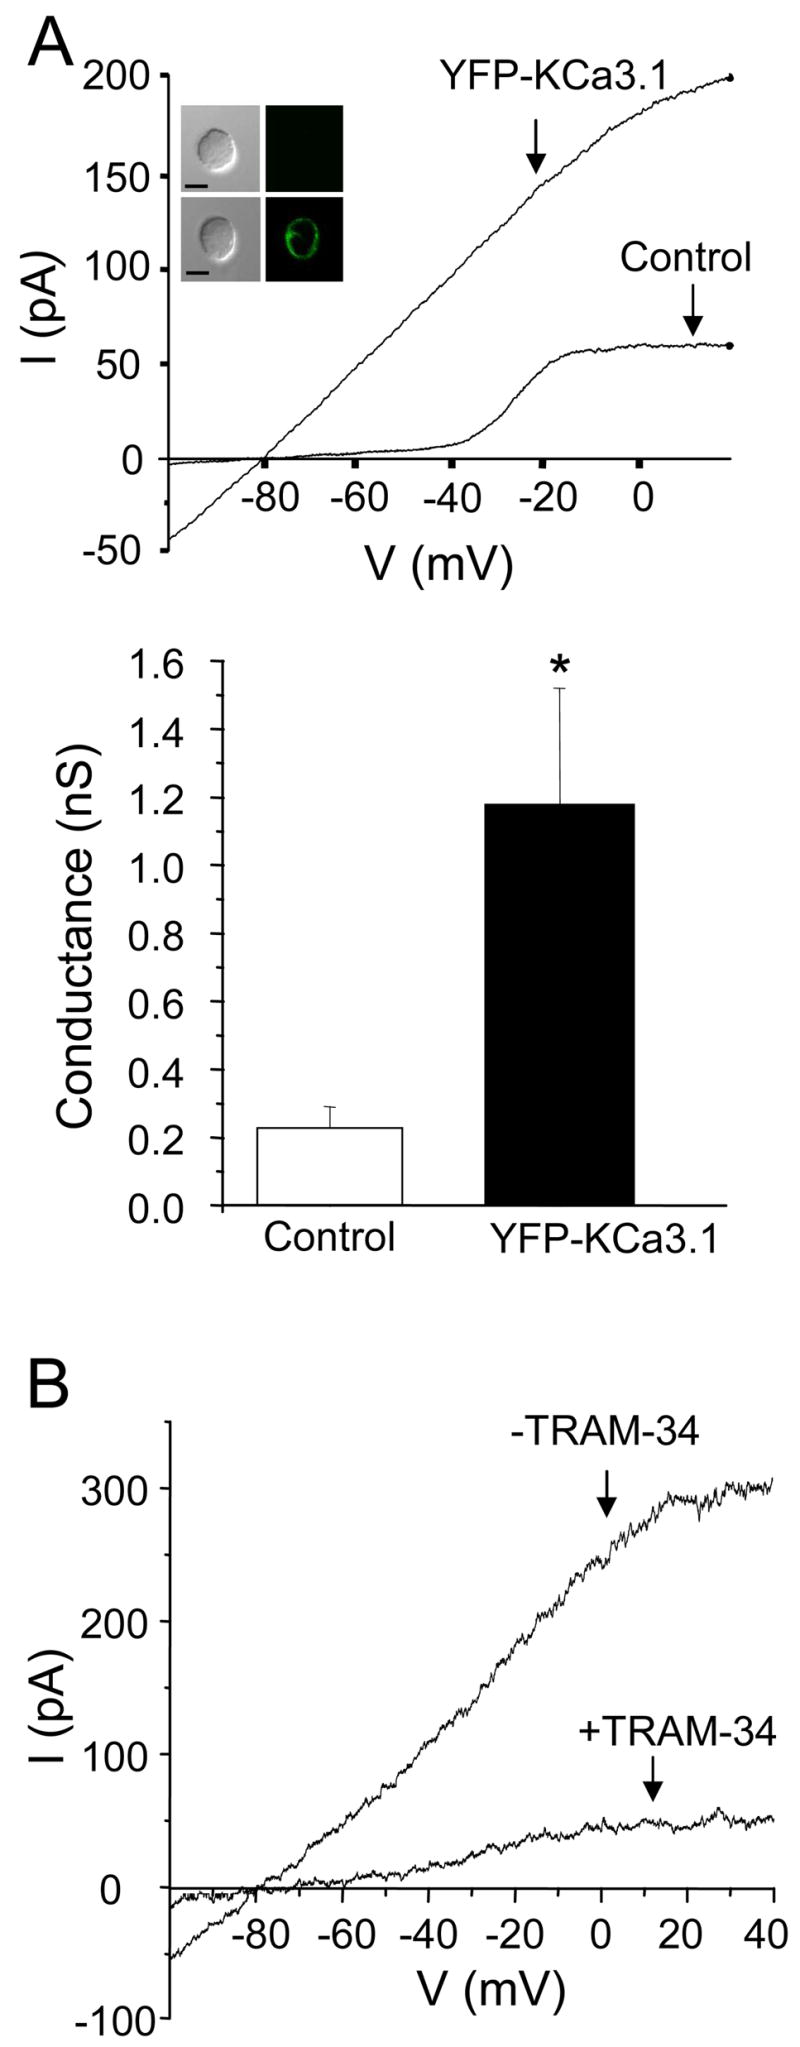
A. Top panel: Representative current-voltage relationships obtained from YPF-KCa3.1 transfected T cells and non-transfected (control) T cells are shown. Control T cells have undergone the same transfection procedure as YFP-KCa3.1 channel transfected T cells. Currents were obtained by ramp depolarization as described in the legend of figure 1. Inset: Representative images of a control (top panel) and transfected (lower panel) cell are shown. Both cells were from the same donor and in the same image. Scale bar: 5μm. Bottom panel: There was a significant increase in KCa3.1 conductance in YPF-KCa3.1 transfected T cells compared with non-transfected T cells which corresponds to an increase in the number of functional KCa3.1 channels/cell. The data are the average of 5 cells from 2–4 donors. *p=0.02. B. KCa3.1 currents decreased significantly after application of 1 μM TRAM-34. Currents, elicited by ramp depolarization as described in the legend of Fig. 1, were recorded continuously before (−TRAM-34) and during exposure to the drug (+TRAM-34).
KCa3.1 channels and F-actin redistribute to the T cell and anti-CD3/CD28 antibody coated bead contact site
After we confirmed that functional KCa3.1 channels were expressed on human T cells we used these cells to explore the possibility that KCa3.1 channels translocate to the IS upon T cell activation. To achieve this we used anti-CD3 and anti-CD28 antibody coated beads to induce T cell activation. This is a well validated system shown by us and others to induce Ca2+ influx and molecular reorganization, both indicative of a functional T cell activation (23, 30). Further, upon T cell activation extensive cytoskeletal reorganization takes place resulting in F-actin accumulation at the contact point and as such it can serve as a marker of IS formation (3, 5). The YFP-KCa3.1 channels were expressed in pre-activated human T cells and were prepared for immunocytochemistry experiments six hours after transfection. This time frame was sufficient for channel expression and insertion in the plasma membrane as demonstrated from the electrophysiological and microscopy experiments described in the previous section (Fig. 2). Moreover the cells were used at this early time point in order to avoid overexpression that could possibly affect the function of the T cells. As shown in Fig. 3 (lower panels) KCa3.1 channels and F-actin reorganize at the T cell-bead contact point after 30 min of conjugation whilst both maintain an even distribution when no beads are attached (Fig. 3, upper panels). Interestingly it appears that F-actin is concentrated mostly on the periphery of the T cell/bead contact point after 30 min of activation as previously shown, whilst KCa3.1 channels acquire a more central localization (Fig. 3 XZ projection) (2, 5). These studies indicate that KCa3.1 channels reorganize at the T cell-bead interface upon conjugation. Still further studies are needed to elucidate the location of KCa3.1 channels in the supramolecular activation complex (SMAC) of the IS and to define the kinetics of their recruitment in the IS. In order to induce the formation of the SMAC we used superantigen-loaded B cells that closely mimic the antigen presenting cells found in vivo.
Figure 3. KCa3.1 channels and F-actin localize at the T cell/bead contact point.
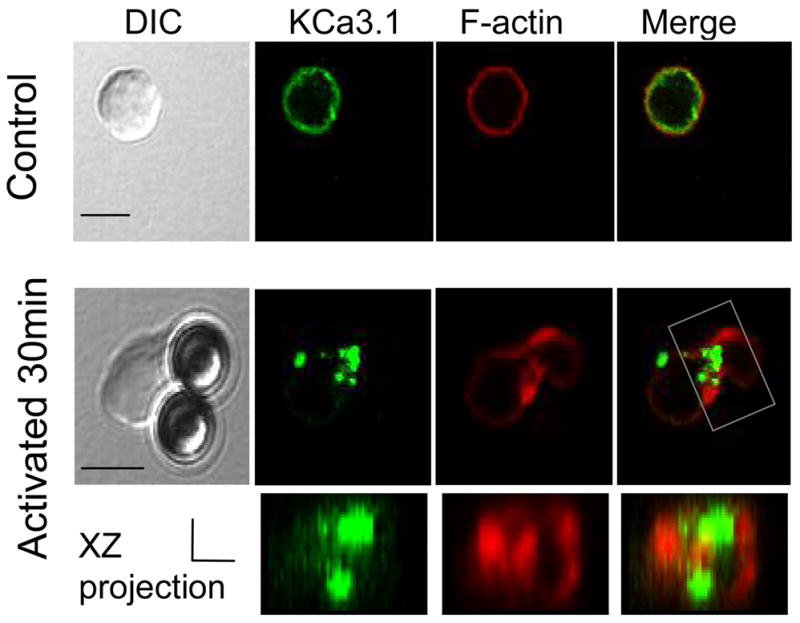
YFP-KCa3.1 transfected T cells were activated with anti-CD3/CD28 antibody coated beads for 30 min, fixed, permeabilized and stained with phalloidin Alexa fluor 546 (to visualize F-actin). T cells not conjugated with beads display uniform distribution of KCa3.1 and F-actin around the membrane (top panels) whilst KCa3.1 and F-actin localize at the T cell/bead contact interface upon conjugation (bottom panels). Scale bar: 5μm. The 3D T/bead interface reconstruction (xz projection) is shown under the corresponding 2D image. The reconstructed portion of the T/B cell complex is indicated by a box in the 2D merged image. Scale bar for the xz projection=2 μm for both x and z axes.
Calcium influx during antigen presentation and its regulation by KCa3.1 channels
EBV-infected B cells that were pre-pulsed with the superantigen SEB were used as APCs to induce T cell activation and IS formation. To ensure that SEB pulsed B cells were competent APCs we investigated their ability to induce elevation of intracellular Ca2+, indicating a productive activation. To that end we examined the Ca2+ response at the single-cell level in PHA-activated T cells loaded with the ratiometric calcium dye Fura-2 (14). T cells were maintained in a heated chamber and the 340/380 ratio was monitored throughout the experiment. After a short equilibration period, SEB-loaded B cells were added in the chamber. Activated human T cells responded to B cell stimulation with an increase in intracellular Ca2+ concentration ([Ca2+]i, Fig. 4A). A large heterogeneity was observed in regards to calcium signaling in these cells including continuous, transient and oscillatory responses (Fig. 4A). These data indicate that SEB-pulsed B cells act as APCs and form conjugates similar to genuine T cell–APC pairs.
Figure 4. SEB pulsed B cell interaction with T cells induces an increase a KCa3.1-dependent increase in cytoplasmic calcium in activated T cells.

A. Human T cells were loaded with the ratiometric dye Fura-2 and stimulated with SEB pulsed B cells for 15 min. Each panel shows a representative trace of cytoplasmic Ca2+ in individual cells. The point of introduction of the B cells into the bath is indicated by an arrow. T cells coming in contact with a B cell displayed differential responses including a sustained increase of intracellular Ca2+, a transient response and an oscillatory response. These data are representative of a total of 35 activated T cells. Unstimulated cells (cells not contacting a B cell) showed little or no response. Yet they responded to ionomycin (I, 1–2 μM). Scale bars correspond to 200 s. Experiments were performed at 29°C. B. Resting and activated CD4+ T cells were or were not pre-treated with 1 μM TRAM-34 before interacting with B cells. The numbers of T/B cell conjugates showing a significant increase in intracellular Ca2+ were normalized for the total number of T cells. Resting T cells showed no significant difference between untreated and pre-treated cells (n=4, >70 cells/experiment and n=4, >50 cells/experiment, from 3 donors; p=0.3). However activated T cells showed a significant decrease in the number of cells that responded when treated with the blocker (untreated: n=4, >40 cells/experiment, treated: n=5 >40 cells/experiment, from 2 donors; p=0.002). C. Average increase in intracellular Ca2+ in control (−TRAM-34) and TRAM-34 treated cells that responded to antigen stimulation (same experiment as panel B). The average cytoplasmic Ca2+ levels for control (−TRAM-34, 118 cells from 4 separate experiments) and cell treated with TRAM-34 (47 cells from 5 separate experiments) were obtained by alignment of the traces so that the times of onset of the Ca2+ response corresponded. Experiments in panels B and C were performed at 34.7±0.2 °C (n=16). D. The number of T/B cell conjugates that form in control and TRAM-34 (1 μM) pre-treated activated T cells was determined in fixed micrographs and reported as percentage of total T cells counted. *p=0.2.
It has been shown that KCa3.1 channels regulate calcium signaling in human activated T cells (13). Accordingly, we observed that TRAM-34, a specific KCa3.1 channel blocker, inhibited the Ca2+ response in these cells (Fig. 4B-C). While on average 46±6 % (n=4, >40 cells/experiment, from 2 donors) of activated T cells showed an increase in intracellular Ca2+ upon exposure to APCs, pre-treatment with 1 μM TRAM-34 induced a significant decrease in the number of responding T cells with only 16±3 % of cells showing a Ca2+ response (n=5, >40 cells/experiment, from 2 donors, p=0.002) (Fig. 4B). Furthermore, the TRAM-34 pre-treated cells that still responded to antigen stimulation displayed a blunted Ca2+ response as compared to control cells (Fig. 4C). As a control we performed identical experiments with resting T cells. In these cells Kv1.3 channels, and not KCa3.1 channels, regulate the membrane potential and the Ca2+ influx and therefore blocking of KCa3.1 channels should not significantly alter the Ca2+ response (22). Indeed a similar number of resting T cells displayed a Ca2+ response upon antigen presentation both in control and TRAM-34 pre-treated cells: 14.5±6.4% and 24.9±6.4 %, respectively (Fig. 4B). To ensure that the decrease in number of activated T cells responding to antigen presentation was not due to a decrease in T/B conjugate formation we compared the number of T/B cell conjugates that form in activated T cells in presence and absence of TRAM-34. Comparable numbers of T/B cell conjugates form in the two groups: 28±10% in control and 36±10% in treated cells (n=3 experiments for each group from 3 different donors, >30 T/B conjugates per donor, p=0.2) (Fig. 4D). Overall these data confirm in our experimental setting that KCa3.1 channels control Ca2+ homeostasis in activated but not in resting T cells (13). Moreover they indicate that blockade of KCa3.1 channels, although inhibiting the Ca2+ response did not preclude the physical association between B and T cells. It still remains to be determined whether KCa3.1 channels are recruited in the IS that forms with APCs and if KCa3.1 blockade affects the formation of the IS and the KCa3.1 recruitment at this site.
Redistribution of KCa3.1 channels at the immunological synapse
Confocal microscopy experiments were performed to study the KCa3.1 channel distribution upon contact with APCs. The YFP-KCa3.1 channels were expressed in human T cells and the T cells were prepared for immunocytochemistry experiments six hours after transfection. It is known that the TCR and associated molecules redistribute to the T cell-APC contact interface upon T cell activation (9). CD3ε is part of the TCR complex that localizes in the center of the mature IS, thus it can be used as a marker of IS formation (8). Our data indicate that KCa3.1 channels redistributed at the T cell-APC interface and colocalized extensively with CD3ε upon conjugation (Fig. 5B-C) but both remained evenly distributed on the membrane when the T-APC were not conjugated (Fig. 5A) or in the absence of SEB (Fig. 5B, top panel). Notably, KCa3.1 channels acquired a central localization within the contact interface early upon IS formation and this localization is maintained for at least 30 min of conjugation. This localization within the IS as well as the co-localization with CD3ε is clearly visible in the XZ projection of the T/B cell interface and it was further confirmed by the position of the peak fluorescence intensities in the linescan graphs (Fig. 5). Interestingly, despite pre-treatment with 1 μM TRAM-34, a concentration already demonstrated to block channel current (Figs 1 and 2) and the Ca2+ response (Fig. 4B-C), KCa3.1 channels were still recruited in the IS and they also maintained the same central location within the IS (Fig. 5C, lower panel). Overall KCa3.1 blockade did not seem to affect IS formation since CD3ε was still recruited and its localization within the IS, together with that of the channel, remained unchanged. Our data therefore suggest that functional KCa3.1 channels are not required for IS formation and maintenance nor for channel membrane trafficking.
Figure 5. KCa3.1 channel redistribution in the immunological synapse.

KCa3.1 channel transfected human T cells were incubated with EBV-infected B cells that had been exposed to medium with or without SEB at 37°C. B cells were labeled with Cell Trace FarRed DDAO (pseudocolored blue). T cells, pre-treated or not pre-treated with TRAM-34 (1 μM) for 15 min, were mixed with B cells and incubated for 1–30 min at 37°C, plated on coverslips, fixed, permeabilized and stained with anti-CD3ε antibody. Representative images are shown for A. T cells that did not form a stable conjugate with SEB infected B cells, B. T cell conjugated with B cells in the absence or presence of SEB after 1 min and C. T cells un/treated with TRAM-34 after 30 min conjugation with SEB-pulsed B cells. Scale bar: 5μm. The three-dimensional T/B cell interface reconstructions are shown under the corresponding 2D images. The area used for the reconstruction is marked in the 2D merged images by a box. The linescan analyses of KCa3.1 (green) and CD3ε (red) fluorescent intensity (FI) over the T/B cell contact area are shown as right panels adjacent to the corresponding micrographs. These images are representative of the results obtained from 5 donors for control experiments and 2 donors for pre-treatment experiments. Scale bar for the xz projection=2 μm for both x and z axes.
Overall, these results indicate that KCa3.1 channels quickly redistribute at the IS upon antigen presentation and therein they aggregate at the center of the IS; a process independent of the activation state of the channels.
To more precisely define the kinetics of KCa3.1 channel distribution in the IS we used time-lapse microscopy to directly image live KCa3.1 channel translocation in T cells as it develops upon encounter with APCs. Activation and IS formation of transfected T cells was induced by SEB-pulsed EBV-infected B cells. The results obtained in these studies confirmed the observations in the fixed microscopy studies, although a certain degree of variability in the kinetics of KCa3.1 channel translocation to the T/B interface was also observed. In the majority of conjugates imaged the channels were recruited at the IS within 40 sec-2 min (5 out of 7 conjugates) (Fig. 6 and Supplemental Movie S1). Only in two conjugates was a longer time necessary for channel recruitment. Interestingly, in some experiments we observed that the channels were recruited upon contact with an APC but then readily relocalized to a second APC upon contact (data not shown) (n=3). It is not uncommon for T cells to undergo serial stimulation by APCs during the activation process (10). But because of the multiple encounters and transient nature of this polarization, these experiments were not included in the overall analysis. In addition we observed two distinct patterns of retention in the IS. Specifically, in 43% of the cells the channels resided in the IS throughout the duration of the whole experiment at least 14–30 min (n=3), whilst in 57% of the conjugates the channels stayed in the synapse for a shorter time (7:04±0:35 min, n=4). Moreover the channels appear to obtain a central localization in 86% of the conjugates studied, and only in 14% maintained a more peripheral distribution (n=7). These data further define the dynamics of KCa3.1 channel recruitment in the IS.
Figure 6. KCa3.1 channel redistribution in live T cells.

Human T cells transfected with YFP-KCa3.1 were seeded on a heated microscopy stage and imaged whilst interacting with SEB-pulsed EBV-infected B cells. In the top row, brightfield images are shown and on the bottom row the corresponding images of KCa3.1 staining intensity are shown using a pseudocolor scale. The location of the B cells is indicated by a white line around the cell membrane. Snapshot sequence corresponds to Supplemental Movie S1. We observed that at time 0:00, before the transfected T cell comes in contact with an APC, KCa3.1 channels are uniformly expressed all along the cell membrane. After 0:42 min, an APC comes in contact with the T cell and, upon contact, the channels begin to accumulate at the IS that forms at the T cell/APC interface where they remain for over 25 min. At 28:42 min the channels began to redistribute along the cell membrane and they acquire a uniform distribution by 35:05 min. Scale bar=5 μm.
DISCUSSION
Sustained TCR engagement by an APC leads to the formation of a highly organized structure, the IS. This is characterized by an extensive reorganization of the actin cytoskeleton as well as specific membrane (TCR and adhesion molecules) and signaling proteins to the T cell/APC contact interface (5, 9, 20). In the present study we demonstrate that KCa3.1 channels are evenly distributed on the membrane of human T lymphocytes but translocate to the IS upon encounter with an APC and become part of the signaling complex that facilitates T cell proliferation and cytokine production. To our knowledge this is the first report showing KCa3.1 channel redistribution at the IS in human T cells upon antigen stimulation.
Experiments were performed on human T cells expressing YFP-tagged KCa3.1 channels. This was made necessary by the fact that, to our knowledge, no specific anti-KCa3.1 antibodies are commercially available. The availability of a specific antibody would have allowed us to study the behavior of native KCa3.1 channels that exist at the appropriate conformational and phosphorylation state as well as in association with other cellular components. Furthermore, from a technical point of view, this would have excluded the limitation inherent in the low efficiency of transfection of primary T cells (i.e. low number of transfected cells available for the experiments). Recombinant channels instead carry the risk of overexpression, which we avoided as much as possible by using the cells as soon as expression was seen. In our experiments the transfected T cells expressed on average a KCa3.1 conductance of 1.3 nS/μm2. This is comparable to the level of expression of native KCa3.1 channels in human T lymphocytes reported after 2 days activation with PHA (1.12 nS/μm2)(13). It is also possible that the YFP tag could have hindered other molecular interactions, although it did not compromise the ability of the channel to enter and exit the IS. Furthermore, a more cytoplasmic distribution has been observed in GFP-tagged channels as compared to native K channels (17). Still, a YFP protein is extremely photostable, thus allowing detailed and prolonged live cell imaging experiments minimizing the risk of photobleaching. Furthermore, these studies using recombinant channels set the stage for future structural-functional studies that will allow the determination of the channel protein sequence/s necessary for its recruitment in the IS and thus the possible mechanisms driving this process.
Electrophysiological experiments indicated that the YFP-KCa3.1 channels displayed biophysical properties identical to their native counterparts and were inhibited by the specific KCa3.1 blocker TRAM-34 (13). This allowed us to express these channels in primary human T lymphocytes and perform localization experiments to demonstrate that KCa3.1 channels localize at the IS. Two methods were used to induce IS formation and T cell activation: CD3/CD28 coated beads and SEB-pulsed EBV-infected B cells. The former have been used as surrogate APCs and they have been shown to induce re-organization of F-actin and accumulation of structural proteins at the bead/T cell contact area (30). We have also shown that CD3/CD28 beads were able to induce a productive activation in human T cells as they can elicit an increase in [Ca2+]i upon contact (23). However, stimulation of T cells with superantigen-loaded B cells more closely resembles the “in vivo” situation where the antigen is presented to the T cell by either B or dendritic cells (9). The association between T cells and these APCs involves adhesion and other co-stimulatory molecules not provided by the CD3/CD28 beads (9). We have confirmed that SEB-pulsed EBV-infected B cells can be used as effective APCs by monitoring the Ca2+ response induced in T cells upon binding (Fig. 4). These experiments were performed in human T cells pre-activated by exposure to PHA for 72 hr. This intervention was shown to induce expression of KCa3.1 channels in human T cells and, in these cells, the Ca2+ response becomes dependent on these channels (13). Different patterns of Ca2+ response were elicited in individual T cells by exposure to the SEB-pulsed B cells. Similar heterogeneity to TCR stimulation was previously observed and described using soluble antigens and CD3/CD28 beads (15, 23, 25). This reflects the mixed T cell population that comprises T cells freshly isolated from the blood and includes T cells at different degrees of activation and development.
Overall, the results presented reveal that KCa3.1 channels moved into the IS immediately upon its formation and they localized with F-actin and CD3ε. Furthermore, fixed microscopy experiments, representative snapshots of the process, revealed that KCa3.1 channels are rapidly recruited at the center of the IS where they reside for at least 30 min after stimulation. We observed that KCa3.1 channels co-localized with CD3ε and were surrounded by F-actin. This is in agreement with F-actin forming a peripheral ring within the IS while the TCR accumulates at the core of the IS (2, 5).
To further substantiate our data we also performed time-lapse microscopy experiments. KCa3.1 channels are recruited early on in the IS in the majority of the cells imaged. Intriguingly we also noted two patterns of recruitment: a sustained recruitment and a shorter lived one. This might reflect the variability in activation and differentiation state of our mixed T cell population, an observation also demonstrated by the variability of our Ca2+ response.
KCa3.1 localization in the IS could have important implications on the channel activity and overall T cell function. It is well known that in activated T cells KCa3.1 channels regulate the membrane potential and as a consequence, Ca2+ influx as well (11, 13). In agreement with the literature, we observed that blockade of KCa3.1 channel activity inhibits the TCR-mediated Ca2+ response in these cells (Fig. 4). Notably, blocking Ca2+ increase does not prevent the formation of tight T/B cell interfaces and accumulation of adhesion molecules at site of contact (29). Interestingly, we observed that when KCa3.1 channels were blocked neither formation of T/B cell conjugates nor KCa3.1 and CD3ε transition to the IS was prevented. So our results suggest that KCa3.1 channel transition to the IS is not dependent on Ca2+ influx. Furthermore it suggests that the functionality of the channel is not integral to its migration to the IS. Similarly, we have observed that Kv1.3 channels can also translocate to the IS when their activity is pharmacologically abrogated (data not shown).
The functional consequences of KCa3.1 channel translocation in the IS might reflect on the Ca2+ response that is triggered upon antigen presentation. It is generally accepted that following TCR engagement the magnitude and pattern of the Ca2+ signaling is in part regulated by the activity of Kv1.3 and KCa3.1 channels (26). It has already been shown that Kv1.3 channels translocate to the IS in human T cells and in the present study we show that KCa3.1 channels also move to the IS upon T cell activation (21). Moreover, it is commonly believed that formation of the IS occurs in order to provide close proximity between various elements of the T cell activation machinery and thus more efficient signaling among them (9). Interestingly, signaling molecules such as protein kinases A (PKA) and C (PKC), which are known regulators of KCa3.1 channel function, have been shown to accumulate in the IS upon T cell activation as well (1, 6, 12, 19, 24, 31). Investigation of the reorganization of PKCθ during IS formation reveals that this PKC isoform sustains a central localization in the IS supramolecular activation complex (16). Furthermore, PKA also moves into the IS 30 min after activation and it partially colocalizes with the TCR/CD3 complex to facilitate the termination of the activation process (31). Thus the spatial and temporal distribution of PKCθ and PKA allow for access to the KCa3.1 channels and as such could provide a regulatory mechanism affecting the channel’s activity. As a result it is quite possible that recruitment of KCa3.1 channels could lead to differential regulation of these channels. Consequently, modulation of KCa3.1 channel activity will determine the magnitude and duration of the Ca2+ response triggered by antigen presentation as it contributes to the driving force for Ca2+ influx.
In view of this we propose that the functional relevance of KCa3.1 channel translocation to the IS could be to facilitate the better regulation of the channel by signaling molecules recruited at this site during T cell activation with the ultimate goal to shape the Ca2+ response which is integral for differential gene expression (7).
Supplementary Material
Legend to movie S1. Time-lapse movie of YFP-KCa3.1 during T cell/APC interaction (same experiment as Fig. 6). This movie can be viewed with QuickTime viewer (http://quicktime.apple.com/qt/sw/sw.html). Pre-activated human T cells transfected with YFP-KCa3.1 were imaged while interacting with SEB-pulsed EBV B cells. The brightfield images are shown in the left panel, the fluorescent images in the right panel and the corresponding pseudocolor images underneath. Real time is shown on the lower left of the movie. The movie shows an APC approaching a transfected T cell from the top of the screen. After the T cell has made contact with the APC, KCa3.1 channels in the T cells move towards the contact area with the APC (the immunological synapse) where they reside for the majority of the time. Around 30:00 min the channels begin to redistribute along the plasma membrane and become evenly distributed as they were before encounter with the APC.
Acknowledgments
We thank Mr. M. K. Ragupathy for technical assistance. This work was supported by NIH grant # CA95286 to LC, AHA-Ohio Valley Affiliate pre-doctoral fellowship #0615213B to SAN and NIH grants # DK54941 and HL083060 to DCD.
References
- 1.Bi K, Tanaka Y, Coudronniere N, Sugie K, Hong S, van Stipdonk MJ, Altman A. Antigen-induced translocation of PKC-theta to membrane rafts is required for T cell activation. Nat Immunol. 2001;2:556–563. doi: 10.1038/88765. [DOI] [PubMed] [Google Scholar]
- 2.Bunnell SC, Kapoor V, Trible RP, Zhang W, Samelson LE. Dynamic actin polymerization drives T cell receptor-induced spreading: a role for the signal transduction adaptor LAT. Immunity. 2001;14:315–329. doi: 10.1016/s1074-7613(01)00112-1. [DOI] [PubMed] [Google Scholar]
- 3.Cannon JL, Burkhardt JK. The regulation of actin remodeling during T-cell-APC conjugate formation. Immunol Rev. 2002;186:90–99. doi: 10.1034/j.1600-065x.2002.18609.x. [DOI] [PubMed] [Google Scholar]
- 4.Conforti L, Bodi I, Nisbet JW, Millhorn DE. O2-sensitive K+ channels: role of the Kv1.2 -subunit in mediating the hypoxic response. J Physiol. 2000;524(Pt 3):783–793. doi: 10.1111/j.1469-7793.2000.00783.x. [DOI] [PMC free article] [PubMed] [Google Scholar]
- 5.Das V, Nal B, Roumier A, Meas-Yedid V, Zimmer C, Olivo-Marin JC, Roux P, Ferrier P, Dautry-Varsat A, Alcover A. Membrane-cytoskeleton interactions during the formation of the immunological synapse and subsequent T-cell activation. Immunol Rev. 2002;189:123–135. doi: 10.1034/j.1600-065x.2002.18911.x. [DOI] [PubMed] [Google Scholar]
- 6.Del Carlo B, Pellegrini M, Pellegrino M. Modulation of Ca2+-activated K+ channels of human erythrocytes by endogenous protein kinase C. Biochim Biophys Acta. 2003;1612:107–116. doi: 10.1016/s0005-2736(03)00111-1. [DOI] [PubMed] [Google Scholar]
- 7.Dolmetsch RE, Xu K, Lewis RS. Calcium oscillations increase the efficiency and specificity of gene expression. Nature. 1998;392:933–936. doi: 10.1038/31960. [DOI] [PubMed] [Google Scholar]
- 8.Ehrlich LI, Ebert PJ, Krummel MF, Weiss A, Davis MM. Dynamics of p56lck translocation to the T cell immunological synapse following agonist and antagonist stimulation. Immunity. 2002;17:809–822. doi: 10.1016/s1074-7613(02)00481-8. [DOI] [PubMed] [Google Scholar]
- 9.Friedl P, den Boer AT, Gunzer M. Tuning immune responses: diversity and adaptation of the immunological synapse. Nat Rev Immunol. 2005;5:532–545. doi: 10.1038/nri1647. [DOI] [PubMed] [Google Scholar]
- 10.Friedl P, Gunzer M. Interaction of T cells with APCs: the serial encounter model. Trends Immunol. 2001;22:187–191. doi: 10.1016/s1471-4906(01)01869-5. [DOI] [PubMed] [Google Scholar]
- 11.George Chandy K, Wulff H, Beeton C, Pennington M, Gutman GA, Cahalan MD. K+ channels as targets for specific immunomodulation. Trends Pharmacol Sci. 2004;25:280–289. doi: 10.1016/j.tips.2004.03.010. [DOI] [PMC free article] [PubMed] [Google Scholar]
- 12.Gerlach AC, Gangopadhyay NN, Devor DC. Kinase-dependent regulation of the intermediate conductance, calcium-dependent potassium channel, hIK1. J Biol Chem. 2000;275:585–598. doi: 10.1074/jbc.275.1.585. [DOI] [PubMed] [Google Scholar]
- 13.Ghanshani S, Wulff H, Miller MJ, Rohm H, Neben A, Gutman GA, Cahalan MD, Chandy KG. Up-regulation of the IKCa1 potassium channel during T-cell activation. Molecular mechanism and functional consequences. J Biol Chem. 2000;275:37137–37149. doi: 10.1074/jbc.M003941200. [DOI] [PubMed] [Google Scholar]
- 14.Grynkiewicz G, Poenie M, Tsien RY. A new generation of Ca2+ indicators with greatly improved fluorescence properties. J Biol Chem. 1985;260:3440–3450. [PubMed] [Google Scholar]
- 15.Hess SD, Oortgiesen M, Cahalan MD. Calcium oscillations in human T and natural killer cells depend upon membrane potential and calcium influx. J Immunol. 1993;150:2620–2633. [PubMed] [Google Scholar]
- 16.Kupfer A, Kupfer H. Imaging immune cell interactions and functions: SMACs and the Immunological Synapse. Semin Immunol. 2003;15:295–300. doi: 10.1016/j.smim.2003.09.001. [DOI] [PubMed] [Google Scholar]
- 17.Kupper J. Functional expression of GFP-tagged Kv1.3 and Kv1.4 channels in HEK 293 cells. Eur J Neurosci. 1998;10:3908–3912. doi: 10.1046/j.1460-9568.1998.00441.x. [DOI] [PubMed] [Google Scholar]
- 18.Negulescu PA, Shastri N, Cahalan MD. Intracellular calcium dependence of gene expression in single T lymphocytes. Proc Natl Acad Sci U S A. 1994;91:2873–2877. doi: 10.1073/pnas.91.7.2873. [DOI] [PMC free article] [PubMed] [Google Scholar]
- 19.Neylon CB, D’Souza T, Reinhart PH. Protein kinase A inhibits intermediate conductance Ca2+-activated K+ channels expressed in Xenopus oocytes. Pflugers Arch. 2004;448:613–620. doi: 10.1007/s00424-004-1302-5. [DOI] [PubMed] [Google Scholar]
- 20.Panyi G, Bagdany M, Bodnar A, Vamosi G, Szentesi G, Jenei A, Matyus L, Varga S, Waldmann TA, Gaspar R, Damjanovich S. Colocalization and nonrandom distribution of Kv1.3 potassium channels and CD3 molecules in the plasma membrane of human T lymphocytes. Proc Natl Acad Sci U S A. 2003;100:2592–2597. doi: 10.1073/pnas.0438057100. [DOI] [PMC free article] [PubMed] [Google Scholar]
- 21.Panyi G, Vamosi G, Bacso Z, Bagdany M, Bodnar A, Varga Z, Gaspar R, Matyus L, Damjanovich S. Kv1.3 potassium channels are localized in the immunological synapse formed between cytotoxic and target cells. Proc Natl Acad Sci U S A. 2004;101:1285–1290. doi: 10.1073/pnas.0307421100. [DOI] [PMC free article] [PubMed] [Google Scholar]
- 22.Panyi G, Varga Z, Gaspar R. Ion channels and lymphocyte activation. Immunol Lett. 2004;92:55–66. doi: 10.1016/j.imlet.2003.11.020. [DOI] [PubMed] [Google Scholar]
- 23.Robbins JR, Lee SM, Filipovich AH, Szigligeti P, Neumeier L, Petrovic M, Conforti L. Hypoxia modulates early events in T cell receptor-mediated activation in human T lymphocytes via Kv1.3 channels. J Physiol. 2005;564:131–143. doi: 10.1113/jphysiol.2004.081893. [DOI] [PMC free article] [PubMed] [Google Scholar]
- 24.Skalhegg BS, Tasken K, Hansson V, Huitfeldt HS, Jahnsen T, Lea T. Location of cAMP-dependent protein kinase type I with the TCR-CD3 complex. Science. 1994;263:84–87. doi: 10.1126/science.8272870. [DOI] [PubMed] [Google Scholar]
- 25.Verheugen JA, Vijverberg HP. sIntracellular Ca2+ oscillations and membrane potential fluctuations in intact human T lymphocytes: role of K+ channels in Ca2+ signaling. Cell Calcium. 1995;17:287–300. doi: 10.1016/0143-4160(95)90075-6. [DOI] [PubMed] [Google Scholar]
- 26.Winslow MM, Crabtree GR. Immunology. Decoding calcium signaling. Science. 2005;307:56–57. doi: 10.1126/science.1108163. [DOI] [PubMed] [Google Scholar]
- 27.Wulff H, Calabresi PA, Allie R, Yun S, Pennington M, Beeton C, Chandy KG. The voltage-gated Kv1.3 K(+) channel in effector memory T cells as new target for MS. J Clin Invest. 2003;111:1703–1713. doi: 10.1172/JCI16921. [DOI] [PMC free article] [PubMed] [Google Scholar]
- 28.Wulff H, Miller MJ, Hansel W, Grissmer S, Cahalan MD, Chandy KG. Design of a potent and selective inhibitor of the intermediate-conductance Ca2+-activated K+ channel, IKCa1: a potential immunosuppressant. Proc Natl Acad Sci U S A. 2000;97:8151–8156. doi: 10.1073/pnas.97.14.8151. [DOI] [PMC free article] [PubMed] [Google Scholar]
- 29.Wulfing C, Sjaastad MD, Davis MM. Visualizing the dynamics of T cell activation: intracellular adhesion molecule 1 migrates rapidly to the T cell/B cell interface and acts to sustain calcium levels. Proc Natl Acad Sci U S A. 1998;95:6302–6307. doi: 10.1073/pnas.95.11.6302. [DOI] [PMC free article] [PubMed] [Google Scholar]
- 30.Xavier R, Rabizadeh S, Ishiguro K, Andre N, Ortiz JB, Wachtel H, Morris DG, Lopez-Ilasaca M, Shaw AC, Swat W, Seed B. Discs large (Dlg1) complexes in lymphocyte activation. J Cell Biol. 2004;166:173–178. doi: 10.1083/jcb.200309044. [DOI] [PMC free article] [PubMed] [Google Scholar]
- 31.Zhou W, Vergara L, Konig R. T cell receptor induced intracellular redistribution of type I protein kinase A. Immunology. 2004;113:453–459. doi: 10.1111/j.1365-2567.2004.01992.x. [DOI] [PMC free article] [PubMed] [Google Scholar]
Associated Data
This section collects any data citations, data availability statements, or supplementary materials included in this article.
Supplementary Materials
Legend to movie S1. Time-lapse movie of YFP-KCa3.1 during T cell/APC interaction (same experiment as Fig. 6). This movie can be viewed with QuickTime viewer (http://quicktime.apple.com/qt/sw/sw.html). Pre-activated human T cells transfected with YFP-KCa3.1 were imaged while interacting with SEB-pulsed EBV B cells. The brightfield images are shown in the left panel, the fluorescent images in the right panel and the corresponding pseudocolor images underneath. Real time is shown on the lower left of the movie. The movie shows an APC approaching a transfected T cell from the top of the screen. After the T cell has made contact with the APC, KCa3.1 channels in the T cells move towards the contact area with the APC (the immunological synapse) where they reside for the majority of the time. Around 30:00 min the channels begin to redistribute along the plasma membrane and become evenly distributed as they were before encounter with the APC.