

Abstract
The objective of this research is to characterize a sodium-dependent multivitamin transporter (SMVT) in MDCK-MDR1 cells (Madin-Darby canine kidney cells transfected with the human MDR1 gene) and to investigate the feasibility of utilizing MDCK-MDR1 cell line as an in vitro model to study the permeability of biotin-conjugated prodrugs of anti-HIV protease inhibitors. Mechanism of [3H] biotin uptake and transport was delineated. Transepithelial permeability of the biotin conjugated prodrug i.e. biotin-saquinavir was also studied. Reverse transcription-polymerase chain reaction (RT-PCR) was carried out to confirm the existence of SMVT in MDCK-MDR1 cells. Biotin uptake was Na+, pH, and temperature dependent, but energyindependent. Transepithelial transport studies of biotin-saquinavir in MDCK-MDR1, wild type MDCK, and Caco-2 cells revealed that permeability of biotin-saquinavir was similar in all three cell lines. A band of SMVT mRNA at 862 bp was identified by RT-PCR. A sodium-dependent multivitamin transporter, SMVT, responsible for biotin uptake and transport, was identified and functionally characterized in MDCK-MDR1 cells. Therefore, MDCK-MDR1 cell line may be utilized as an in vitro model to study the permeability of biotin conjugated prodrugs such as HIV protease inhibitors.
Keywords: sodium-dependent multivitamin transporter (SMVT), MDCK-MDR1, biotin-saquinavir
INTRODUCTION
Biotin is a water soluble vitamin essential for normal cellular growth, function, and development. It functions as a cofactor for the carboxylases that catalyze a variety of metabolic reactions including fatty acid biosynthesis, gluconeogenesis, and catabolism of several branched chain amino acids and odd-chain fatty acids1–3. Severe biotin deficiency leads to a wide range of clinical abnormalities, such as neurologic disorders, growth retardation, and skin abnormalities1–4. Biotin can only be synthesized by bacteria, yeasts, molds, algae, and some plant species. Human and other mammals cannot synthesize it, therefore must obtain from exogenous sources. The major tissues for biotin absorption and metabolism are intestine7–13, 18–20, placenta5, 17–20, and liver8, 11, 18, 20. Kidney6, 9, 10, 18–20 is also involved in biotin reabsorption and elimination. Mechanism of biotin uptake has recently been studied in various mammalian cells from human, rat and rabbits5–20. Grassel etc5 was the first to report the presence of a sodium-dependent multivitamin transporter (SMVT) in human placenta that is responsible for the uptake of biotin, pantothenate and lipoate. Later, a second biotin-specific high affinity system was reported in human keratinocytes and human peripheral blood mononuclear cells (PBMC)14–15. Recently, Said and his group7–13 studied the mechanism of biotin uptake in rat and human intestinal, liver and renal epithelial cells and suggested that SMVT is the primary transport system responsible for biotin uptake. SMVT has been also identified by several other groups as the major carrier for biotin, pantothenate and lipoate in several mammal cells5, 14–20. Cloning and functional expression of a SMVT for biotin, lipoic acid, and pantothenic acid from intestinal and placental tissues have been reported17–20. Structural and functional analyses of SMVT suggest that a single transport system probably mediates uptake of biotin, pantothenate and lipoate in the major absorptive tissues18.
Recently, considerable attention has been paid to target this nutrient transport system (SMVT) for delivering drugs with poor permeability21–24. For example, the biotin modified R.I.-K(biotin)-Tat9 exhibited significantly improved permeability over the parent drug R.I-K-Tat9 probably due to carrier-mediated uptake by SMVT21. A conjugate of camptothecin-poly(ethylene glycol) (CPT-PEG) with biotin enhanced the delivery of parent drug CPT. Similarly, biotin conjugated saquinavir- poly(ethylene glycol) enhanced oral bioavailability of saquinavir21–23.
In this study, we investigated biotin uptake and transport in MDCK-MDR1 cells. This cell line was derived from Madin-Darby canine kidney cells which were transfected with the human MDR1 gene. We selected this cell line because it has been widely employed as an alternative to Caco-2 model for high throughput drug permeability screening26–28. MDCK-MDR1 cells express high level of P-gp and differentiate rapidly and it is a good in vitro model for studying the permeability of P-gp substrates and P-gp mediated drug-drug interactions26–28. Several other transporters such as monocarboxylic acid (MCT) transporter, large neutral amino acid, bile acid and peptide transporters expressed in the MDCK and Caco-2 cells have been preliminarily screened25. However, no previous work about the SMVT transport system in the MDCK-MDR1 cell line has been reported. Hence in this article we report functional and molecular characterizations of SMVT in MDCK-MDR1 cells. The aim of this work is to investigate the feasibility of selecting MDCK-MDR1 cell line as an in vitro model to study the permeability of biotin conjugated anti-HIV protease inhibitors i.e. saquinavir.
MATERIALS and METHODS
Materials
D-[8, 9-3H] biotin (specific activity 50 Ci/mmol, radiochemical purity 97%) was purchased from Perkin-Elmer Life Science, Inc. (Boston, MA). D-Biotin was obtained from Fisher Scientific Co. (Fair Lawn, NJ). Pantothenic acid, lipoic acid, dethiolbiotin, biotin methyl ester, biocytin, acetic acid, benzoic acid, and valeric acid were procured from Sigma Chemical Company (St. Louis, MO). Saquinavir as its mesylate salt was kindly donated by Hoffmann-La Roche.
MDCK-MDR1 cells were donated by P. Borst (Netherlands Cancer Institute, Amsterdam, The Netherlands). Dulbecco modified Eagle medium (DMEM), nonessential amino acids, calf serum (CS), and trypsin/EDTA were obtained from Gibco (Invitrogen, Grand Island, NY). Penicillin, streptomycin, sodium bicarbonate, and HEPES were purchased from Sigma Chemical Company (St. Louis, MO).
Dulbecco modified phosphate buffer saline (DPBS) was prepared with 129 mM NaCl, 2.5 mM KCl, 7.4 mM Na2HPO4, 1.3 mM KH2PO4, 1 mM CaCl2, 0.7 mM MgSO4, 5.3 mM glucose at pH 7.4. DPBS also contained 20mM Hepes. These chemicals were of analytical grade and obtained from Sigma. Culture flasks (75-cm2 growth area), polyester Transwells® (pore size of 0.4 μm and 12 mm diameter), and 12-well tissue culture-treated plastic plates were purchased from Costar (Cambridge, MA). Buffer components and other solvents were obtained from Fisher Scientific Co. (Fair Lawn, NJ).
Methods
Synthesis of biotin conjugated saquinavir (biotin-saquinavir)
Biotin (0.13 g, 0.52 mmol), saquinavir (0.2 g, 0.26 mmol), dicyclohexylcarbodiimide (DCC, 0.11 g, 0.52 mmol), and 4-(N, N – dimethylamino) pyridine (DMAP, 0.064 g, 0.52 mmol) were dissolved in dry DMF (15 mL) under nitrogen atmosphere. The mixture was stirred continuously for 1 hr at 0 °C and then allowed to warm up to room temperature. After 24 h, the reaction was checked by TLC (1:8 methanol/dichloromethane) and LC-MS analysis, was found to be complete. The urea derivative was removed by filtration and the filtrate was washed with ethyl acetate. Solvents from combined filtrate and washing were totally removed under reduced pressure. The oily crude was washed with ether and solvent was evaporated, and purified by silica gel chromatography (1:8 methanol/dichloromethane). Biotin-saquinavir is a white amorphous solid. It was kept under vacuum overnight to yield a dry product. The yield was 82%. The structure and purity were confirmed by TLC, LC/MS, LC/MS/MS and NMR. The structure of biotin-saquinavir is shown in Scheme 1. MS spectrum along with the assignment of its ion fragments are shown in Scheme 2.
Scheme 1.
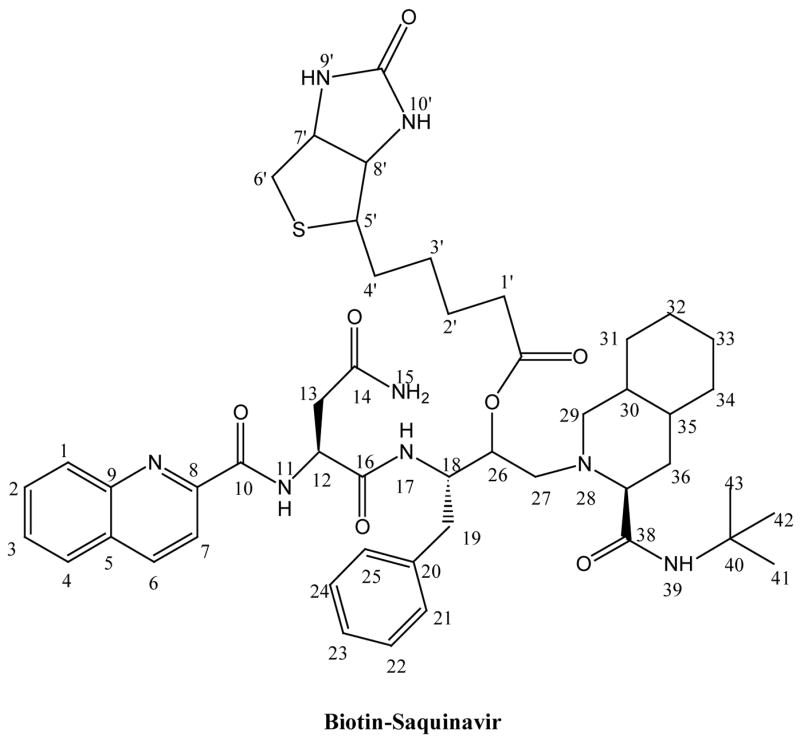
Structure of Biotin-Saquinavir.
Scheme 2.
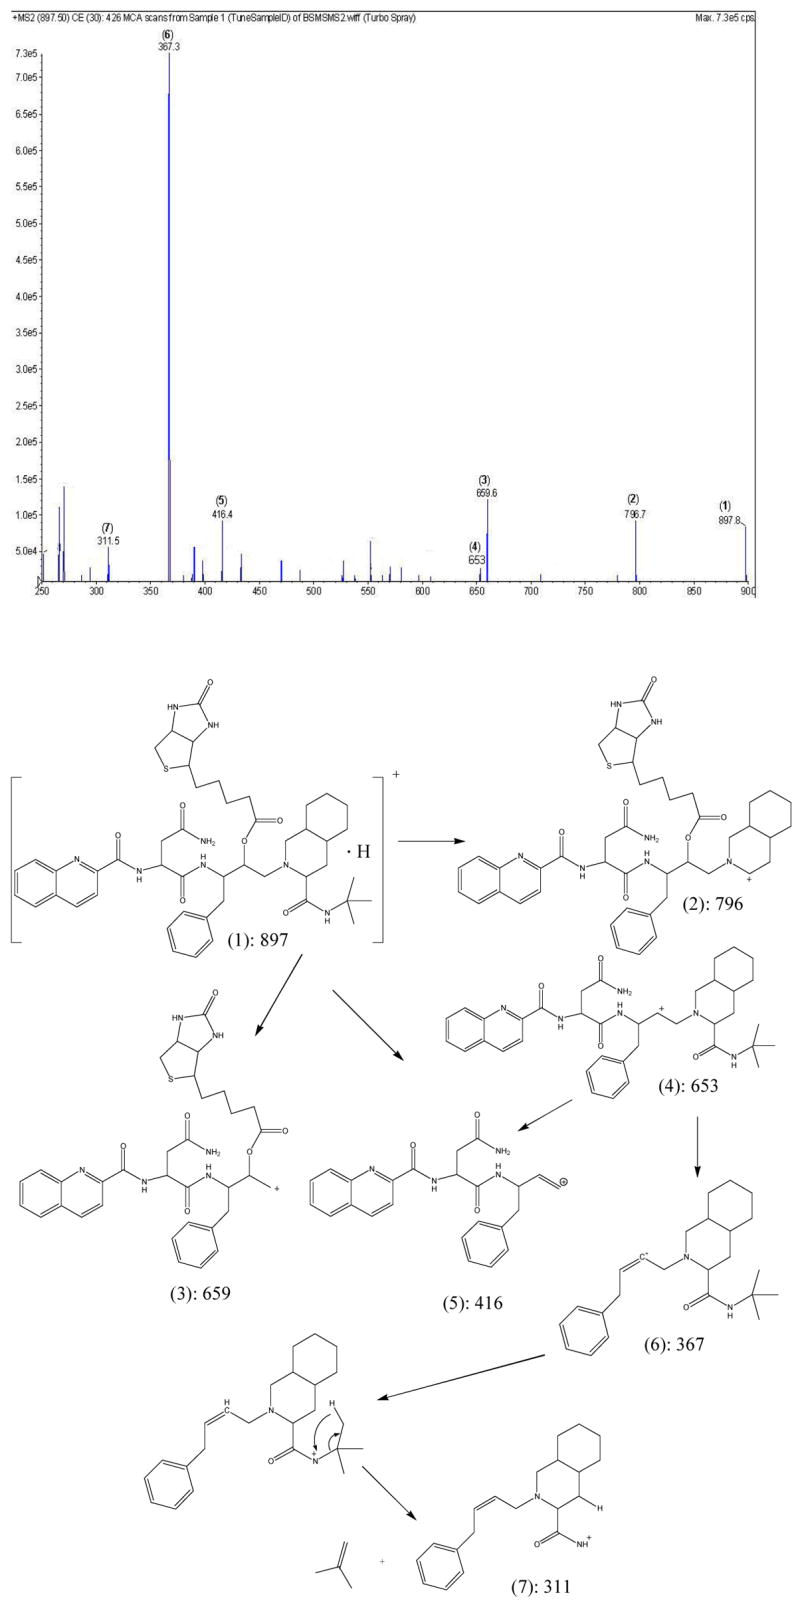
MS spectrum and assignment of ion fragments of Biotin-Saquinavir
ESI-MS (MH+): 897.5; calculated (C48H46N8O7S): 896.5.
1H NMR (DMSO-d6): δ 8.84 (1H, d, H11), 8.60 (1H, d, H7), 8.23 (1H, bd, H39), 8.18 (2H, d, H1,6), 8.12 (1H, m, H4), 7.89 (1H, m, H2), 7.75 (1H, m, H3), 7.48 (2H, bd, H15,17), 6,98–7.17 (5H, m, H21–25), 5.31 (1H, m, H26), 4.76 (1H, m, H12), 4.36 (1H, m, H18), 3.29 (1H, m, H29), 2.29–2.89 ((7H, m, H13, 19, 27, 37), 1.32 (9H, s, H41–43), 1.34–1.93 (13H, m, H30–36), 6.43 (1H, s, H9′), 6.38 (1H, s, H10′), 4.30 (1H, m, H7′), 4.13 38 (1H, m, H8′), 3.09 (1H, m, H5′), 2.80 (2H, s, H6′), 2.56 (2H, m, H1′), 2.29(2H, m, H2′), 1.34–1.93 (4H, m, H3′–4′).
Cell culture
MDCK-MDR1 cells (passages 5–15) were cultured in DMEM supplemented with 10% FBS (heat inactivated), 1% nonessential amino acids, 100 U/mL penicillin, 100 g/mL streptomycin, 20 mM Hepes, and 29 mM sodium bicarbonate at pH 7.4. Cells were allowed to grow at 37 ° in a tissue culture incubator with 5% CO2 and 95% air for 3 to 4 days to reach 80% confluence, and then were plated at a density of 100,000/cm2 in 12-well tissue culture-treated plastic plates. Cells were then incubated at 37 ° in humidified atmosphere of 5% CO2 and 95% air and grown for 6–7 days to reach confluence. The medium was changed every other day.
Uptake experiments
Cell monolayers were rinsed 3 times, 10min each with 2 mL DPBS buffer at 37 °C, unless otherwise stated. Then, 1 mL of biotin solution ([3H] biotin, 0.5μCi/mL) in DPBS buffer was added to each well and incubated at 37 °C for 5 minutes, unless otherwise mentioned (see Results). 0.5 mL or 1.5 mL of [3H] biotin solution was added to the apical and basal chambers of 12-well Transwell® plate for apical and basal uptake, respectively. After the incubation period, the cell monolayers were rinsed three times with ice-cold stop solution (200 mM KCl and 2 mM HEPES) to terminate drug uptake. Cells were lysed overnight (using 1 mL 0.1% (v/v) Triton X-100 in 0.3 N sodium hydroxide) at room temperature. Aliquots (500 μL) from each well were then transferred to scintillation vials containing 5 mL scintillation cocktail (Fisher Scientific, Fairlawn, NJ). Samples were then analyzed by liquid scintillation counter (Model LS-6500, Beckman Instruments, Inc., Fullerton, CA). Amount of protein in the cell lysate was measured by the BioRad protein estimation kit (BioRad, Hercules, CA) and the rate of uptake was normalized to the protein content of each well.
Na+ dependence
To study Na+ dependence, sodium chloride and sodium phosphate in the incubation media were replaced by equimolar choline chloride and potassium phosphate, to generate sodium free medium. Cells were washed with either regular DPBS or sodium free medium. Solutions ([3H] biotin, 0.5μCi/mL) were prepared in either regular DPBS or sodium free media.
pH dependence
DPBS incubation media were adjusted at different pHs (5.5, 6.0, 6.5, 7.0, 7.4, 8.0) by adding hydrochloride acid or sodium hydroxide. Cells were washed with different pH of DPBS. Permeant solutions ([3H] biotin, 0.5μCi/mL) were prepared in DPBS having different pH values.
Energy dependence
After washing with DPBS buffer 3 × 10 minutes, cells were preincubated with 1 mM metabolic inhibitors i.e. 2,4-dinitrophenol, ouabain, and sodium azide at 37 °C for 30 minutes. Then uptake study was conducted according to procedure described previously.
Saturation kinetics of biotin uptake (concentration dependence)
Unlabelled biotin was first dissolved in DMSO to make stock solution, and then various concentrations (1 to 100 μM) of solutions were prepared in DPBS containing DMSO (≤ 1%). [3H] biotin was added to each tube containing different concentrations of unlabelled biotin to make donor solutions. Then, concentration-dependence uptake of biotin was carried out. The data was fitted to a modified Michaelis-Menten equation and the apparent affinity constant (Km), maximum uptake velocity (Vmax), and passive diffusion constant (Kd) of Na+ dependent biotin uptake were determined.
Inhibition study (substrate specificity)
To examine the substrate specificity of the SMVT, [3H] biotin (10 nM) uptake was carried out in the presence of 1 mM biotin, its structural analogs i.e. desthiolbiotin, biocytin, and biotin methyl ester, and some other carboxylic acids such as valeric acid, acetic acid, benzoic acid, and related vitamins pantothenic acid and lipoic acid. Biotin-saquinavir (biotin conjugated saquinavir prodrug) was also applied for competitive inhibition of biotin uptake.
Unlabelled biotin or biotin-saquinavir was dissolved in DMSO to generate 10 mM stock solution. Then 25 μM solutions were made by diluting the stock solution with DPBS and [3H] biotin was added right before an experiment. Inhibition study was conducted according to the procedure described previously.
Transport experiments
Permeability of [3H] biotin (1.0 μCi/mL) across MDCK-MDR1 cells in the absence and presence of 50 μM biotin or biotin-saquinavir was determined with 12-well Transwell® plates. Before each experiment, cells were grown on Transwell® inserts. Cell monolayers were rinsed 3 times with DPBS pH 7.4 at 37 °C. Volumes of apical and basal chambers were 0.5 and 1.5 mL, respectively. Transport experiments were conducted for a period of 3h. Samples (100 μL) were withdrawn from the receiver chamber at predetermined time points i.e. 15, 30, 45, 60, 90, 120, 150, 180 min, and replaced with equal volume of fresh DPBS buffer solution to maintain sink conditions. Dilutions were taken into account for calculations of permeant concentrations. Each sample along with 5 mL of scintillation cocktail was then analyzed by Beckman Scintillation Counter. All experiments were performed at 37 °C.
Transepithelial permeability of biotin-saquinavir in MDCK-MDR1, MDCK-wild type (MDCK-WT), and Caco-2 cells was also determined. Samples (200 μL) in DPBS were withdrawn from the receiver chamber at predetermined time points i.e. 30, 60, 90, 120, 150, 180 min. Samples were stored at − 80 °C until further analysis. Samples were then extracted with tert-butyl methyl ether. Ether layer was separated and then evaporated under vacuum. Then the dried samples were re-dissolved in water and analyzed by LC/MS/MS (Applied Biosystem/MDS SCIEX QTRAP).
Data Analysis
The kinetic parameters of biotin uptake were calculated by a modified Michaelis-Menten equation (Eq. 1), which takes into account the carrier mediated process (as described by the classical Michaelis-Menten equation) and the non-saturable passive diffusion process.
| Eq. 1 |
V is the total rate of uptake, Vmax is the maximum uptake for the carrier-mediated process, Km is the Michaelis-Menten constant and Kd is the rate for non-saturable diffusion component. Data was fitted to Eq. 1 using the non-linear least square regression analysis program (KaleidaGraph 3.5).
The cumulative amount transported (TRcum) is calculated by Eq. 2
| Eq. 2 |
An is the amount of drug measured in sample n, VSn is the volume of sample n, Vr is the volume of the receiver chamber, and Ai is the amount of drug at each predetermined time point.
Transepithelial permeability of [3H] biotin or biotin-saquinavir was calculated by Eq. 3, respectively:
| Eq. 3 |
TRcum/dt is transport rate of [3H] biotin or biotin-saquinavir, which is obtained from the slope of the transport profile. A is the surface area of the plate, and C0 is the substrate concentration.
Statistical analysis
All experiments were conducted at least in triplicate and results were expressed as mean ± SD. The student’s t-test is used to detect statistical significance, and P < 0.05 is considered to be significant. Statistical comparisons were performed using the analysis of variance (GraphPad INSTAT, version 3.1).
RT-PCR Analysis
Total RNA was extracted from MDCK-MDR1 cells with Trizol® reagent (Invitrogen) following manufacturer’s instructions. Reverse transcription (RT) was performed according to standard protocol with 1 μg total RNA to obtain first strand cDNA. One microliter of cDNA was then introduced into PCR and the product was subjected to gel electrophoresis with 3% agarose gel. The primers used for the amplification of SMVT were: forward 5′-CGATTCAATAAAACTGTGCGAGT-3′ and reverse 5′-GGACAGCCACAGATCAAAGC-3′. The primers used were adopted from a published human SMVT cDNA sequence. (1) PCR conditions were as follows: denaturation (94°C, 45 s), annealing (58°C, 1 min), and extension (72°C, 45 s) for 35 amplification cycles, followed by a final extension of 72°C for 10 min. The resultant product was sequenced from both directions by SeqWright with an automated Perkin- Elmer Applied Biosystems 3730×1 Prism TM DNA sequencer to establish its molecular identity.
Computer Analysis
Nucleotide sequence homology matching was performed by applying Basic Local Alignment Search Tool (BLAST) via on-line connection to the National Center of Biotechnology Information (NCBI) database. Multiple nucleotide sequence comparisons were made utilizing CLUSTAL W (1.81) multiple sequence alignment tool from Swiss-Prot.
RESULTS
Time course
Time dependent uptake of [3H] biotin by MDCK-MDR1 cells was first determined. Figure 1 depicts the time course of intracellular biotin accumulation in MDCK-MDR1 cells at 37 °C. [3H] biotin (10 nM) uptake was linear for up to 30 min of incubation time (r2 = 0.999) and occurred at a rate of 20.0 fmol/min/mg protein. An incubation period of 5 min was selected for subsequent biotin uptake experiments unless otherwise mentioned.
Figure 1. Time course of [3H] biotin uptake in MDCK-MDR1 cells.
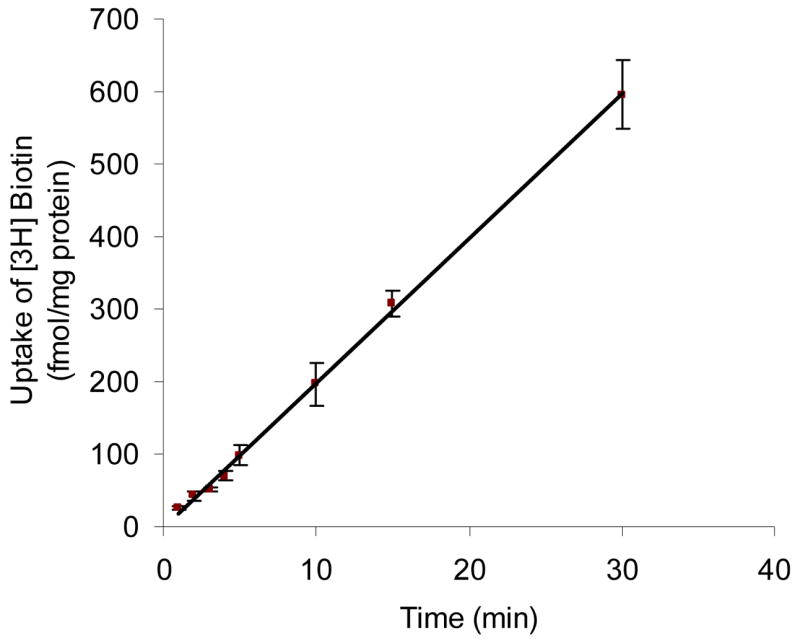
Uptake of [3H] biotin (10 nM) was measured in DPBS buffer (pH 7.4) at 37 °C. Data are shown as mean ± SD, n = 3–6. The linear equation is represented as: y = 20.0 × − 1.57 (r2 = 0.999).
Sodium dependence
Na+ dependence of biotin uptake was examined by replacing Na+ in the incubation medium with an equimolar concentration of choline and K+. Biotin uptake rates were 15.9 and 2.30 fmol/min/mg protein in the presence and absence of sodium, respectively (Figure 2). Replacing Na+ in the incubation medium caused a 7 fold decrease in biotin uptake. It appears that the process of biotin uptake by MDCK-MDR1 cells is highly sodium-dependent.
Figure 2. Effect of Na+ on [3H] biotin uptake in MDCK-MDR1 cells.
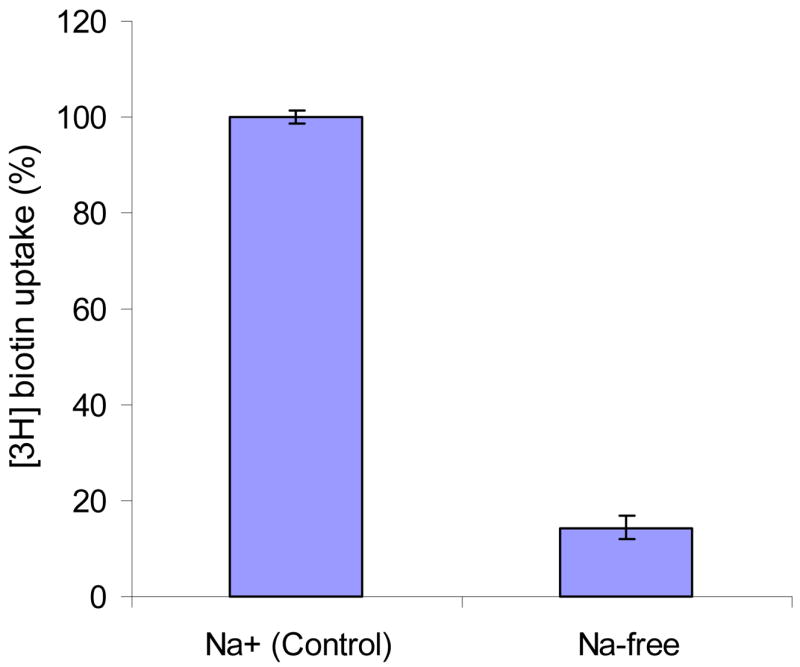
Uptake of [3H] biotin (10 nM) was measured in DPBS buffer (pH 7.4) with or without sodium for 5 min. Results are shown as mean ± SD, n = 4–8.
Temperature dependence
Effect of temperature on the uptake of biotin by MDCK-MDR1 cells was studied. Initial uptake rates of biotin were 20.0 ± 1.53, 12.8 ± 0.49, and 7.29 ± 0.48 fmol/min/mg protein at 37 °C, 25 °C, and 4 °C, respectively. Uptake significantly diminished as incubation temperature was lowered, suggesting that the process is very sensitive to temperature. Uptake rate (Ln (v)) vs 1/T was plotted (Figure 3) and activation energy (Ea) was obtained as 5.10 kcal/mol.
Figure 3. Arrhenius plot of the effect of temperature on [3H] biotin uptake by MDCK-MDR1 cells.
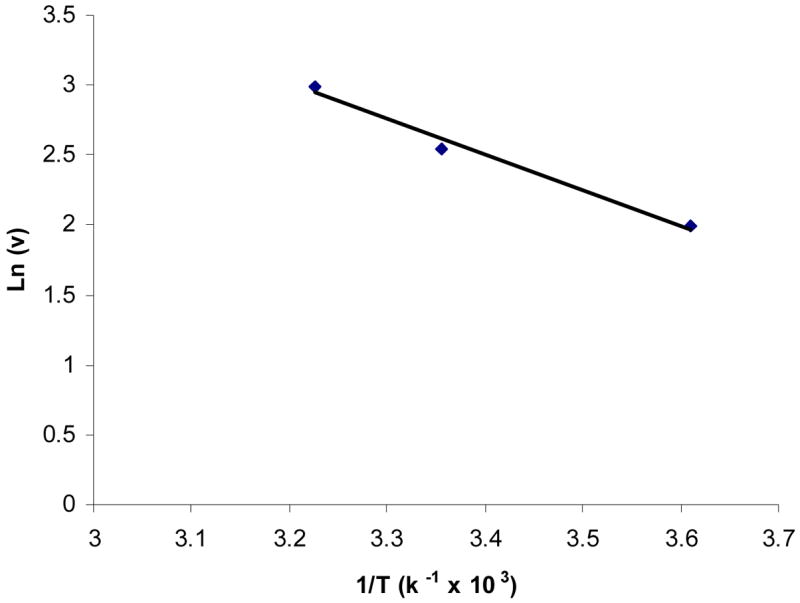
Uptake of [3H] biotin (10 nM) was measured in DPBS buffer (pH 7.4) at 37 °C. Data are shown as mean ± SD, n = 3–6.
Effect of buffer pH and metabolic inhibitors
Figure 4 clearly indicates that the uptake of biotin was highest at pH 5.5 and decreased as the buffer pH was raised from 5.5 to 7.4. Then the rate was maintained same as the buffer pH changed from 7.4 to 8.0.
Figure 4. Effect of pH on [3H] biotin uptake in MDCK-MDR1 cells.

Uptake of [3H] biotin (10 nM) was measured in DPBS buffer at different pHs (pH 5.5, 6.0, 6.5, 7.0, 7.4, 8.0) at 37 °C for 5 min. Results are expressed as mean ± SD, n = 4–8.
To determine whether biotin uptake is energy dependent, effect of metabolic inhibitors on the uptake process was examined by pre-incubating cells for 30 min with the metabolic inhibitors i.e. 2,4-dinitrophenol (DNP), sodium azide, and ouabain (all at 1mM). All three inhibitors did not show any significant inhibition to biotin uptake in MDCK-MDR1 cells, which suggests the uptake of biotin is energy-independent (data not shown).
Saturation kinetics of carrier-mediated mechanism for biotin uptake
[3H] biotin uptake in MDCK-MDR1 cells was determined as a function of substrate concentration in the range of 1 to 100 μM. The experiment was performed in the presence of Na+ at 37 °C for 5 min. Uptake of biotin consisted of a major (saturable) carrier mediated process and a minor non-saturable component evident at higher concentrations (Figure 5). Uptake data was fitted to Eq. 1 and kinetic parameters Km and Vmax were determined to be 13.0 μM and 21.5 pmol/min/mg protein. Kd had a value of 0.12 μl/min/mg protein. Lineweaver-Burk transformation of the data pointed to the involvement of a single carrier in the uptake process. (Inset, Figure 5).
Figure 5. Saturation kinetics of [3H] biotin uptake by MDCK-MDR1 cells.
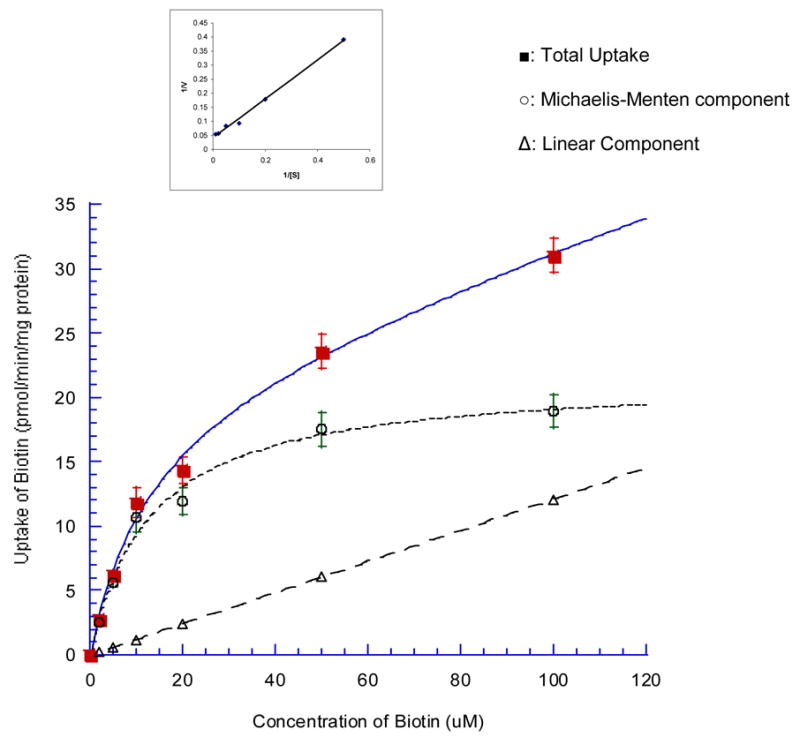
Cells were incubated at 37 °C in DPBS buffer (pH 7.4) for 5 min in the presence of different concentrations of biotin (1–100 μM). Results are expressed as mean ± SD, n = 4–8. ■-Total uptake, ○– Michaelis-Menten component, △– linear, non-saturable component. Inset shows Lineweaver-Burk transformation of the data.
Polarized distribution of SMVT in MDCK-MDR1 cells
To investigate the polarized distribution of SMVT, uptake of [3H] biotin on both apical and basal membrane in the absence and presence unlabelled biotin was determined (Figure 6). Transepithelial transport of [3H] biotin (both A-B and B-A) in the absence and presence unlabelled biotin was also examined (Figure 7). Amount of biotin uptake from basal membrane is half of that from apical side. One hundred μM of unlabelled biotin produced more inhibition on the apical uptake than that on the basal uptake. A-B permeability ((5.44 ± 0.55) × 10 −6 cm/sec) of [3H] biotin was higher than B-A permeability ((3.07 ± 0.34) × 10 −6 cm/sec). In the presence of 50 μM biotin, A-B permeability diminished to a larger extent than B-A permeability, ((5.92 ± 0.027) × 10 −7) versus (( 2.27 ± 0.092) × 10 −6 cm/sec) (Figure 7).
Figure 6. Apical and basal uptake of [3H] biotin by MDCK-MDR1 cells.

Uptake of [3H] biotin (10 nM) was measured in DPBS buffer (pH 7.4) at 37 °C. 0.5 and 1.5 mL of [3H] biotin solution was added to the apical and basal chambers of 12-well Transwell® plate for apical and basal uptake, respectively. The unfilled bars show the apical and basal uptake of [3H] biotin in the absence of unlabelled biotin. The filled bars describe the apical and basal uptake of [3H] biotin in the presence of 100 μM biotin. Data are shown as mean ± SD, n = 3–6.
Figure 7. Transepithelial transport of [3H] biotin in MDCK-MDR1 cells.
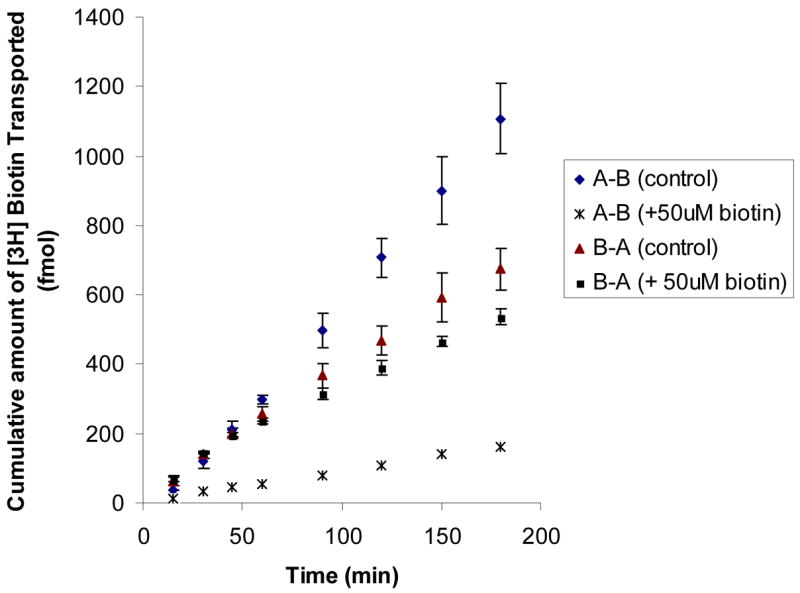
Cumulative amount of transported [3H] biotin (20 nM) was measured in DPBS buffer (pH 7.4) at 37 °C for 180 min in the absence and presence of 50 μM unlabelled biotin. Data are expressed as mean ± SD, n = 3–6. When error bar is smaller than the symbol, it is not shown.
Substrate specificity
To confirm the involvement of SMVT, we examined the substrate specificity of the transporter by inhibiting the uptake of [3H] biotin (10nM) with 1 mM biotin, its structural analogs, and related vitamins (Table 1). Uptake was significantly inhibited by unlabeled biotin, pantothenic acid, lipoic acid, desthiolbiotin, and valeric acid, but unaltered by other compounds i.e. biocytin, biotin methyl ester, acetic acid, and benzoic acid. Lipoic acid caused maximum inhibition (93%) of biotin uptake.
Table 1.
Uptake of [3H] biotin in MDCK-MDR1 cells in the presence of various inhibitors (1mM)
| Inhibitors (1 mM) | Uptake as of control | P |
|---|---|---|
| Control | 100 ± 2.56 | |
| Biotin | 9.03 ± 1.51 | < 0.01 |
| Pantothenic acid | 9.12 ± 1.39 | < 0.01 |
| Lipoic acid | 6.97 ± 0.82 | < 0.01 |
| Dethiolbiotin | 15.61 ± 2.41 | < 0.01 |
| Valeric acid | 60.39 ± 4.02 | < 0.01 |
| Biocytin | 113.22 ± 3.43 | NS |
| Biotin methyl ester | 102.25 ± 4.82 | NS |
| Acetic acid | 96.18 ± 6.76 | NS |
| Benzoic acid | 112.65 ± 0.45 | NS |
Uptake of [3H] biotin (10 nM) was measured in DPBS buffer (pH 7.4) at 37 °C for 5 min in the presence of its structural analogs (1 mM). Data are shown as means ± SD, n = 4–8. P values were calculated with Student’s t-test and compared to the controls. NS indicates not statistically significant at P < 0.05.
We also examined the inhibition of different concentrations of biotin, pantothenic acid, and desthiolbiotin to the uptake of biotin (Table 2). It shows that the percentage of inhibition increased at higher incubator concentrations.
Table 2.
Concentration dependent inhibition of [3H] biotin uptake in MDCK-MDR1 cells by unlabelled biotin, pantothenic acid and desthiolbiotin
| Inhibitors | Concentration (μM) | Uptake as of control | P |
|---|---|---|---|
| Biotin | 0 | 100 ± 4.85 | |
| 10 | 51.50 ± 7.46 | < 0.01 | |
| 100 | 16.27 ± 0.47 | < 0.01 | |
| pantothenic acid | 0 | 100 ± 5.02 | |
| 10 | 27.22 ± 1.06 | < 0.01 | |
| 100 | 25.62 ± 2.06 | < 0.01 | |
| desthiolbiotin | 0 | 100 ± 3.27 | |
| 10 | 40.97 ± 4.29 | < 0.01 | |
| 100 | 16.67 ± 1.69 | < 0.01 |
Uptake of [3H] biotin (10 nM) was measured in DPBS buffer (pH 7.4) at 37 °C for 5 min in the presence of various concentrations of unlabelled biotin, pantothenic acid and desthiolbiotin. Data are shown as mean ± SD, n = 4–6.
Inhibitory effect of biotin-saquinavir
In the presence of 25 μM of biotin and biotin-saquinavir, uptake of [3H] biotin reduced to 36% and 72% of control, respectively (Figure 8). We also examined the effects of unlabeled biotin and biotin-saquinavir to the transport of [3H] biotin across the MDCK-MDR1 cells. Both biotin and biotin-saquinavir (50 μM) exhibited significant inhibition to the transport of [3H] biotin from apical to basal side (A-B) (Figure 9). Apparent permeability (PA-B) values were (5.44 ± 0.55) × 10−6, (5.92 ± 0.027) × 10−7, and (2.42 ± 0.13) × 10−6 cm/s for control and in presence of biotin and biotin-saquinavir, respectively. PA-B descended by 7 and 2 fold in the presence of biotin and biotinsaquinavir respectively, confirming the presence of biotin carrier in MDCK-MDR1 cells.
Figure 8. Inhibition of [3H] biotin uptake in MDCK-MDR1 cells by unlabelled biotin or biotin-saquinavir.
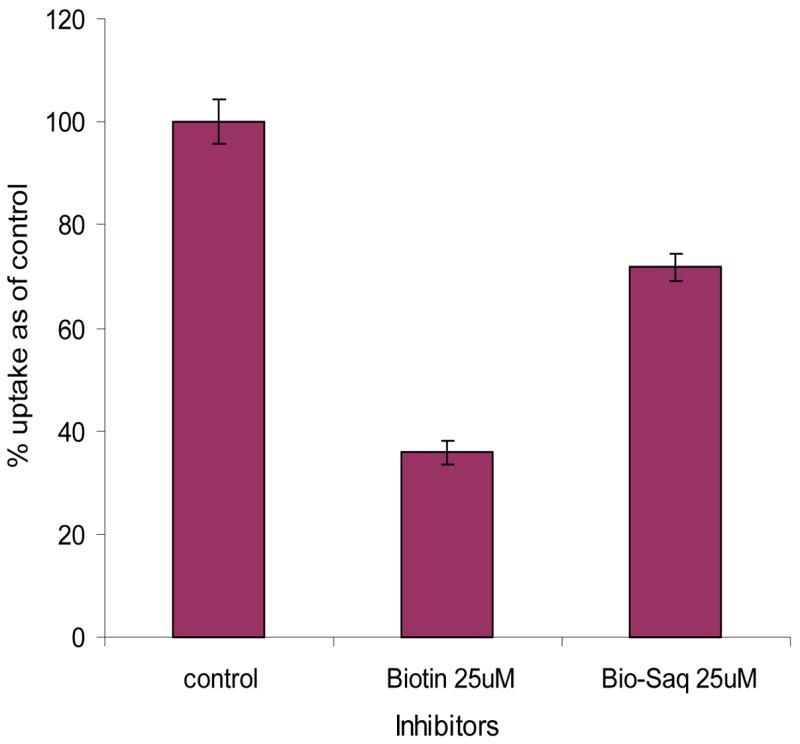
Cells were incubated at 37 °C in DPBS buffer (pH 7.4) for 5 min in the presence of 25 μM of unlabelled biotin or biotin-saquinavir. Data are expressed as mean ± SD, n = 4–8.
Figure 9. Inhibition of [3H] biotin transport by unlabelled biotin or biotinsaquinavir across MDCK-MDR1 cells.

Cumulative amount of transported [3H] biotin (20 nM) was measured in DPBS buffer (pH 7.4) at 37 °C for 180 min in the presence of 50 μM unlabelled biotin and its prodrug biotin-saquinavir. Data are expressed as mean ± SD, n = 3–6. When error bar is smaller than the symbol, it is not shown.
Transepithelial permeability of biotin-saquinavir
Transepithelial permeability of biotin-saquinavir in MDCK-MDR1, MDCK–WT, and Caco-2 were determined (Table 3). A-B permeability values of biotin-saquinavir are very similar, ((4.61 ± 0.50) × 10−7) cm/sec in MDCK-MDR1, ((5.23 ± 0.61) × 10−7) cm/sec in MDCK –WT, and ((3.90 ± 0.36) × 10−7) cm/sec in Caco-2. A-B permeability of biotin-saquinavir in MDCK-WT is slightly higher than in MDCK-MDR1, which in turn is slightly higher than in Caco-2. However, B-A permeability of biotin-saquinavir in MDCK-MDR1 ((8.38 ± 0.31) × 10−7 cm/s) is slightly lower than that in Caco-2 ((10.68 ± 0.59) × 10−7 cm/s). The efflux ratio of biotin-saquinavir in Caco-2 is slightly higher than that in MDCK-MDR1. A-B permeability of biotin-saquinavir in both MDCK-MDR1 and Caco-2 cells is comparable to that of saquinavir ((4.63 ± 0.235) × 10−7 cm/s) in MDCK-MDR1 cells29. However, the efflux ratios of biotin-saquinavir in both Caco-2 and MDCK-MDR1 are much lower than saquinavir29.
Table 3.
Transepithelial permeability of biotin-saquinavir in different cell lines
| P appA-B (cm/sec, ×10−7) | P appB-A (cm/sec, ×10−7) | Efflux Index | |
|---|---|---|---|
| MDCK-MDR1 | 4.61 (± 0.50) | 8.38 (± 0.31) | 1.82 |
| MDCK-WT | 5.23 (± 0.61) | N/D | |
| Caco-2 | 3.90 (± 0.36) | 10.68 (± 0.59) | 2.74 |
Existence of the second biotin-specific high affinity transporter
To examine the existence of a second biotin-specific high affinity transporter, we studied uptake at very low concentrations (0.1–10 nM) of biotin. Figure 10 clearly shows that biotin uptake is linear with concentration in the range of nM-order. We also examined inhibition of 50 nM unlabeled biotin, pantothenic acid, lipoic acid, and desthiolbiotin on the uptake of [3H] biotin (2 nM). All four compounds in the concentration of nanomolar range did not show any significant inhibition (Figure 11).
Figure 10. Uptake of [3H] biotin in nanomolar range by MDCK-MDR1 cells.
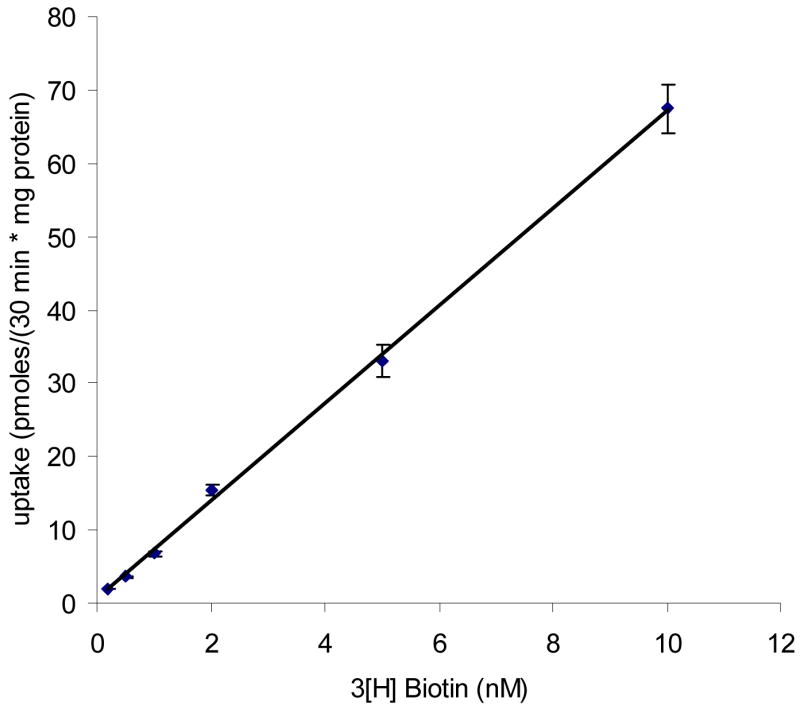
Uptake of [3H] biotin (0.2–10 nM) was measured in DPBS buffer (pH 7.4) at 37 °C for 30 min. No saturation was observed up to 10 nM concentration. Data are expressed as mean ± SD, n = 4–6.
Figure 11. Inhibition of [3H] biotin (2 nM) uptake in MDCK-MDR1 cells in the presence of 50 nM unlabelled biotin and its structural analogs.

Results are expressed as mean ± SD, n = 4–6.
RT-PCR
The PCR product was analyzed by gel electrophoresis with 3% agarose gel. cDNA generated from total RNA isolated from MDCK-MDR1 cells was PCR amplified with the human SMVT primers. A product at 862 bp was obtained (Figure 12). The sequence obtained in both directions showed maximum homology with human SMVT sequence at 862 bp (6001 to 6863) according to BLAST search (NCBI) database, which confirmed the presence of SMVT in MDCK-MDR1 cells. Thus a sodium-dependent multivitamin transporter (SMVT) is expressed in MDCK-MDR1 cells.
Figure 12. RT-PCR showing the expression of SMVT in MDCK-MDR1 cells.
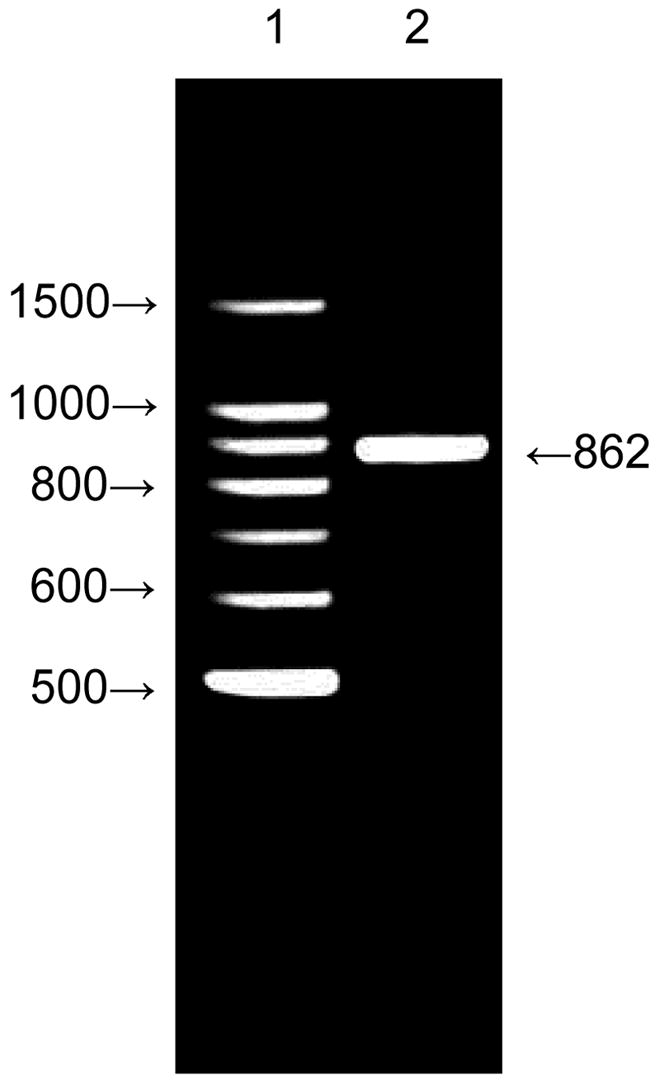
1: Standards; 2: PCR product obtained from total RNA isolated from MDCK-MDR1 cells with hSMVT-specific primers. Samples were analyzed on a 3% agarose gel. An 862 base pair band is very prominent.
DISSCUSION
The primary objective of this study was to investigate the functional and molecular expression of the sodium dependent multivitamin transporter (SMVT) in the MDCK-MDR1 cells. This cell line has been selected because it can provide an alternative to Caco-2 model for high throughput screening in drug discovery26–28. This vitamin carrier system may be targeted to enhance active drug uptake and transport21–24. To establish the suitability of MDCK-MDR1 cell line as an in vitro model for permeability studies of biotin-conjugated prodrugs, transepithelial transport of biotin-saquinavir in MDCK-MDR1 and related cell lines i.e. MDCK-WT and Caco-2 were carried out and permeability values were compared.
The functional mechanism involved in the uptake and transport of biotin in the MDCK-MDR1 cells was first delineated. The uptake process was strongly Na+ dependent (Figure 2). Variations in uptake rates at different temperatures suggest that the process is highly temperature dependent (Figure 3). However, no significant inhibition of biotin uptake by MDCK-MDR1 cells was observed in the presence of metabolic inhibitors i.e. sodium azide, ouabain, and dinitrophenol, indicating energy independence. Our result was different from the findings of Malamurugan etc12 on human proximal tubular epithelial cells (HK-2 cells), which showed the biotin uptake was energy dependent. A difference in energy-dependence parameter may suggest a rather different energetics in this cell line. Biotin uptake was modestly lower when pH varied from 5.5 to 7.4, and was almost same within a pH range of 7.4 to 8.0 (Figure 4). Such pH effect may be caused by the ionic mature of biotin not from H+ gradient13. Larger fraction of neutral biotin component at lower pH may cause higher biotin uptake since neutral species usually generate higher permeability across lipid bilayer of cell membrane.
Uptake of biotin by MDCK-MDR1 cells was found to be concentration dependent and saturable at micromolar range with a Km of 13.0 μM (Figure 5), which is almost the same as the value (12.16 μM) reported for the HK-2 cells12, suggesting a carrier-mediated uptake over the micromolar range. The process was strongly inhibited by unlabeled biotin and other two vitamins pantothenic acid and lipoic acid, known SMVT substrates (Table 1). One millimolar biotin, pantothenic acid and lipoic acid produced almost 90% inhibition, suggesting the biotin uptake was mediated by the same carrier, i.e. sodium dependent multivitamin transporter (SMVT). Inhibition of [3H] biotin transport across apical to basal side in the presence of excess unlabeled biotin further proves that SMVT transporter facilitates biotin transport across the cell membrane (Figure 7). Same concentration of biotin analogues i.e. desthiolbiotin produced similar extent of inhibition. However same concentration of valeric acid produced much less inhibition than biotin. Acetic acid and benzoic acid did not produce significant inhibition of biotin uptake (Table 1), which proves that biotin uptake is not mediated by the monocarboxyl acid transporter (MCT). No significant inhibition on biotin uptake was produced by biocytin and biotin methyl ester (Table 1). These results suggest the long side chain with free carboxyl moiety of biotin molecule may be required for recognition and interaction with SMVT. Similar structural requirements have been reported for SMVT13, 19–20.
Apical and basal uptake and bidirectional transepithelial transport of [3H] biotin in MDCK-MDR1 cells suggest that biotin uptake is higher from the apical membrane than from the basal membrane. A-B permeability of biotin is greater than B-A permeability. Same amount of unlabelled biotin produced more inhibition on the apical uptake and A-B transport than basal uptake and B-A transport, respectively. These results confirm polarized distribution of SMVT at the apical side relative to basal membrane.
Our biotin-saquinavir prodrug produced significant inhibition of the uptake and transport of [3H] biotin (Figure 8 and 9), which indicates that this prodrug can be recognized by SMVT transporter. The inhibition of biotin-saquinavir was less than biotin itself since biotin-saquinavir may not have similar affinity for SMVT relative to biotin.
A-B permeability of biotin-saquinavir in MDCK-WT is slightly higher than in MDCK-MDR1 and Caco-2 cells, which in turn is slightly higher than in Caco-2. The efflux ratio of biotin-saquinavir in MDCK-MDR1 is less than in Caco-2. The efflux ratios of biotin-saquinavir in both MDCK-MDR1 and Caco-2 are significantly lower than saquinavir29, which suggests that biotin-saquinavir is a significantly poorer P-gp substrate than saquinavir itself.
A second biotin-specific high affinity transport system active within nanomolar concentration range has been reported in skin and PBMC cells14–15. From uptake results shown in Figures 10 and 11, cumulative amounts of biotin uptake by MDCK-MDR1 cells was linear as a function of biotin concentration over nanomolar range. Fifty nanomolar biotin, lipoic acid, pantothenic acid and desthiolbiotin did not produce significant inhibition of biotin uptake, indicating that the second biotin-specific high affinity system active in the nanomolar range is not functional in the MDCK-MDR1 cells.
Finally, RT-PCR result further confirms the presence of SMVT in the MDCKMDR1 cells. The sequence obtained in both directions at a band of 862 bp exhibited maximum homology with human SMVT sequence at 862 bp (6001 to 6863) and also partially matched with that of canis familiaris (dog) when the BLAST of NCBI database was searched. Balamurugan etc. reported a band of 1636 bp for the HK-2 cells12. Such a difference may be explained by variants in SMVT genes and/or transcript variants of SMVT genes.
CONCLUSION
In conclusion, this study demonstrates functional evidence of a sodium dependent multivitamin carrier system, SMVT, in MDCK-MDR1 cell line. RT-PCR further provides molecular evidence for the presence of SMVT in the MDCK-MDR1 cells. Biotin-saquinavir produced significant inhibition in the uptake and transport of [3H] biotin and the conjugate was recognized by SMVT transporter. Permeability of biotin-saquinavir in MDCK-MDR1, MDCK-wild type, and Caco-2 was very similar. MDCK-MDR1 cell line may thus be employed as a valuable in vitro tool for screening the permeability of biotin conjugated protease inhibitors such as saquinavir. The efflux ratio of biotin-saquinavir was much less than that of saquinavir, which suggest that the prodrug is a much poorer P-gp substrate than saquinavir.
Acknowledgments
This study was supported by NIH grant R01 GM 64320-03. The donation of saquinavir mesylate by Hoffmann-La Roche is highly appreciated. The authors would like to thank Balasubrahmanyam Budda for his help with RT-PCR, Zhiying Wang and Nanda K. Mandava for their help with growing MDCK-MDR1, MDCK-WT, and Caco-2 cells.
References
- 1.Bonjour JP. Biotin. In: Machlin LJ, editor. Handbook of Vitamins; Nutritional Biochemical and Clinical Aspects. New York; Dekker: 1984. pp. 403–435. [Google Scholar]
- 2.Sweetman L, Nyhan WL. Inheritable biotin-treatable disorders and associated phenomena. Annu Rev Nutr. 1986;6:314–343. doi: 10.1146/annurev.nu.06.070186.001533. [DOI] [PubMed] [Google Scholar]
- 3.Dakshinamurti K, Chauhan J. Regulation of biotin enzymes. Annu Rev Nutr. 1988;8:211–233. doi: 10.1146/annurev.nu.08.070188.001235. [DOI] [PubMed] [Google Scholar]
- 4.Zempleni J, Mock DM. Marginal biotin deficiency is teratogenic. Proc Soc Exp Biol Med. 2000;223:14–21. doi: 10.1046/j.1525-1373.2000.22303.x. [DOI] [PubMed] [Google Scholar]
- 5.Grassl SM. Human placental brush-border membrane Na+-biotin cotransport. J Biol Chem. 1992 [PubMed] [Google Scholar]; (a) 267:17760–17765. [Google Scholar]; (b) 267:22902–22906. [Google Scholar]
- 6.Baur B, Baumgartner ER. Na+-dependent biotin transport into brush-border membrane vesicles form human kidney cortex. PfÜgers Arch. 1993;422:499–505. doi: 10.1007/BF00375078. [DOI] [PubMed] [Google Scholar]
- 7.Said HM. Cellular uptake of biotin: mechanisms and regulation. J Nutr. 1999;129:490S–493S. doi: 10.1093/jn/129.2.490S. [DOI] [PubMed] [Google Scholar]
- 8.Chatterjee NS, Rubin SA, Said HM. Molecular characterization of the 5′ regulatory region of rat sodium-dependent multivitamin transporter gene. Am J Physiol Cell Physiol. 2001;280:C548–C555. doi: 10.1152/ajpcell.2001.280.3.C548. [DOI] [PubMed] [Google Scholar]
- 9.Nabokina SM, Subramanian VS, Said HM. Comparative analysis of ontogenic changes in renal and intestinal biotin in the rat. Am J Physiol Renal Physiol. 2003;284:F737–F742. doi: 10.1152/ajprenal.00364.2002. [DOI] [PubMed] [Google Scholar]
- 10.Said HM, Redha R, Nylander W. A carrier-mediated, Na+-gradient-dependent transport for biotin in human intestinal brush-border membrane vesicles. Am J Physiol. 1987;253 doi: 10.1152/ajpgi.1987.253.5.G631. [DOI] [PubMed] [Google Scholar]; Gastrointest Liver Physiol. 16:G631–G636. [Google Scholar]
- 11.Balamurugan K, Ortiz A, Said HM. Biotin uptake by human intestinal and liver epithelial cells: role of the SMVT system. Am J Physiol Gastrointest Liver Physiol. 2003;285:G73–G77. doi: 10.1152/ajpgi.00059.2003. [DOI] [PubMed] [Google Scholar]
- 12.Balamurugan K, Vaziri ND, Said HM. Biotin uptake by human proximal epithelial cells: cellular and molecular aspects. Am J Physiol Renal Physiol. 2005;288:F823–F831. doi: 10.1152/ajprenal.00375.2004. [DOI] [PubMed] [Google Scholar]
- 13.(a) Said HM, Nylander W, Redha R. Uptake of biotin by the human intestine: site of maximum transport and effect of pH. Gastroenterology. 1988;95:1312–1317. doi: 10.1016/0016-5085(88)90366-6. [DOI] [PubMed] [Google Scholar]; (b) Said HM, Ortiz A, McCloud A, Dyer D, Moyer MP, Rubin S. Biotin uptake by human colonic epithelial NCM460 cells: a carrier-mediated process shared with pantothenic acid. Am J Physiol. 1998;275 doi: 10.1152/ajpcell.1998.275.5.C1365. [DOI] [PubMed] [Google Scholar]; Cell Physiol. 44:C1365–C1371. [Google Scholar]
- 14.Grafe F, Wohlrab W, Neubert RH, Brandsch M. Transport of biotin in human keratinocytes. J Invest Dermatol. 2003;120:428–433. doi: 10.1046/j.1523-1747.2003.12058.x. [DOI] [PubMed] [Google Scholar]
- 15.Zempleni J, Mock DM. Uptake and metabolism of biotin by human peripheral blood mononuclear cells. Am J Physiol. 1998;275 doi: 10.1152/ajpcell.1998.275.2.C382. [DOI] [PubMed] [Google Scholar]; Cell Physiol. 44:C382–C388. doi: 10.1152/ajpcell.1996.270.1.C382. [DOI] [PubMed] [Google Scholar]
- 16.Stanley JS, Mock DM, Griffin JB, Zempleni J. Biotin uptake into human peripheral blood mononuclear cells increases early in the cell cycle, increasing carboxylase activities. J Nutr. 2002;132:1854–1859. doi: 10.1093/jn/132.7.1854. [DOI] [PMC free article] [PubMed] [Google Scholar]
- 17.Wang H, Huang W, Fei W, Xia H, Yang-Feng TL, Leibach FH, Devoe LD, Ganapathy V, Prasad PD. Human placental Na+-dependent multivitamin transporter. J Bio Chem. 1999;274:14875–14883. doi: 10.1074/jbc.274.21.14875. [DOI] [PubMed] [Google Scholar]
- 18.Prasad PD, Ganapathy V. Structure and function of mammalian sodium-dependent multivitamin transporter. Current opinion in clinical nutrition and metabolic care. 2000;3:263–266. doi: 10.1097/00075197-200007000-00004. [DOI] [PubMed] [Google Scholar]
- 19.Prasad PD, Wang H, Huang W, Fei W, Leibach FH, Devoe LD, Ganapathy V. Molecular and functional characterization of the intestinal sodium-dependent multivitamin transporter. Arch Biochem Biophys. 1999;366:95–106. doi: 10.1006/abbi.1999.1213. [DOI] [PubMed] [Google Scholar]
- 20.Prasad PD, Wang H, Kekuda R, Fujita T, Fei Y, Devoe LD, Leibach FH, Ganapathy V. Cloning and functional expression of a cDNA encoding a mammalian sodium-dependent vitamin transporter mediating the uptake of pantothenate and biotin and lipoate. J Bio Chem. 1998;273:7501–7506. doi: 10.1074/jbc.273.13.7501. [DOI] [PubMed] [Google Scholar]
- 21.Ramanathan S, Pooyan S, Stein S, Prasad PD, Wang J, Leibowitz M, Ganapathy V, Sinko PJ. Targeting the sodium-dependent multivitamin transporter (SMVT) for improving the oral absorption properties of a retro-inverso Tat nonapeptide. Pharm Res. 2001;18:950–956. doi: 10.1023/a:1010932126662. [DOI] [PubMed] [Google Scholar]
- 22.Minko T, Paranjpe PV, Qiu B, Lalloo A, Won R, Stein S, Sinko PJ. Enhancing the anticancer efficacy of camptothecin using biotinylated poly(ethleneglycol) conjugates in sensitive and multidrug-resistant human ovarian carcinoma cells. Cancer Chemother Pharmacol. 2002;50:143–150. doi: 10.1007/s00280-002-0463-1. [DOI] [PubMed] [Google Scholar]
- 23.Gunaseelan S, Debrah O, Wan L, Leibowitz MJ, Rabson AB, Stein S, Sinko PJ. Synthesis of poly(ethylene glycol)-based saquinavir prodrug conjugates and assessment of release and anti-HIV-1 bioactivity using a novel protease inhibition assay. Bioconjug Chem. 2004;15:1322–1333. doi: 10.1021/bc0498875. [DOI] [PubMed] [Google Scholar]
- 24.Walker JR, Altman E. Biotinylation facilitates the uptake of large peptides by Escherichia coli and other gram-negative bacteria. Appl Environ Microbiol. 2005;71:1850–1855. doi: 10.1128/AEM.71.4.1850-1855.2005. [DOI] [PMC free article] [PubMed] [Google Scholar]
- 25.Putnam WS, Ramanathan S, Pan L, Takahashi LH, Benet LZ. Functional characterization of monocarboxylic acid, large neutral amino acid, bile acid and peptide transporters, and P-glycoprotein in MDCK and Caco-2 cells. J Pharm Sci. 2002;91:2622–2635. doi: 10.1002/jps.10264. [DOI] [PubMed] [Google Scholar]
- 26.Tang F, Horie K, Borchardt RT. Are MDCK cells transfected with the human MDR1 gene a good model of the human intestinal mucosa? Pharm Res. 2002;19:765–772. doi: 10.1023/a:1016140429238. [DOI] [PubMed] [Google Scholar]
- 27.Tang F, Borchardt RT. Characterization of the efflux transporter(s) responsible for restricting intestinal mucosa permeation of the coumarinic acid-based cyclic prodrug of the opioid peptide DADLE. Pharm Res. 2002;19:787–93. doi: 10.1023/a:1016196514217. [DOI] [PubMed] [Google Scholar]
- 28.Tang F, Ouyang H, Yang JZ, Borchardt RT. Bidirectional transport of rhodamine 123 and Hoechst 33342, fluorescence probes of the binding sites on P-glycoprotein, across MDCK-MDR1 cell monolayers. J Pharm Sci. 2004;93:1185–1194. doi: 10.1002/jps.20046. [DOI] [PubMed] [Google Scholar]
- 29.Jain R, Agarwal S, Majumdar S, Zhu X, Pal D, Mitra AK. Evasion of P-gp mediated cellular efflux and permeability enhancement of HIV-protease inhibitor saquinavir by prodrug modification. Int J Pharm. 2005;303:8–19. doi: 10.1016/j.ijpharm.2005.06.017. [DOI] [PubMed] [Google Scholar]