Abstract
Mitochondria, responsible for the energy-generating process essential for the cell metabolism, differ for the number, localization and activity in animal cells and tissues in relation to the energetic needs. Using fluorescent probes specific for mitochondria, Mitotracker Green (MTG) and Orange (MTO), and Confocal Laser-Scanning Microscope (CLSM), we elaborated a method to measure in vivo the mitochondrial mass and activity, in sea urchin Paracentrotus lividus eggs and embryos. The analysis of captured images, revealed a variation of mitochondrial distribution and an increase of activity after fertilization.
Keywords: CLSM, Mitochondrial mass, Mitochondrial activity, MitoTracker Green, MitoTracker Orange, Sea urchin
Introduction
Mitochondria are highly dynamic organelles, frequently dividing and fusing, changing size and shape and travelling long distances throughout the cell life. The number, structure and functions of mitochondria differ in animal cells and tissues in relation to the energetic needs (Yaffe 1999; Nagata 2006). As the energy demands of cells can vary during development and differentiation, and in response to physiological or environmental alterations (Pollak and Sutton 1980; Cuezva et al. 1997; Enriquez et al. 1999), the number of mitochondria can change by complex and finely regulated processes (Goffart and Wiesner 2003; Hood 2001; Klingenspor et al. 1996).
Mitochondrial proliferation and massive amplification of mtDNA take place during oogenesis in sea urchin. The resulting mitochondria are distributed to the embryo cells until very late developmental stages (Matsumoto et al. 1974; Rinaldi et al. 1979a, b).
Classically, mitochondria have been studied by biochemical, genetic and electron microscopic approaches. In order to study mitochondrial activity in the cells, the researchers have adopted two series of approaches essentially based on: in situ probing mitochondria by morphological approaches, or isolating the organelles released from cells. In the latter approach, a tissue is disrupted mechanically and the organelles are purified by gradients or by differential centrifugation. Mitochondria removed from the cellular environment may not behave as they would in normal conditions; in addition tissue disruption may cause the mitochondrial networks damage. Then, these procedures frequently cause the release of cellular associations with the consequence of damage and the reduced recovery of organelles.
The study of complex structure and function of undamaged organelles in vivo became possible with the advent of fluorescent labelling techniques in combination with live cell imaging microscopy. The investigation of the close relationship of mitochondrial dynamics with numerous cellular processes has been possible by the use of fluorescence microscopy (Jakobs 2006).
The Confocal Laser-Scanning Microscope (CLSM) technology allows the observation of the inner site of living or fixed cells and tissues, the capture of serial optical sections with a good contrast, creating three-dimensional models. In addition in comparison to conventional microscopy it offers advantages as a much better control of depth of field and reduction or removal of background noise away from the focal plane.
MitoTracker™ Green FM and MitoTracker™ Orange CM-H2TMRos are very useful tools for in vivo determining respectively the mass and the oxidative activity of mitochondria. MitoTracker™ Green FM, non-fluorescent in aqueous solutions, becomes fluorescent only when it accumulates in the mitochondrial lipid environment, regardless of membrane potential. MitoTracker™ Orange CM-H2TMRos, non-fluorescent reduced form of tetramethylrosamine, is oxidized by the molecular oxygen in actively respiring cells; therefore it allows measuring the oxidative activity. The use of both probes avoids isolation and purification of organelles, preserving cell structures.
In the present paper, we describe a method, based on CLSM and fluorescence technologies, to study and simultaneously measure the distribution, the content and the oxidative activity of mitochondria in unfertilized and just fertilized sea urchin eggs, in vivo incubating with cell-permeant MitoTracker probes.
Materials and methods
Embryos were cultured and treated as previously described (Morici et al. 2007).
Microscopic observations
Of the several thousands of eggs and embryos observed, we choose 50 samples per each, and analyzed under CLSM (Olympus FV-300) equipped with Argon (488 nm) and Helium/Neon (543 nm) lasers. Each sample was scanned in 30 layers 3 μm thick, with a PlanApo 60×/1, 40 oil-immersion lenses at 1024 × 1024 pixel resolution. Specimens pre-incubated with MitoTracker Green (MTG) absorb laser light at 490 nm wavelength, emitting green fluorescent light at 516 nm, those pre-incubated with MitoTracker Orange (MTO) absorb laser light at 551 nm emitting red fluorescent light at 576 nm wavelength.
Image acquisition and analysis
The CSLM fluorescence was revealed by photomultiplier tubes at 256 grey levels. As the acquisition software (Olympus Fluoview v.3.3) links a different colour to each channel, green for MTG and red for MTO, we adopted the 8-bit values full range (0–255) with a linear Look up Table (LUT) in order to compare both colours. The images were analyzed, measured and processed by the ImageJ software, a public domain Java Image processing programme. The data obtained were elaborated by Microsoft Excel™.
Results and discussion
Sea urchin oocytes synthesize and accumulate a large number of mitochondria, which, after fertilization and during embryogenesis, are partitioned to daughter cells (Matsumoto et al. 1974; Rinaldi et al. 1979a, b). With the simple method, in vivo incubating eggs and embryos with two fluorochromes MitoTracker™ Green and MitoTracker™ Orange, we were able to simultaneously measure the mitochondrial mass, the organelle distribution and the oxidative activity. We determined the mitochondrial mass incubating with MitoTracker™ Green FM, non-fluorescent in aqueous solutions, which becomes fluorescent only when accumulated in the mitochondrial lipid environment, regardless of membrane potential. MitoTracker™ Orange CM-H2TMRos, non-fluorescent reduced form of tetramethylrosamine, is oxidized by the molecular oxygen in actively respiring cells. Then the in vivo incubation allowed measuring the oxidative activity (Morici et al. 2007).
Thousand eggs and embryos were analyzed by CLSM. Each laser specifically excites a single fluorochrome: blue laser at 488 nm excites MTG and not MTO; green laser at 543 nm excites MTO and not MTG. CLSM allows analyzing both green and red fluorescence of each section, avoiding the problems due to the interference of the closer sections, and to the loss of light through the sample. Since the shape of eggs and embryos is comparable to a sphere of about 90 μm diameter, we captured from each sample 30 parallel sections, 3 μm thick. Red pixels, related to mitochondrial activity, are a subset of green pixels, related to mitochondrial mass. Therefore, the absence of red signals could be due to the absence of organelles or to their inactivity. When the whole mitochondrial population was consuming oxygen at the same level (the intensities of green and red pixel were equivalent), the resulting merge was yellow; when mitochondrial activity increased, the merge colour tended to red.
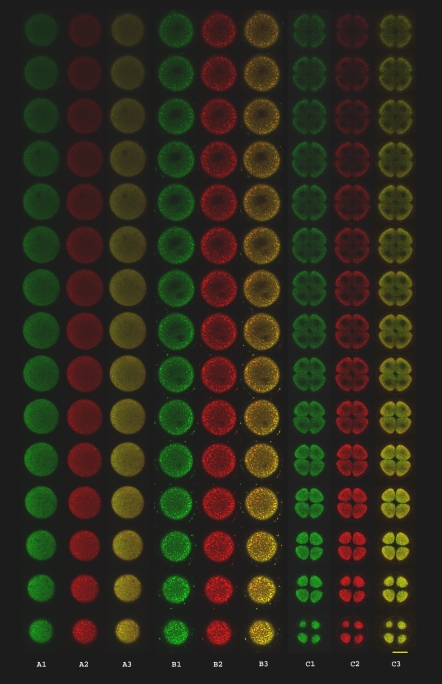
Figure 1 shows the distribution of green, red and merged fluorescence in 15 sections (starting from the bottom close to the laser) of unfertilized (A), just fertilized eggs (B), and 4 blastomeres embryo (C). It seems that in unfertilized eggs the green fluorescence was distributed in the sections, suggesting that the organelles are dispersed in the cytoplasm. In addition the merge of green and red colours suggests that the whole mitochondrial population is consuming oxygen at the same level (the resulting colour verged to yellow). After fertilization mitochondrial population is more active (the resulting colour tends to red) than in unfertilized eggs.
Fig. 1.
Mitochondrial mass and oxidative activity. Distribution of green (MTG) and red (MTO) in 15 parallel sections of unfertilized eggs (A), just fertilized eggs (B), 4 blastomeres (C). Green (1) and red (2) fluorescence; (3) merge. Bar = 50 μm
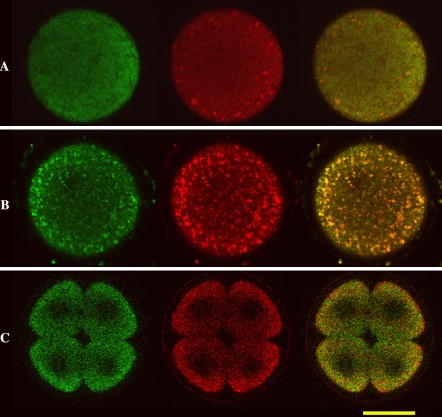
As shown in the Fig. 2, witch represents the enlargement of an equatorial section of eggs and embryos, mitochondria of unfertilized and just fertilized eggs appeared to give rise to clusters especially behind the plasmatic or fertilization membrane. At four-cell stage the clusters disappeared, the organelles were uniformly distributed in the cytoplasm, suggesting a territorial reorganization of the organelles.
Fig. 2.
Enlargement of 3 sections of unfertilized eggs (A), just fertilized eggs (B), 4 blastomeres stage (C). Bar = 50 μm
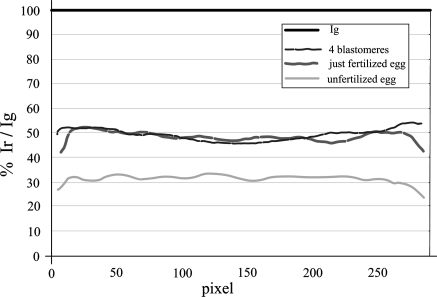
The fluorescence intensity of each section was measured by the ImageJ analysis software. In order to avoid the problems due to the decrease of fluorochromes excitation by the laser through the sample while the distance of the sections from the laser source increased (as shown in the Fig. 1), we measured the signal intensities obtained by the 30 sections per each specimen and integrated by ImageJ software the intensity values. The summation of these values directly indicated the total mitochondrial mass (green) and activity (red). Since mitochondrial mass does not change during development of sea urchin, as demonstrated by Morici et al. (2007), considering mitochondrial mass as 100, we referred the red versus the green values and elaborated the percentage graphs based on the relation: Cr,g = 100 Ir/Ig (Fig. 3). By this mean, we observed that the percentage of mitochondrial activity remained constant at about 30% in unfertilized eggs, while it increased to 50% after fertilization. These results suggest that mitochondria consume oxygen at low level before fertilization, but soon after fertilization the oxidative activity increases. This can be justified by the fact that fertilization induces the activation of metabolism in order to guarantee nuclear and cell duplications, requiring a high energetic support supplied by mitochondria.
Fig. 3.
Mitochondrial activity relative to mass. Normalization of red signals (Ir) versus green (Ig) of unfertilized eggs, just fertilized eggs, 4 blastomeres. The Ir and Ig values are measured along the equatorial plane. 100 pixel = 30 μm
The described method, very simple and immediate, lets researchers to study in vivo mitochondrial mass, activity, and distribution in the cells, avoiding the problems of low recovery and inactivation of organelles. This methodology have been adopted for studying mitochondrial distribution and activity in sea urchin embryos at later stages of development (Morici et al. 2007) and in different systems like human sperms of asthenozoospermic patients (Carra et al. 2004) or human tumoral breast cells (Cannino et al. 2008), suggesting a wide range of application for studying the variations of membrane potential, localization and activity of the organelles.
References
- Cannino G, Ferruggia E, Luparello C, Rinaldi AM (2008) Effects of cadmium chloride on some mitochondria-related activity and gene expression of human MDA-MB231 breast tumor cells (in press) [DOI] [PubMed]
- Carra E, Sangiorgi D, Gattuccio F, Rinaldi AM (2004) Male infertility and mitochondrial DNA. Biochem Biophys Res Commun 322:333–339 [DOI] [PubMed]
- Cuezva JM, Ostronoff LK, Ricart J, Lopez de Heredia M, Di Liegro CM, Izquierdo JM (1997) Mitochondrial biogenesis in the liver during development and oncogenesis. J Bioenerg Biomembr 29:365–377 [DOI] [PubMed]
- Enriquez JA, Fernandez-Silva P, Garrido-Perez N, Lopez-Perez MJ, Perez-Martos A, Montoya J (1999) Direct regulation of mitochondrial RNA synthesis by thyroid hormone. Mol Cell Biol 19:657–670 [DOI] [PMC free article] [PubMed]
- Goffart S, Wiesner RJ (2003) Regulation and co-ordination of nuclear gene expression during mitochondrial biogenesis. Exp Physiol 88:33–40 [DOI] [PubMed]
- Hood DA (2001) Contractile activity-induced mitochondrial biogenesis in skeletal muscle. J Appl Physiol 90:1137–1157 [DOI] [PubMed]
- Jakobs S (2006) High resolution imaging of live mitochondria. Biochimica et Biophysica Acta 1763:561–575 Review [DOI] [PubMed]
- Klingenspor M, Ivemeyer M, Wiesinger H, Haas K, Heldmaier G, Wiesner RJ (1996) Biogenesis of thermogenic mitochondria in brown adipose tissue of Djungarian hamsters during cold adaptation. Biochem J 316:607–613 [DOI] [PMC free article] [PubMed]
- Matsumoto L, Kasamatsu H, Piko L, Vinograd J (1974) Mitochondrial DNA replication in sea urchin oocytes. J Cell Biol 63:146–159 [DOI] [PMC free article] [PubMed]
- Morici G, Agnello M, Spagnolo F, Roccheri MC, Di Liegro CM, Rinaldi AM (2007) Confocal microscopy study of the distribution, content and activity of mitochondria during Paracentrotus lividus development. J Microsc 228:165–173 [DOI] [PubMed]
- Nagata T (2006) Electron microscopic radioautographic study on protein synthesis in hepatocyte mitochondria of aging mice. Scientific World Journal 15:1583–1598 [DOI] [PMC free article] [PubMed]
- Pollak JK, Sutton R (1980) The differentiation of animal mitochondria during development. Trends Biol Chem 5:23–27 [DOI]
- Rinaldi AM, De Leo G, Arzone A, Salcher I, Storace A, Mutolo V (1979a) Biochemical and electron microscopic evidence that cell nucleus negatively controls mitochondrial genomic activity in early sea urchin development. Proc Natl Acad Sci USA 76:1916–1920 [DOI] [PMC free article] [PubMed]
- Rinaldi AM, Salcher-Cillari I, Mutolo V (1979b) Mitochondrial division in non nucleated sea urchin eggs. Cell Biol Int Rep 3:179–182 [DOI] [PubMed]
- Yaffe MP (1999) Dynamic mitochondria. Nat Cell Biol 1:149–150 [DOI] [PubMed]


