Abstract
Human epidermal keratinocytes (HEK) are skin cells of primary importance in maintaining the body’s defensive barrier and are used in vitro to assess the irritation potential and toxicity of chemical compounds. Microfluidic systems hold promise for high throughput irritant and toxicity assays, but HEK growth kinetics have yet to be characterized within microscale culture chambers. This research demonstrates HEK patterning on microscale patches of Type I collagen within microfluidic channels and maintenance of these cells under constant medium perfusion for 72 h. HEK were shown to maintain 93.0%–99.6% viability at 72 h under medium perfusion ranging from 0.025–0.4 μl min−1. HEK maintained this viability while ∼100% confluent—a level not possible in 96 well plates. Microscale HEK cultures offer the ability to precisely examine the morphology, behavior and viability of individual cells which may open the door to new discoveries in toxicological screening methods and wound healing techniques.
Keywords: Cytotoxicity, High-throughput, Keratinocyte, Microfluidic, PDMS, Toxicology
Introduction
In vitro human epidermal keratinocyte (HEK) cultures emerged in the mid 1970s (Liu and Karasek 1978; Rheinwald and Green 1975; Sun and Green 1976) and have historically been used in creating skin covering for treating burn victims and promoting wound healing (Downing et al. 2005; MacNeil 2007). HEK reside in the basal layer of the epidermis and maintain the skin’s homeostatic function in vivo (Zouboulis 2000). Recently, HEK cell cultures have been identified as a possible alternative for animal testing of chemical compounds in dermatotoxicity studies (Bernstein and Vaughan 1999; Monteiro-Riviere et al. 2003; Roguet 1999; Zucco et al. 2004). The use of HEK in toxicity assays (Chou et al. 2002; Didier et al. 1999; Monteiro-Riviere et al. 2005; Rouse et al. 2006; Shvedova et al. 2003) makes this cell type an attractive candidate for use in microfluidic high throughput toxicity assays. Cell culture in microfluidic systems has been demonstrated by others (Chin et al. 2004; Delamarche et al. 2005; Figallo et al. 2007; Flaim et al. 2005; Folch and Toner 2000; Gu et al. 2004; Hui and Bhatia 2007; Hung et al. 2005a, Hung et al. b; Kane et al. 2006; Khademhosseini et al. 2004; Kim et al. 2006; Leclerc et al. 2006a; b; Lee et al. 2006; Prokop et al. 2004; Raty et al. 2004; Rhee et al. 2005; Sin et al. 2004; Song et al. 2005; Toh et al. 2007; Tourovskaia et al. 2005; Walker et al. 2002) but keratinocytes have not yet been studied at the microscale.
HEK used in traditional dermatotoxicity assays are usually cultured in 6, 24, or 96 well plates, each with confined cell populations spanning 104–105 cells per well depending on well size. Thus, a microfluidic culture system for HEK should provide precisely defined cell populations and mimic the established macroscale protocol of seeding HEK within multiwell plates. While perfusion is not present in multiwell plates it may be advantageous in the microfluidic system. For example, complete rinsing of multiwell plates is not easily accomplished with pipettes and usually requires multiple rinses—one area where microfluidic perfusion is more efficient (Warrick et al. 2007). While some microfluidic cell cultures have been static, most microfluidic cell cultures use constant medium perfusion ranging from nanoliters to microliters per minute. Because shear stresses can be amplified in microfluidic culture (Walker et al. 2004), HEK need to be well-characterized over a range of flowrates within microfluidic channels.
This paper describes the first results of a microscale HEK model. A four-channel microfluidic device was used to create four different culture environments spanning a range of flowrates. Islands of patterned Type I collagen were used to define distinct HEK colonies within each microchannel, similar to arrays of cultures in a multiwell plate. The effect of different flowrates on HEK culture was assessed by recording the cell populations every 24 h and the viability at 72 h.
Methods
Device design
A range of acceptable medium flowrates must be determined before HEK can reliably be used for microfluidic applications. The range of flowrates was probed by developing a microfluidic device with four channels, each containing a different normalized flow rate of 0.25, 0.5, 0.75, or 1.0. The four channels are fluidically connected at the input by a common cell medium reservoir and all four channels merge together at a single exit port.
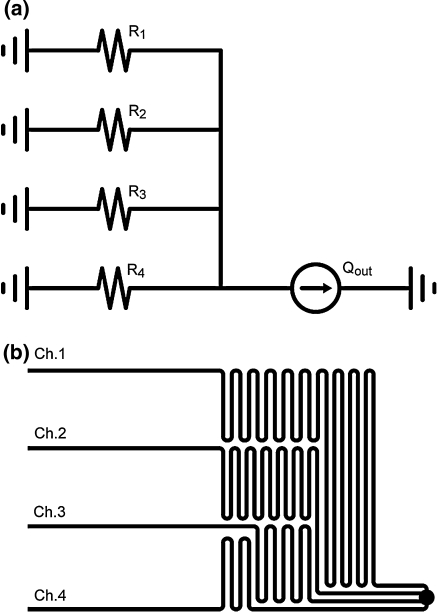
The design was modeled using a simple electrical circuit as shown in Fig. 1a; the resulting microfluidic analog is shown in Fig. 1b. The constant current source represents the syringe pump withdrawing fluid and the resistors represent the fluidic resistance of each microchannel. A common fluid reservoir was used to eliminate any pressure differences between the four inputs. The normalized microchannel flow rates of 0.25, 0.5, 0.75, or 1.0 were achieved by adjusting the fluidic resistances with respect to R1 as R2 = 1/2 R1, R3 = 1/3 R1 and R4 = 1/4 R1. Because the fluidic resistance of a microchannel is linearly proportional to its length, the lengths of the four microchannels were scaled in the same proportion of the resistances to achieve the flow rate requirements.
Fig. 1.
(a) Electrical resistance network modeling four channel device. (b) Four channel device creates 1/10, 1/5, 3/10, and 2/5 of Qout in channels 1–4 respectively by adjusting R1–R4 accordingly
Microfluidic device fabrication
The microfluidic device was built using conventional soft lithography and poly(dimethylsiloxane) (PDMS) molding techniques (Whitesides et al. 2001). The microfluidic device layout was drawn with Adobe Illustrator CS2 and printed as a 3556 dpi photomask. The molding master was made by spin coating a negative tone photoresist (SU-8 2050, Microchem Corp., Newton, MA) on a silicon wafer at 1700 rpm yielding 100 μm tall channels. The wafer was soft baked and subsequently exposed through the photomask using an ultraviolet light source (BlakRay B-100A, UVP, Upland, CA). The wafer was then post-exposure baked, developed, and hard baked. PDMS (SYLGARD 184 Silicone Elastomer Kit, Dow Corning, Midland, MI) was poured and cured over the master to create the channel network. Bonding the PDMS structure with a glass slide enclosed the channels. A syringe pump (Pump 11 Pico Plus, Harvard Apparatus) holding a 1 ml syringe with a 24 gauge dispensing tip (Howard Electronic Instruments, El Dorado, KS) metered fluid through 0.51 mm I.D./1.52 mm O.D. Tygon tubing (Cole-Parmer, Vernon Hills, IL) into an access port cored into the PDMS with a sharpened 16 gauge dispensing tip.
Microfluidic device design validation
The microfluidic device was tested to validate its ability to deliver four flowrates in the ratio of 0.25, 0.5, 0.75 and 1.0 through the four microchannels. Deionized water flow was induced through the device at 1.45 μl min−1. Using fluorescence microscopy (Olympus IX71), 16 μm polystyrene microspheres (Bang Laboratories, Fishers, IN) were observed traveling through each channel. The focal plane was adjusted to visualize the spheres traveling in the center of the velocity profile in order to capture the maximum velocity. Bead velocity was determined in each microchannel by measuring the time necessary for multiple beads (N ≥ 40) to travel 1 mm marked by a reticle scale. The maximum velocity measurements were divided by 2.096 to determine the average velocity values for flow in a rectangular duct (Shah and London 1978).
Culture device preparation
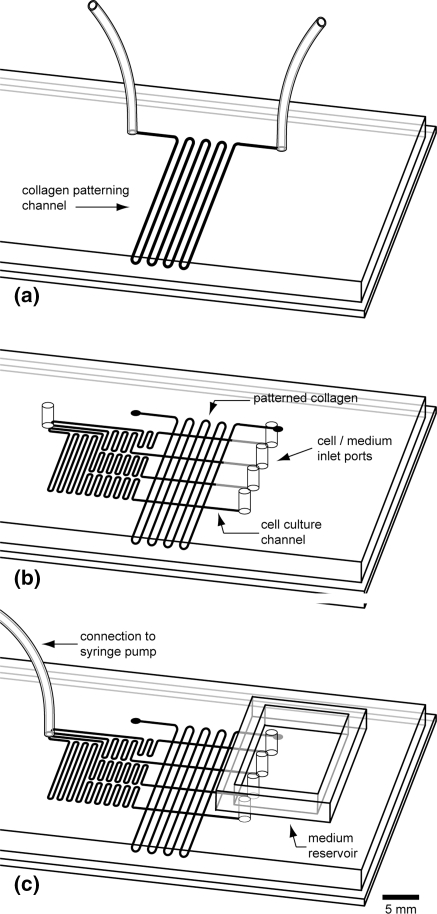
A 50 × 75 mm glass slide was cleaned with isopropyl alcohol and clear Scotch tape (3M, St. Paul, MN) for subsequent collagen patterning. Type I rat tail collagen (BD Biosciences, Bedford, MA) was chosen because HEK are known to selectively adhere to it and proliferate. PDMS molded with a 300 μm wide serpentine channel was placed on the glass slide and 0.16 mg ml−1 collagen in a sterile water solution was flowed through the channel as shown in Fig. 2a. The collagen adsorbed for 1 h, after which the channel was rinsed with phosphate buffered saline (PBS) for 10 min and allowed to dry. Once dry, the PDMS was peeled from the slide. A second PDMS mold containing four 300 μm wide microchannels of different lengths was oxygen plasma treated for 30 s and then mounted on the glass slide such that the culture channels intersected perpendicular to the collagen lines as shown in Fig. 2b. The intersection of the collagen lines with the microchannels created 300 μm collagen squares. Similar to eight wells in one row of a 96-well plate, eight collagen squares were patterned per channel. The patch size was set at 300 × 300 μm so that an entire cell colony could be captured in one digital image using a 20× objective, allowing for accurate cell inspection. Tubing was connected and the medium well was placed on the PDMS to complete the assembly as shown in Fig. 2c. The device was then filled with PBS and sterilized using 1 h of ultraviolet light exposure inside a biosafety hood. The reservoir was emptied of PBS and filled with keratinocyte growth medium (KGM-2, Lonza Bioscience). KGM-2 was flowed through the device at 2.0 μl min−1 for 30 min to prepare the device for cell seeding.
Fig. 2.
Microfluidic device assembly: (a) collagen is patterned in vertical lines on a 50 × 75 mm glass slide, (b) PDMS four channel structure is aligned over collagen, (c) medium reservoir and tubing are attached
Cell seeding
Twice passaged and cryopreserved normal neonatal human epidermal keratinocytes (NHEK) (Clonetics NHEK, Lonza Bioscience) were thawed in a 37°C water bath, suspended in 12 ml of cell medium, and centrifuged at 1,000 rpm for 5 min. After aspirating the medium, the cells were resuspended to a concentration of 1,000 cells per microliter. The flow rate was adjusted on the syringe pump to achieve an approximate 0.5 μl min−1 channel flow rate for the channel being seeded with cells. Each channel received 4 μl of cell suspension pipetted into the channel inlet.
The device was placed inside a glass petri dish and placed in an incubator at 37°C, 5% CO2, and 95% relative humidity. A few drops of KGM-2 were placed inside the petri dish to further induce humidity. Medium perfusion at 1.0 μl min−1 began upon placing the device in the incubator and was maintained for 1 hr. The pump was then set to the experimental flowrate of either 0.25 μl min−1 or 1.0 μl min−1, generating four distinct flowrates within each device.
The control experiment consisted of culturing HEK in a 96 well plate using conventional protocol (Chou et al. 2002). Approximately 7,000 cells were incubated in 200 μl of KGM-2 per well. The medium was changed at 24 h, after which the cells were allowed to incubate for the remainder of the test period undisturbed. Three wells were used and the cell counts were averaged. Viability at 72 h was assessed by randomly selecting two regions of interest in each well, each containing approximately 200 cells, and manually counting the live and dead cells in each image to determine a viability percentage. Initial cell viability was assessed via Trypan Blue staining and cell enumeration in a hemocytometer. Cell suspensions with less than 90% viability were not used in cell culture experiments.
Cell proliferation
The microfluidic device was examined daily to verify sterility and to assess cell morphology. The cell colonies were imaged using a monochrome CCD camera (Hamamatsu ORCA-ER) mounted to an inverted microscope (Olympus IX71). Images were captured and analyzed using IPLab (Scanalytics, Rockville, MD) at 0, 2, 24, 48 and 72 h. Cell viability was determined using fluorescence assays. Live cells were detected with 2.0 μM SYTO 9 and dead cells were detected with 0.5 μM ethidium homodimer-1 (Molecular Probes, Eugene OR) in KGM-2. A FITC filter set and a Texas Red filter set (Chroma Technology, Brattleboro, VT) were used to image the live and dead cells respectively.
Immuno-fluorescent staining of patterned collagen
The presence of the patterned collagen squares was verified using immuno-staining techniques. A device was assembled (Fig. 2) and filled with PBS. The device was then filled with the primary antibody, a rabbit host polyclonal anti-Type I rat collagen (Millipore, Billerica, MA) diluted 1:25 in PBS, and allowed to incubate for 1 h. After the 1 h incubation period, the channels were rinsed with PBS for 20 min using a continuous 2 μl min−1 flow through the device. To block the non-collagen coated surfaces, the device was filled with SuperBlock blocking buffer (Pierce, Rockford, IL) and incubated for 1 h. The blocking solution was rinsed from the channels with PBS for 20 min at 2 μl min−1. The device was then filled with the secondary antibody solution, a FITC conjugated goat anti-rabbit IgG (Millipore, Billerica, MA) diluted at 1:25 in PBS, incubated for 1 hr, and rinsed with PBS for 20 min at 2 μl min−1. All incubations were conducted at room temperature under static flow conditions. The immuno-stained collagen squares were then imaged through a FITC filter set using exposure times between 30 and 80 ms. The control experiment followed the same protocol excluding the primary antibody incubation. The collagen squares were also imaged unlabeled in PBS to detect for any collagen auto-fluorescence.
Results
Four channel device performance
The bead velocity measurements were averaged and used to calculate the observed flow rate in each channel. The results of this experiment are shown in Table 1. The data indicate that the device performed as designed and delivered the desired ratio of KGM-2 among the four cell culture channels. The slight discrepancies between predicted and observed velocities can be attributed to variations in master feature height and PDMS deformation.
Table 1.
Four channel design flow rate verification
| Actual (μl min−1) | Normalized | Target | Discrepancy (%) | |
|---|---|---|---|---|
| Ch.1 | 0.155 | 0.273 | 0.25 | 7.2 |
| Ch.2 | 0.294 | 0.519 | 0.50 | 1.9 |
| Ch.3 | 0.433 | 0.764 | 0.75 | 0.1 |
| Ch.4 | 0.567 | 1.000 | 1.00 | −1.8 |
Flow rate by channel; total device flow through is 1.45 μl min−1
Collagen detection
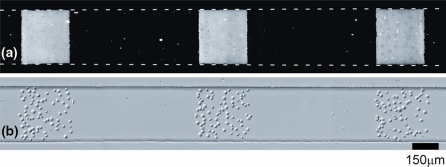
Labeling the patterned collagen revealed the presence of well-defined square patches. Figure 3a shows three representative FITC labeled collagen squares in a microchannel. These images show that the collagen consistently and fully covered the glass slide in the patterned area. The brightest fluorescence signal was observed at 1:25 dilution ratios for both primary and secondary antibodies in PBS. Primary antibody concentrations ranging from 1:10 to 1:40 and secondary antibody concentrations ranging from 1:25 to 1:200 were used to optimize the protocol. Both antibody concentrations were continually adjusted until a bright fluorescence signal was observed. Rinse conditions were also found important; PBS flowing through a channel at 2 μl min−1 would strip the secondary antibody off the patches while a rinse below 0.2 μl min−1 would not clear any agglomerated particles from the channel. A 2 μl min−1 syringe pump flow rate yielded channel flow rates between 0.2 and 0.8 μl min−1 and allowed for clear and uniform images in all four channels.
Fig. 3.
Microfluidic cell culture channel; (a) patterned collagen squares labeled with primary and FITC conjugated secondary antibodies, (b) keratinocytes attached to collagen squares after seeding in channel
Cell culture optimization
The results of the cell culture optimization showed that HEK can be successfully cultured on collagen patches within microfluidic channels, although with altered growth kinetics from static macroscale culture. In traditional irritant screening, HEK are cultured to a confluency of 70–80%, or usually about 24 h post seeding. The doubling time of HEK in 25 cm2 T-flasks is approximately 24 h in early growth cycles (Hata et al. 2005). The cells are then exposed to an irritant and subsequently observed for a maximum of 48 h post-exposure. Thus, the results reported here were from HEK cultures spanning 72 h in the microchannels.
One critical factor in culturing HEK is the initial seeding density. Table 2 shows a comparison of different cell culture dishes and common cell seeding densities used to initiate HEK culture (Chou et al. 2002; Lonza Bioscience 2007b; Rouse et al. 2006; Witzmann et al. 2005). The data demonstrate a trend that decreasing growth area necessitates higher initial cell seeding densities. This trend was seen to continue in microfluidic culture. Cell colonies were seeded with densities ranging from approximately 7 × 10⁴ to 1 × 10⁵ cells cm−2, which allowed the microchannel patches to grow to full confluency. The cells shown in Fig. 3b are seeded at 8.3 × 10⁴ cells cm−2, or approximately 75 cells per patch. Cell colonies seeded at a density below 4.5 × 10⁴ cells cm−2 never grew to confluency over the course of a 72 h cell culture period, confirming results from the initial in vitro work with HEK cultures (Liu and Karasek 1978). Cell colonies seeded at densities higher than 1 × 10⁵ cells cm−2 would spread off the collagen patch onto the unpatterned glass.
Table 2.
HEK culture area versus seeding density comparison
| Culture surface | Cell seeding density (cells cm−2) (citation) |
|---|---|
| 75 cm2 flask | 1.2 × 10³ (Chou et al. 2002) |
| 25 cm2 flask | 3.5 × 10³ (Lonza Bioscience 2007b) |
| 6-well plate (9.6 cm2) | 1.0 × 10⁴ (Witzmann et al. 2005) |
| 96-well plate (0.32 cm2) | 2.2 × 10⁴ (Rouse et al. 2006) |
| Micro-channel patch (0.0009 cm2) | 0.7–1 × 10⁵ |
The collagen concentration used for patterning the microchannels was adjusted from conventional HEK culture on glass surfaces. A 0.1 mg ml−1 collagen in sterile water solution is commonly used in culturing HEK in petri dishes and on glass coverslips. However, the 0.1 mg ml−1 collagen concentration was not sufficient to capture the cells as they flowed down the microchannel during seeding. Therefore the collagen concentration was increased by approximately 50% to promote initial attachment. Collagen concentrations at and above 0.2 mg ml−1 were too aggressive at capturing cells, thereby making it difficult to adhere the desired 8 × 10⁴ cells cm−2 seeding density.
HEK adhered to the collagen patches during initial seeding and immediately began to attach and transition from a round to a flat morphology. Cell populations imaged at two hours showed the majority of cells had begun to spread out as seen in Fig. 4b. Cells that attached and spread out at 24 h were deemed healthy by morphological examination. Figure 4a–f shows images of a cell colony cultured for three days and a fluorescence image of the cells after a live/dead assay. This colony was cultured in a 0.4 μl min−1 channel and resulted in 100% viability at 72 h.
Fig. 4.
(a) HEK seeded in microfluidic channel at t = 0, (b) t = 2 h, (c) t = 24 h, (d) t = 48 h, (e) t = 72 h and (f) live/dead fluorescence image following 72 h imaging
Another interesting feature in Fig. 4 is the high level of confluency on the microscale patch. In 96 well plate culture a HEK confluency of 100% is next to impossible to achieve; the confluency reaches a maximum of approximately 80% before viability begins to decline, and on the rare occasion when confluency exceeds 80% the HEK colonies become overcrowded and pile up, resulting in declining viability. In the microfluidic colonies, the cells maintained high viability near 100% confluency. Exceedingly small populations of cells near 100% confluency that maintain high viability is unique to HEK cultured at the microscale. Furthermore, this microfluidic system mimics the in vivo environment in a manner superior to traditional HEK cell culture approaches.
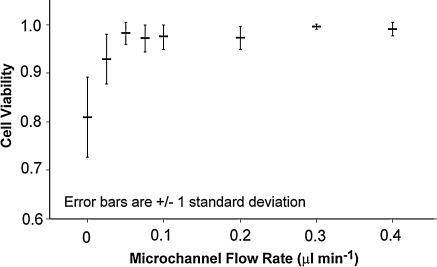
HEK are very hardy cells capable of flourishing within a range of flow rates. Experiments that were conducted to determine an optimal medium flow rate indicated a broad window of supporting flow rates. The culture microchannel flow rates tested ranged from 0.025 μl min−1 to 0.4 μl min−1 (Fig. 5). At 0.025 μl min−1 cell viability at 72 h was 93.0% and increased to 99.1% at 0.4 μl min−1, with a maximum value of 99.6% at 0.3 μl min−1. A viability of 87.6% was observed for the control cells cultured in the 96 well plate. The data suggest that flowrates do affect viability (P < 0.001) and that a broad range of flow rates can be used for culturing the HEK. A supporting range of flow rates spanning one order of magnitude may lend versatility to many potential microfluidics based assays. Additionally, such high viability at 72 h supports extending toxicological assessments past the conventional 72 h evaluation period, something not easily accomplished with traditional in vitro HEK culture systems.
Fig. 5.
Increasing flowrates were found to increase cell viability from 80.9% at 0 μl min−1 to 99.1% at 0.4 μl min−1. The 96 well control demonstrated an average 87.6% viability with 17.6% standard deviation
Under low flow conditions HEK viability dips slightly, which may be due to glucose and other nutrient deprivation. The HEK glucose consumption rate is on the order of 2 × 10⁻¹³ g cell−1 min−1 (Lonza Bioscience 2007, Personal communication). The glucose content in the keratinocyte basal medium used to constitute KGM-2 is 1.081 g l−1 (Lonza Bioscience 2007, Personal communication). Thus, cells in a single culture microchannel should at minimum be able to survive with a single culture volume change every 18 h if glucose consumption is the limiting factor. This result was confirmed by an experiment conducted to assess cell viability in static conditions. A four channel device was seeded with cells and statically incubated for 72 h. A live/dead cell assay indicated 80.9% viability. High flows tended to increase cell viability with diminishing effect—the viability of cells exposed to 0.4 μl min−1 flow exceeded 99%. The trend of increasing viability with increasing flow rates may result from dead cells being carried downstream by the higher flow rates. However, these high flow rates will unlikely be necessary in most microfluidic HEK cultures.
The shear stress experienced by HEK in the microchannels was calculated using parallel plate model equations (Frangos et al. 1988). Shear stress ranged from 0.008 dyn cm−2 at 0.025 μl min−1 to 0.133 dyn cm−2 at 0.4 μl min−1. The shear stress exerted on the cells by a 0.4 μl min−1 flow rate is approximately five to six orders of magnitude smaller than the shear stress exerted on the skin of a person’s back resting in a hospital bed set at an incline (Zhang et al. 1994). Therefore, the stress exerted on the keratinocytes in the microchannels was negligible compared to normal resting in vivo conditions.
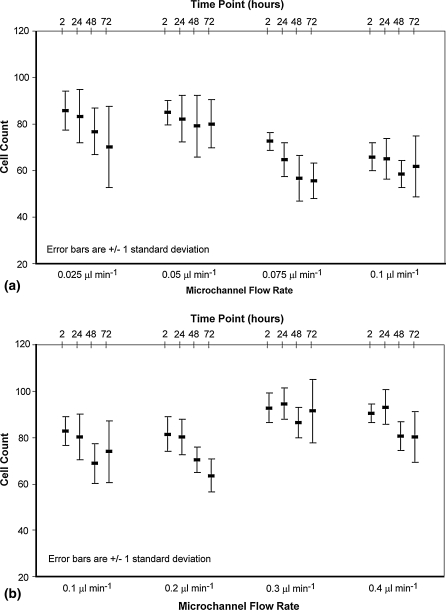
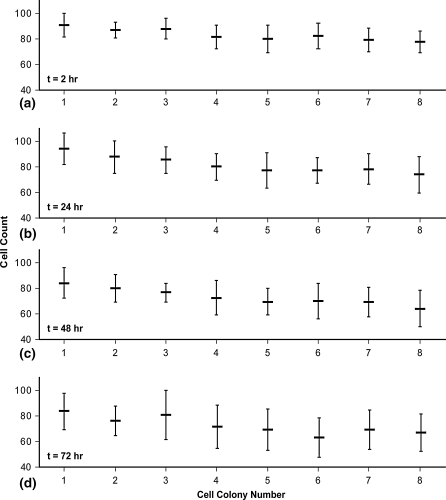
Cell growth was examined by charting the cell count per patch at each time point. Fig. 6 shows the cell count averaged over the eight colonies in each distinct flow rate channel for each time point. Figure 6a,b illustrate a device run with channel flow rates spanning 0.025–0.1 μl min−1 and 0.1–0.4 μl min−1, respectively. A general trend seen was a decrease in cell population from 2 to 48 h, in contrast to an increase in population over time in static cultures (Liu and Karasek 1978). However, cell viability within the microchannels remained high and exceeded that of the static culture at 72 h (Fig. 5). These results suggest that cells spread out over time, filling gaps left by dead cells. During spreading some cells may be forced off the patch and separated from the colony. HEK populations between patches (Fig. 7) do not show a trend indicative of cells detaching and reattaching downstream. Rather, they show the opposite trend which results from the cell seeding procedure.
Fig. 6.
Cells on eight patches per microchannel, four microchannels per device, were counted and averaged at time points 2, 24, 48, and 72 h using DIC microscopy. Cells were cultured on two devices, one providing flowrates of (a) 0.025, 0.05, 0.075, and 0.1 μl min−1 and the other (b) 0.1, 0.2, 0.3, and 0.4 μl min−1
Fig. 7.
Cell population counts per patch were averaged over all flow rates and plotted at four culture times: (a) t = 2 h, (b) t = 24 h, (c) t = 48 h, and (d) t = 72 h. A slight downward population trend exists within the channels, indicating that cells preferentially attached to the collagen squares closest to the channel inlet. This trend was generally maintained through the 72 h culture period
After 48 h the cell counts are seen to essentially remain constant. Slight decreases in cell population can be attributed to a continuation of the spreading and shedding mechanism. Static cell counts may be explained by the colony reaching a temporary equilibrium. Figure 4 is an example of this case; the cell counts are 70, 69, 65, 63, and 65 at time points 0, 2, 24, 48, and 72 h respectively. The slight diversity in cell counts after 48 h may be in part the result of observing small cell populations. For example, when a cell population is drastically reduced in size, e.g. 150,000 cells to 80 cells, the behavior of the individual cells have a greater influence on the trend than would individual cells in a large population. Having an initially small number of cells, each in a different phase of its division cycle, a colony count may be seen to increase, decrease or stay the same at any moment in time. With much larger cell populations the effect of the individual cell is lost and the general cell growth and increase in cell number is consistently observed. Regardless of the trend, all microscale cell colonies became confluent and maintained relatively high cell viability. This finding presents an interesting challenge to the concept of successful cell cultures at the microscale. Namely, total cell population cannot be used as the sole marker for successful microscale growth, unlike in traditional macroscale cultures.
Discussion
HEK cultured in microfluidic channels on collagen patches showed a distinctly different behavior pattern than HEK cultured in traditional static conditions. When grown in microchannels, HEK maintained high levels of viability but cells did not double in proliferation at 24 h as is common in static flask cultures of HEK. The HEK grown in microscale patches were nearly 100% confluent, in contrast to HEK grown in traditional multiwell plates or flasks. HEK maintained high levels of viability but did not have the same replication times as HEK in macroscale cultures. Flow rates were found to slightly affect cell viability, which never fell below 93.0% over the range of flowrates investigated here, making HEK an attractive cell type for incorporation into high throughput arrays. Furthermore, the microscale colony health at 72 h suggests that assays utilizing HEK cells can be extended beyond the conventional 72 h period, allowing for new insight in the cell behavior. In addition, the approach of culturing HEK in microscale patches allows for a new level of resolution in studying cell behavior. Cells can be examined on an individual level or in small colonies of several dozen rather than as a statistically sampled population. The experimental unit is no longer a mass of cells whose behavior is measured in terms of a lumped single number.
On the microscale, individual cells within colonies can be observed for uptake studies and individual comparisons can be made between them, including size and shape morphology examination and viability. This study also depicts the feasibility of using HEK in a microfluidic model system designed to assess HEK behavior in a high throughput system. Currently there is tremendous demand for toxicological evaluation of dermal exposure to nanomaterials. With the magnitude of nanoparticle research and the seemingly unlimited physiochemical variants of nanoparticles, a new solution to dermal toxicity evaluation is required. A microfluidics based high throughput toxicity platform incorporating HEK can meet this demand.
Acknowledgements
This work was supported in part by the Johns Hopkins Center for Alternatives to Animal Testing and a Society of Toxicology Colgate Palmolive Research Award.
References
- Bernstein IA, Vaughan FL (1999) Cultured keratinocytes in in vitro dermatotoxicological investigation: a review. J Toxicol Environ Health 2:1–30 [DOI] [PubMed]
- Chin VI, Taupin P, Sanga S, Scheel J, Gage FH, Bhatia SN (2004) Microfabricated platform for studying stem cell fates. Biotechnol Bioeng 88:399–415 [DOI] [PubMed]
- Chou CC, Riviere JE, Monteiro-Riviere NA (2002) Differential relationship between the carbon chain length of jet fuel aliphatic hydrocarbons and their ability to induce cytotoxicity vs. interleukin-8 release in human epidermal keratinocytes. Toxicol Sci 69:226–233 [DOI] [PubMed]
- Delamarche E, Juncker D, Schmid H (2005) Microfluidics for processing surfaces and miniaturizing biological assays. Adv Mater 17:2911–2933 [DOI]
- Didier C, Emonet-Piccardi N, Beani JC, Cadet J, Richard MJ (1999) L-arginine increases UVA cytotoxicity in irradiated human keratinocyte cell line: potential role of nitric oxide. FASEB J 13:1817–1824 [DOI] [PubMed]
- Downing BR, Cornwell K, Toner M, Pins GD (2005) The influence of microtextured basal lamina analog topography on keratinocyte function and epidermal organization. J Biomed Mater Res 72A:47–56 [DOI] [PubMed]
- Figallo E, Cannizzaro C, Gerecht S, Burdick JA, Langer R, Elvassore N, Vunjak-Novakovic G (2007) Micro-bioreactor array for controlling cellular microenvironments. Lab Chip 7:710–719 [DOI] [PubMed]
- Flaim CJ, Chien S, Bhatia SN (2005) An extracellular matrix microarray for probing cellular differentiation. Nat Methods 2:119–125 [DOI] [PubMed]
- Folch A, Toner M (2000) Microengineering of cellular interactions. Annu Rev Biomed Eng 2:227–256 [DOI] [PubMed]
- Frangos JA, Mcintire LV, Eskin SG (1988) Shear-stress induced stimulation of mammalian-cell metabolism. Biotechnol Bioeng 32:1053–1060 [DOI] [PubMed]
- Gu W, Zhu X, Futai N, Cho BS, Takayama S (2004) Computerized microfluidic cell culture using elastomeric channels and Braille displays. PNAS 101:15861–15866 [DOI] [PMC free article] [PubMed]
- Hata N, Agatahama Y, Kino-oka M, Taya M (2005) Relations between individual cellular motions and proliferative potentials in successive cultures of human keratinocytes. Cytotechnology 47:127–131 [DOI] [PMC free article] [PubMed]
- Hui EE, Bhatia SN (2007) Microscale control of cell contact and spacing via three-component surface patterning. Langmuir 23:4103–4107 [DOI] [PMC free article] [PubMed]
- Hung PJ, Lee PJ, Sabounchi P, Aghdam N, Lin R, Lee LP (2005a) A novel high aspect ratio microfluidic design to provide a stable and uniform microenvironment for cell growth in a high throughput mammalian cell culture array. Lab Chip 5:44–48 [DOI] [PubMed]
- Hung PJ, Lee PJ, Sabounchi P, Lin R, Lee LP (2005b) Continuous perfusion microfluidic cell culture array for high-throughput cell-based assays. Biotechnol Bioeng 89:1–8 [DOI] [PubMed]
- Kane BJ, Zinner MJ, Yarmush ML, Toner M (2006) Liver-specific functional studies in a microfluidic array of primary mammalian hepatocytes. Anal Chem 78:4291–4298 [DOI] [PubMed]
- Khademhosseini A, Suh KY, Jon S, Eng G, Yeh J, Chen GJ, Langer R (2004) A soft lithographic approach to fabricate patterned microfluidic channels. Anal Chem 76:3675–3681 [DOI] [PubMed]
- Kim L, Vahey MD, Lee HY, Voldman J (2006) Microfluidic arrays for logarithmically perfused embryonic stem cell culture. Lab Chip 6:394–406 [DOI] [PubMed]
- Leclerc E, Corlu A, Griscom L, Baudoin R, Legallais C (2006a) Guidance of liver and kidney organotypic cultures inside rectangular silicone microchannels. Biomaterials 27:4109–4119 [DOI] [PubMed]
- Leclerc E, David B, Griscom L, Lepioufle B, Fujii T, Layrolle P, Legallaisa C (2006b) Study of osteoblastic cells in a microfluidic environment. Biomaterials 27:586–595 [DOI] [PubMed]
- Lee P, Lin R, Moon J, Lee LP (2006) Microfluidic alignment of collagen fibers for in vitro cell culture. Biomed Microdevices 8:35–41 [DOI] [PubMed]
- Liu SC, Karasek M (1978) Isolation and growth of adult human epidermal keratinocytes in cell culture. J Invest Dermatol 71:157–162 [DOI] [PubMed]
- Lonza Bioscience (2007) Clonetics normal human epidermal keratinocyte cell systems: instructions for use
- MacNeil S (2007) Progress and opportunities for tissue-engineered skin. Nature 445:874–880 [DOI] [PubMed]
- Monteiro-Riviere NA, Baynes RE, Riviere JE (2003) Pyridostigmine bromide modulates topical irritant-induced cytokine release from human epidermal keratinocytes and isolated perfused porcine skin. Toxicology 183:15–28 [DOI] [PubMed]
- Monteiro-Riviere NA, Nemanich RJ, Inman AO, Wang YY, Riviere JE (2005) Multi-walled carbon nanotube interactions with human epidermal keratinocytes. Toxicol Lett 155:377–384 [DOI] [PubMed]
- Prokop A, Prokop Z, Schaffer D, Kozlov E, Wikswo J, Cliffel D, Baudenbacher F (2004) NanoLiterBioReactor: long-term mammalian cell culture at nanofabricated scale. Biomed Microdevices 6:325–339 [DOI] [PubMed]
- Raty S, Walters EM, Davis J, Zeringue H, Beebe DJ, Rodriguez-Zas SL, Wheeler MB (2004) Embryonic development in the mouse is enhanced via microchannel culture. Lab Chip 4:186–190 [DOI] [PubMed]
- Rhee SW, Taylor AM, Tu CH, Cribbs DH, Cotman CW, Jeon NL (2005) Patterned cell culture inside microfluidic devices. Lab Chip 5:102–107 [DOI] [PubMed]
- Rheinwald JG, Green H (1975) Serial cultivation of strains of human epidermal keratinocytes—formation of keratinizing colonies from single cells. Cell 6:331–343 [DOI] [PubMed]
- Roguet R (1999) Use of skin cell cultures for in vitro assessment of corrosion and cutaneous irritancy. Cell Biol Toxicol 15:63–75 [DOI] [PubMed]
- Rouse JG, Yang J, Barron AR, Monteiro-Riviere NA (2006) Fullerene-based amino acid nanoparticle interactions with human epidermal keratinocytes. Toxicol in vitro 20:1313–1320 [DOI] [PubMed]
- Shah RK, London AL (1978) Laminar flow forced convection in ducts: a source book for compact heat exchanger analytical data. Academic Press, New York, 477 p
- Shvedova AA, Kisin ER, Murray AR, Gandelsman VZ, Maynard A, Baron P (2003) Exposure to carbon nanotube material: assessment of nanotube cytotoxicity using human keratinocyte cells. J Toxicol Environ Health Part A 66:1909–1926 [DOI] [PubMed]
- Sin A, Chin KC, Jamil MF, Kostov Y, Rao G, Shuler ML (2004) The design and fabrication of three-chamber microscale cell culture analog devices with integrated dissolved oxygen sensors. Biotechnol Prog 20:338–345 [DOI] [PubMed]
- Song JW, Gu W, Futai N, Warner KA, Nor JE, Takayama S (2005) Computer-controlled microcirculatory support system for endothelial cell culture and shearing. Anal Chem 77:3993–3999 [DOI] [PubMed]
- Sun TT, Green H (1976) Differentiation of epidermal keratinocyte in cell-culture - formation of cornified envelope. Cell 9:511–521 [DOI] [PubMed]
- Toh YC, Zhang C, Zhang J, Khong YM, Chang S, Samper VD, Van Noort D, Hutmacher DW, Yu H (2007) A novel 3D mammalian cell perfusion-culture system in microfluidic channels. Lab Chip 7:302–309 [DOI] [PubMed]
- Tourovskaia A, Figueroa-Masot X, Folch A (2005) Differentiation-on-a-chip: a microfluidic platform for long-term cell culture studies. Lab Chip 5:14–19 [DOI] [PubMed]
- Walker GM, Ozers MS, Beebe DJ (2002) Insect cell culture in microfluidic channels. Biomed Microdevices 4:161–166 [DOI]
- Walker GM, Zeringue HC, Beebe DJ (2004) Microenvironment design considerations for cellular scale studies. Lab Chip 4:91–97 [DOI] [PubMed]
- Warrick J, Meyvantsson I, Ju J, Beebe DJ (2007) High-throughput microfluidics: improved sample treatment and washing over standard wells. Lab Chip 7:316–321 [DOI] [PubMed]
- Whitesides GM, Ostuni E, Takayama S, Jiang X, Ingber DE (2001) Soft lithography in biology and biochemistry. Annu Rev Biomed Eng 3:335–373 [DOI] [PubMed]
- Witzmann FA, Monteiro-Riviere NA, Inman AO, Kimpel MA, Pedrick NM, Ringham HN, Riviere JE (2005) Effect of JP-8 jet fuel exposure on protein expression in human keratinocyte cells in culture. Toxicol Lett 160:8–21 [DOI] [PubMed]
- Zhang M, Turner-Smith AR, Roberts VC (1994) The reaction of skin and soft tissue to shear forces applied externally to the skin surface. Proc IME H J Eng Med 208:217–222 [DOI]
- Zouboulis CC (2000) Human Skin: an independent peripheral endocrine organ. Horm Res 54:230–242 [DOI] [PubMed]
- Zucco F, De Angelis I, Testai E, Stammati A (2004) Toxicology investigations with cell culture systems: 20 years after. Toxicol in vitro 18:153–163 [DOI] [PubMed]


