Abstract
To understand the molecular mechanism underlying vigorous proliferative activity of hepatic stem-like (HSL) cells, we performed two-dimensional electrophoresis to identify the proteins statistically more abundant in rapidly growing undifferentiated HSL cells than in sodium butyrate-treated differentiated HSL cells. Matrix-assisted laser desorption/ionization-time of flight mass spectrometry and Mascot search identified 6 proteins including prohibitin, vimentin, ezrin, annexin A3, acidic ribosomal phosphoprotein P0 and Grp75. Prohibitin and vimentin control the mitogen-activated protein (MAP) kinase pathway. Ezrin is phosphorylated by various protein-tyrosine kinases and modulates interactions between cytoskeletal and membrane proteins. Annexin A3 has a role in DNA synthesis. Acidic ribosomal phosphoprotein P0 and Grp75 play in protein synthesis. These results suggest that the proteins related to the MAP kinase cascade had some role in continuous proliferation of HSL cells without differentiation.
Keywords: Proteomics, Hepatic stem-like cells, Two-dimensional electrophoresis, Butyrate, Differentiation
Introduction
Hepatic stem-like (HSL) cells have a potential of self-renewal and an ability to differentiate to hepatocytes and biliary duct cells (Nagai et al. 2002). Recently, Yamada et al. (2005) described that HSL cells converted to pancreatic neuroendocrine cells when incubated with sodium butyrate (NaB) and betacellulin. While many tissue stem cells are cultured in vitro in the medium with some growth factors, cytokines or extracellular matrix, HSL cells proliferate in Dulbecco’s Modified Eagle’s Medium (DMEM) with 10% fetal calf serum (FCS) without differentiation or tumorigenesis. If the mechanisms underlying continuous proliferation of HSL cells without differentiation become clear, many tissue stem cells will be applicable to cell transplantation therapy for many types of diseases.
A histone deacetylase inhibitor, NaB, acts as a differentiation-promoting agent for a wide variety of cell types. In mice, NaB induces differentiation of immature hepatocytes into mature parenchymal cells and reduces their proliferation (Iwai et al. 2002). Recently, it was shown that human and murine embryonic stem cells were able to differentiate into hepatocyte-like cells by treatment with NaB (Zhou et al. 2007; Sharma et al. 2006; Rambhatla et al. 2003). When HSL cells were cultured with NaB, they converted to flattened cells with large cytoplasm (Yamada et al. 2005). There are many studies about NaB induced differentiation, while there is little information about anti-proliferative effect of NaB on HSL cells. To reveal the molecular mechanisms that sustain proliferative activity of HSL cells with pluripotency, it is necessary to identify the molecular event induced by NaB treatment. In this study, we performed two-dimensional electrophoresis (2-DE) to search for proteins statistically more abundant in undifferentiated HSL cells than in NaB-treated cells, and identified those proteins by matrix-assisted laser desorption/ionization-time of flight mass spectrometry (MALDI-TOF-MS) analysis. These proteins might be participated in the molecular mechanism that causes the vigorous proliferative activity of the HSL cells.
Experimental procedure
Cell culture
HSL cells were cultured in DMEM (Asahi Technoglass Co., Tokyo, Japan) with 10% FCS (Biofluids, Rockville, MD, USA) at 37 °C in a 5% CO2 atmosphere. Cells were used for experiment at 80% confluence.
Two-dimensional gel electrophoresis
An HSL pellet about 70 mg in weight (2 dishes of 100 mm culture dish, nearly confluent) were lysed in 350 μL of extraction solution (8 M urea, 1 M thiourea, 0.5% 2-mercaptoethanol, 3% nonidet P-40) with 50 μL of protease inhibitor cocktail (Complete mini EDTA-free; Roche Diagnostics GmbH, Mannheim, Germany) by microhomogenizer (Ina optica, Osaka, Japan). The homogenate was centrifuged at 15,000 × g for 20 min, 4 °C and the clear supernatant was subjected to the ZOOM Strip isoelectric focusing (IEF) gel. Total protein concentration of the supernatant was determined with Coomassie Protein Assay Kit (Pierce, Rockford, IL, USA) according to the Bradford method (Bradford 1976). The IEF gel strips (ZOOM STRIP pH 3-10NL, Invitrogen Corp., Carlsbad, CA, USA) were rehydrated at room temperature for 1 h with ca. 30 μg of protein for analytical assay or 150 μg of protein for in-gel digestion by trypsin. After rehydration, IEF was carried out at 175 V for 20 min, followed by voltage ramping to 2,000 V for 45 min, focusing for 30 min, with total focusing for 1,800 Vh. Following IEF, the IPG strips were thawed and incubated for 15 min in 5 mL lithium dodesyl sulfate (LDS) reducing solution containing 1.25 mL NuPAGE LDS Sample Buffer and 0.5 mL NuPAGE Sample Reducing Agent followed by incubation with S-alkylation solution containing 116 mg iodoacetamide and 1.25 mL NuPAGE LDS Sample Buffer for 15 min at room temperature. Finally, the IPG strips and Precision Plus unstained protein standards (Bio-Rad Laboratories, Hercules, CA, USA) were positioned on top of NuPAGE 4-12% Bis–Tris ZOOM Gel (Invitrogen Corp., Carlsbad, CA, USA). Gels were run in the XCell SureLock Mini-cell System (Invitrogen Corp., Carlsbad, CA, USA), at 200 V for 50 min. Following electrophoresis, the gels were stained using the Deep Purple Total Protein Stain (Amersham Biosciences Corp., Piscataway, NJ, USA) according to manufacturer’s instructions. Gel images were acquired using the Typhoon 9200 variable image analyzer (Amersham Biosciences Corp., Piscataway, NJ, USA). The density of protein spots were calculated using Image Quant software (Amersham Biosciences Corp., Piscataway, NJ, USA). The spots were selected randomly with the goal of detecting as many proteins as possible. The electrophoresis was repeated 10 times, the densities of 198 spots on each gel were compared using Student’s t-test, and differentially expressed spots (p < 0.05) were identified.
MALDI-TOF-MS analysis
Preparative electrophoresed gel for in-gel tryptic digestion was fixed in 45% methanol and 10% acetic acid overnight and stained by Coomassie Brilliant Blue R-250. The proteins were washed, dehydrated and digested in situ within the gel with 1 μL of 5 ng trypsin in 50 mM ammonium bicarbonate overnight at 37 °C. The resulting peptides were extracted from the gel matrix with 3 μL of 0.1% trifluoroacetic acid/50% acetonitrile. The gel pieces were extracted again with 3 μL of 0.1% trifluoroacetic acid/50% acetonitrile. The supernatants were combined with the first extraction and the pooled digests were lyophilized and resuspended in 3 μL of 0.1% trifluoroacetic acid. Following peptide extraction, the samples were prepared for MALDI-TOF-MS analysis with a ZipTip C18 (Millipore, Billerica, MA, USA) according to manufacturer’s instructions. The peptides were eluted into 3 μL of 5% acetonitrile in water with 0.1% trifluoroacetic acid and spotted on the Prespotted Anchorchip (Bruker Daltonics Inc., Billerica, MA, USA). The peptide mass spectra analyzed by Auto FLEX MALDI-TOF-MS System (Bruker Daltonics Inc., Billerica, MA, USA) were searched against the National Center for Biotechnology Information (NCBI) nonredundant database using Mascot search engine (Perkins et al. 1999).
Reverse transcription-polymerase chain reaction (RT-PCR)
Cultured HSL cells were washed three times with sterile ice cold phosphate buffered saline (PBS: 137 mM NaCl, 2.7 mM KCl, 10 mM Na2HPO4 · 12H2O, 2 mM KH2PO4). Total RNA was prepared from scraped HSL cells (107 cells) using Micro-to-Midi Total RNA Purification System (Invitrogen Corp., Carlsbad, CA, USA) according to manufacturer’s instruction. HSL cell cDNA was prepared from total RNA 5 μg by ReverTra Ace (TOYOBO Co. Ltd., Osaka, Japan) with oligo (dT)20 (TOYOBO Co. Ltd., Osaka, Japan) as primer. For polymerase chain reaction, 1 μL of cDNA solution was added by 5 μL 2× GoTaq Green Master Mix (Promega Co., Madison, WI, USA), 1 μL of 10 μM forward and reverse primers and 2 μL nuclease free water. PCR was made as below: pre-denaturation 95 °C, 2 min, 30 cycles of denaturation 95 °C, 30 s, annealing 60 °C, 30 s, elongation 72 °C, 3 min, and post-elongation 72 °C, 10 min. The primers used were: ezrin forward; 5′-cagagagtcatggaccagca-3′, ezrin reverse; 5′-cggggtcaacttgtcatctt-3′, prohibitin forward; 5′-ggcatgcctgagtagaccttg-3′, prohibitin reverse; 5′-tcacggttaagagggaatgg-3′, vimentin forward; 5′-agatcgatgtggacgtttcc-3′, vimentin reverse; 5′-cacctgtctccggtattcgt-3′, annexin A3 forward; 5′-ttgatgccaagcaactgaag-3′, annexin A3 reverse; 5′-caggctttcgtctcttccac-3′, glyceraldehyde-3-phosphate dehydrogenase (GAPDH) forward; 5′-ccatcaccatcttccaggag-3′, GAPDH reverse; 5′-cctgctcaccaccttcttg-3′. The primer sequence was selected using “Primer3” software (Rozen and Skaletsky 2000). GAPDH was used as internal control as described before (Miura et al. 2003). Amplified DNAs were separated on 1% agarose gel electrophoresis and stained with 0.5 μg/ml ethidium bromide.
Results and discussion
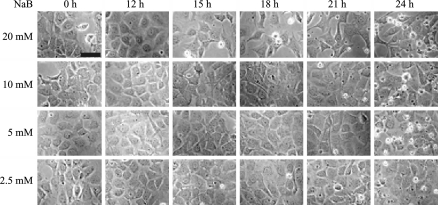
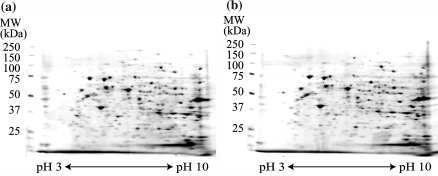
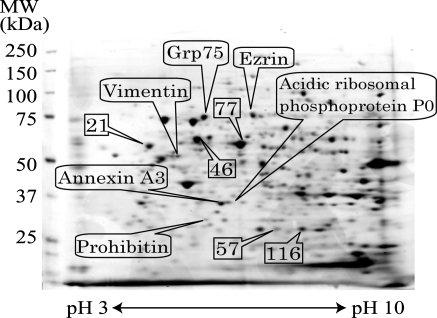
HSL cells proliferated with a cobblestone appearance (Fig. 1) and did not show any changes in shape spontaneously even in long-term culture (Nagai et al. 2002). In this study, HSL cells were used within the 39th passage. Morphological changes occurred in response to 5 mM NaB in some population of cells on dishes, and 20 mM NaB was more effective (Fig. 1). In the following study, HSL cells were incubated with 20 mM NaB for 18 h. To clarify the proteins involved in proliferation of HSL cells, we compared the proteins expressed in HSL cells before and after NaB treatment by 2-DE. At the first glance, quite similar expression patterns with little difference were observed in both samples (Fig. 2). To obtain statistically reliable results, 2-DE was executed 10 times for each sample. We selected 198 spots on the gel, and the spot concentrations were calculated by Image Quant software. Spot concentration was standardized among gels using two ways. One was the ratio of the concentration of one spot to the total spot intensity of selected 198 spots (Fig. 3). The other was the ratio of the concentration of one spot to the randomly selected spot intensity as standard. The numbers of selected spots for standard were 21, 46, 57, 77 and 116 (Fig. 3). Then we obtained 6 different standardized spots intensity data sets. We performed statistical analysis by using Student’s t-test and the spots with statistically different intensity (p < 0.05) using all 6 data sets, were selected. We found 5 proteins up-regulated after NaB treatment and 14 proteins down-regulated after NaB treatment. The down-regulated proteins were the candidate proteins which might have some roles in the HSL cell proliferation. Then those proteins were in-gel digested by trypsin and analyzed by MALDI-TOF-MS. Mascot search identified 6 proteins, namely prohibitin, vimentin, ezrin, annexin A3, acidic ribosomal phosphoprotein P0 and Grp75 (Fig. 3. and Table 1). The other 8 proteins were not able to be identified by Mascot search. We compared the protein spots on 2-DE gels stained by Deep Purple fluorescence dye between control HSL cells extract and NaB treated HSL cells extract, whereas the protein spots on the 2-DE gels for MALDI-TOF-MS analysis were stained by Coomassie Brilliant Blue. The amounts of the 8 proteins were too low even under Deep Purple staining to see under Coomassie Brilliant Blue staining or detect by mass spectrometer.
Fig. 1.
Morphological changes in HSL cells treated with NaB. To subconfluent HSL cells cultured in DMEM, final 2.5, 5, 10 or 20 mM NaB were added and incubated for 0, 12, 15, 18, 21 and 24 h. Cells were observed by phase-contrast microscope. Scale bar is 50 μm. All pictures were the same scale. Significant morphological changes were observed 18 h after 20 mM NaB treatment HSL cells
Fig. 2.
Two-dimensional electrophoresis. Cell extracts prepared from HSL cells (a) or NaB treated HSL cells (b) were separated first by isoelectric focusing on pH gradient between 3 and 10, and then on 4–12% gradient polyacrylamide gel electrophoresis. Proteins were stained by fluorescent dye, Deep Purple, and detected by laser scanner Typhoon 9200 as described in Experimental procedure. The expression patterns were almost the same between control and NaB-treated HSL cells. To obtain statistically reliable results, 2-DE was executed 10 times for each sample
Fig. 3.
Statistically conferred protein spots. To confer expression intensity between control and NaB treated cells statistically, 198 spots were selected randomly. The spots, those intensity were used as standard, were shown as the number. The proteins down-regulated by NaB treatment were identified by Mascot search
Table 1.
The proteins identified by Mascot search
| Spot No. | Gi | Identified protein | Score | Mass | pI | Cover (%) | Matched peptide | Total peptide |
|---|---|---|---|---|---|---|---|---|
| 29 | 62664759 | Prohibitin | 60 | 27,757 | 5.44 | 43 | 9 | 28 |
| 35 | 51980303 | Annexin A3 | 147 | 36,569 | 5.96 | 63 | 21 | 38 |
| 36 | 11693176 | Acidic ribosomal phosphoprotein P0 | 61 | 34,365 | 5.91 | 48 | 10 | 32 |
| 44 | 14389299 | Vimentin | 160 | 53,757 | 5.06 | 64 | 35 | 53 |
| 50 | 1000439 | Grp75 | 85 | 73,984 | 5.87 | 36 | 19 | 35 |
| 79 | 17902245 | Ezrin | 62 | 54,254 | 6.16 | 39 | 19 | 38 |
Gi: Accession number, mass: calculated molecular weight, pI: calculated iso-electric point, total peptide: number of the peptide used to search the data base, matched peptide: number of the peptide contained the hit protein, cover: sequence cover ratio with detected peptide on complete amino acid sequence, score: highest hit score of several Mascot searches
Prohibitin is expressed in wide variety of tissues such as heart, liver and neurons. It has been shown that prohibitin localizes in mitochondrial inner membrane and may play a role in regulating mictochondrial respiration activity and in aging (Rajalingam and Rudol 2005; Mishra et al. 2006). A recent study indicated that prohibitin is required for Raf activation induced by Ras, a downstream signal activated by epidermal growth factor (Rajalingam et al. 2005). It is expected that prohibitin has some role in activating classical mitogen-activated protein (MAP) kinase cascade in intact HSL cells to continuous proliferation. Vimentin is the cell matrix proteins which constructs cell structures (Clarke and Allan 2002; Wangi and Stamenovic 2002). Vimentin is well known as an intermediate filament found in various nonepithelial cells, especially mesenchymal cells. It was also reported that vimentin interacted with a phosphorylated Erk and protected it from dephosphorylation (Perlson et al. 2006). Although another study indicated that in mesenchymal stem cells NaB stimulated Erk phosphorylation (Chen et al. 2007), in HSL cells, NaB down regulates prohibitin and vimentin expression. It is expected that ERK phosphorylation may be decreased or avoided. A precise action of prohibitin and vimentin in HSL cells remains to be elucidated.
Ezrin is thought to be involved in connections of major cytoskeletal structure of the plasma membrane (Bretscher et al. 2002; Gautreau et al. 2002). The expression levels increase in the fetal rat gut epithelium between day 15 and day 20 of gestation and during the first week after birth (Barilá et al. 1995). So ezrin was expected to have some roles in immature stage of HSL cells. Ezrin also serves as a substrate for protein tyrosine kinases and mediates adhesion-mediated events (Srivastava et al. 2005). It is reasonable to suppose that those cell matrix proteins are involved in the alteration of morphology of HSL cells after 18 h culture with NaB (Fig. 1).
Annexin A3 is one of the annexin family proteins that is described as an inhibitor of phospholipase A2, also possesses anti-coagulant properties. However, the biological role of annexin A3 is not totally clear. In the liver, annexin A3 is expressed in isolated small rat hepatocytes, but not in parenchymal hepatocytes. RNA interference study suggested that annexin A3 has a role in DNA synthesis (Niimi et al. 2003).
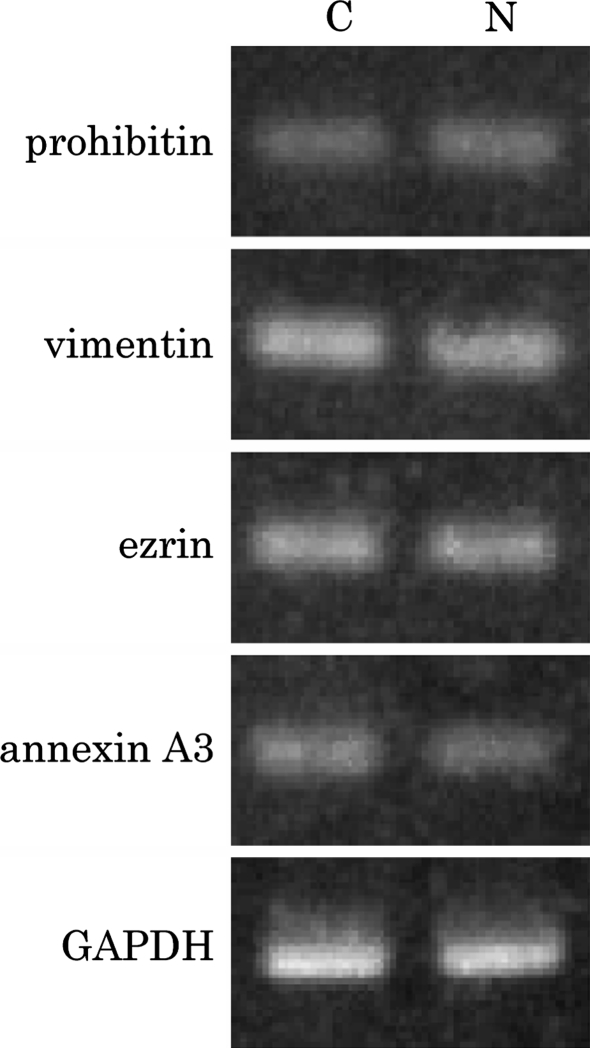
NaB is known as an inhibitor of histone deacetylase that modulates the expression of genes by causing in histone acetylation (Heinz et al. 2002). To confirm whether prohibitin, vimentin, ezrin and annexin A3 expression was regulated transcriptionally, RT-PCR analysis was performed. As shown in Fig. 4, the mRNA expression levels of the proteins selected were not changed 18 h after NaB treatment. Because a slight difference in protein expression level was observed between in the control HSL cells and in the NaB treated HSL cells, mRNA transcription activity did not change dramatically. Other possible mechanisms were those, the protein degradation was stimulated, the expression level of the protein was regulated by translation or the protein was modified by some post-translational modifications.
Fig. 4.
Expression of mRNA for prohibitin, vimentin, ezrin and annexin A3. Total RNAs were extracted from control HSL cells (C) or NaB treated HSL cells (N). RT-PCR data are representative of three separate experiments. The sizes of the amplified bands of prohibitin, vimentin, ezrin and annexin A3 were about 200 bp as expected. The GAPDH mRNA as control was amplified about 550 bp. No significant differences were observed between control and NaB treated HSL cells
Grp75 is known as mitochondrial stress-70 protein belonging to the heat shock protein 70 family (Wadhwa et al. 2002). This is implicated in the control of cell proliferation and cellular aging. High level expression of Grp75 in HSL cells suggested that HSL proliferation is controlled not only under growth signal but also under protection from aging.
Acidic ribosomal phosphoprotein P0 forms a pentameric complex by interaction with dimers of P1 and P2, and constructs ribosomal large subunit. It is suggested that protein synthesis is stimulated in proliferating HSL cells.
In conclusion, our study demonstrates that the proteins regulating the MAP kinase cascade, cytoskeletons, chaperon and protein synthesis system, have some role to continue proliferation of HSL cells without differentiation. These results suggest that the MAP kinase cascade and related pathways are activated continuously in proliferating HSL cells. Further study is required to elucidate how these proteins regulate continuous proliferation of HSL cells.
Open Access
This article is distributed under the terms of the Creative Commons Attribution Noncommercial License which permits any noncommercial use, distribution, and reproduction in any medium, provided the original author(s) and source are credited.
Abbreviations
- HSL
Hepatic stem-like
- NaB
Sodium butyrate
- MALDI-TOF-MS
Matrix-assisted laser desorption/ionization-time of flight mass spectrometry
References
- Barilá D, Murgia C, Nobili F, et al. Transcriptional regulation of the ezrin gene during rat intestinal development and epithelial differentiation. Biochim Biophys Acta. 1995;1263:133–140. doi: 10.1016/0167-4781(95)00090-4. [DOI] [PubMed] [Google Scholar]
- Bradford MM. A rapid and sensitive method for the quantitation of microgram quantities of protein utilizing the principle of protein-dye binding. Anal Biochem. 1976;72:248–254. doi: 10.1016/0003-2697(76)90527-3. [DOI] [PubMed] [Google Scholar]
- Bretscher A, Edwards K, Fehon RG. ERM proteins and merlin: integrators at the cell cortex. Nat Rev Mol Cell Biol. 2002;3:586–599. doi: 10.1038/nrm882. [DOI] [PubMed] [Google Scholar]
- Chen T-H, Chen W-M, Hsu K-H, et al. Sodium butyrate activates ERK to regulate differentiation of mesenchymal stem cells. Biochem Biophys Res Commun. 2007;355:913–918. doi: 10.1016/j.bbrc.2007.02.057. [DOI] [PubMed] [Google Scholar]
- Clarke EJ, Allan V. Intermediate filaments: vimentin moves in. Curr Biol. 2002;12:R596–R598. doi: 10.1016/S0960-9822(02)01102-8. [DOI] [PubMed] [Google Scholar]
- Gautreau A, Louvard D, Arpin M. ERM proteins and NF2 tumor suppressor: the Yin and Yang of cortical actin organization and cell growth signaling. Curr Opin Cell Biol. 2002;14:104–109. doi: 10.1016/S0955-0674(01)00300-3. [DOI] [PubMed] [Google Scholar]
- Heinz S, Krause SW, Gabrielli F, et al. Genomic organization of the human gene HEP27: alternative promoter usage in HepG2 cells and monocyte-derived dendritic cells. Genomics. 2002;79(4):608–615. doi: 10.1006/geno.2002.6743. [DOI] [PubMed] [Google Scholar]
- Iwai M, Tanaka S, Mori T, et al. Investigation of parenchymal cell differentiation in organotypic slice culture of mouse fetal liver under administration of sodium butyrate. Cell Biol Toxicol. 2002;18(3):147–156. doi: 10.1023/A:1015500219572. [DOI] [PubMed] [Google Scholar]
- Mishra S, Murphy LC, Murphy LJ. The prohibitins: emerging roles in diverse functions. J Cell Mol Med. 2006;10:353–363. doi: 10.1111/j.1582-4934.2006.tb00404.x. [DOI] [PMC free article] [PubMed] [Google Scholar]
- Miura K, Nagai H, Ueno Y, et al. Epimorphin is involved in differentiation of rat hepatic stem-like cells through cell–cell contact. Biochem Biophys Res Commun. 2003;311:415–423. doi: 10.1016/j.bbrc.2003.09.225. [DOI] [PubMed] [Google Scholar]
- Nagai H, Terada K, Watanabe G, et al. Differentiation of liver epithelial (stem-like) cells into hepatocytes induced by coculture with hepatic stellate cells. Biochem Biophys Res Commun. 2002;293:1420–1425. doi: 10.1016/S0006-291X(02)00406-0. [DOI] [PubMed] [Google Scholar]
- Niimi S, Oshizawa T, Yamaguchi T, et al. Specific expression of annexin III in rat-small-hepatocytes. Biochem Biophys Res Commun. 2003;300:770–774. doi: 10.1016/S0006-291X(02)02911-X. [DOI] [PubMed] [Google Scholar]
- Perkins DN, Pappin DJC, Creasy DM, et al. Probability-based protein identification by searching sequence databases using mass spectrometry data. Electrophoresis. 1999;20(18):3551–3567. doi: 10.1002/(SICI)1522-2683(19991201)20:18<3551::AID-ELPS3551>3.0.CO;2-2. [DOI] [PubMed] [Google Scholar]
- Perlson E, Michaelevski I, Kowalsman N, et al. Vimentin binding to phosphorylated Erk sterically hinders enzymatic dephosphorylation of the kinase. J Mol Biol. 2006;364(5):938–944. doi: 10.1016/j.jmb.2006.09.056. [DOI] [PubMed] [Google Scholar]
- Rajalingam K, Rudel T. Ras–Raf signaling needs prohibitin. Cell Cycle. 2005;4:1503–1505. doi: 10.4161/cc.4.11.2142. [DOI] [PubMed] [Google Scholar]
- Rajalingam K, Wunder C, Brinkmann V, et al. Prohibitin is required for Ras-induced Raf–MEK–ERK activation and epithelial cell migration. Nat Cell Biol. 2005;7:837–843. doi: 10.1038/ncb1283. [DOI] [PubMed] [Google Scholar]
- Rambhatla L, Chiu CP, Kundu P, et al. Generation of hepatocyte-like cells from human embryonic stem cells. Cell Transplant. 2003;12(1):1–11. doi: 10.3727/000000003783985179. [DOI] [PubMed] [Google Scholar]
- Rozen S, Skaletsky HJ. Primer3 on the WWW for general users and for biologist programmers. In: Krawetz S, Misener S, editors. Bioinformatics methods and protocols. Methods in Molecular Biology. Totowa New Jersey: Humana Press; 2000. pp. 365–386. [DOI] [PubMed] [Google Scholar]
- Sharma NS, Shikhanovich R, Schloss R, et al. Sodium butyrate-treated embryonic stem cells yield hepatocyte-like cells expressing a glycolytic phenotype. Biotechnol Bioeng. 2006;94(6):1053–1063. doi: 10.1002/bit.20936. [DOI] [PubMed] [Google Scholar]
- Srivastava J, Elliott BE, Louvard D, et al. Src-dependent ezrin phosphorylation in adhesion-mediated signaling. Mol Biol Cell. 2005;16(3):1481–1490. doi: 10.1091/mbc.E04-08-0721. [DOI] [PMC free article] [PubMed] [Google Scholar]
- Wadhwa R, Taira K, Kaul SC. An Hsp70 family chaperone, mortalin/mthsp70/PBP74/Grp75: what, when, and where? Cell Stress Chaperone. 2002;7:309–316. doi: 10.1379/1466-1268(2002)007<0309:AHFCMM>2.0.CO;2. [DOI] [PMC free article] [PubMed] [Google Scholar]
- Wangi N, Stamenovic D. Mechanics of vimentin intermediate filaments. J Muscle Res Cell Motil. 2002;23:535–540. doi: 10.1023/A:1023470709071. [DOI] [PubMed] [Google Scholar]
- Yamada S, Terada K, Ueno Y, et al. Differentiation of adult hepatic stem-like cells into pancreatic endocrine cells. Cell Transplant. 2005;14(9):647–653. doi: 10.3727/000000005783982738. [DOI] [PubMed] [Google Scholar]
- Zhou QJ, Xiang LX, Shao JZ, et al. In vitro differentiation of hepatic progenitor cells from mouse embryonic stem cells induced by sodium butyrate. J Cell Biochem. 2007;100(1):29–42. doi: 10.1002/jcb.20970. [DOI] [PubMed] [Google Scholar]


