

Abstract
Recent proteomic applications have demonstrated their potential for revealing the molecular mechanisms underlying neurodegeneration. The present study quantifies cerebellar protein changes in mice that are deficient in plasma membrane calcium ATPase 2 (PMCA2), an essential neuronal pump that extrudes calcium from cells and is abundantly expressed in Purkinje neurons. PMCA2-null mice display motor dyscoordination and unsteady gait deficits observed in neurological diseases such as multiple sclerosis and ataxia. We optimized an amine-specific isobaric tags (iTRAQ™)-based shotgun proteomics workflow for this study. This workflow took consideration of analytical variance as a function of ion signal intensity and employed biological repeats to aid noise reduction. Even with stringent protein identification criteria, we could reliably quantify nearly 1000 proteins, including many neuronal proteins that are important for synaptic function. We identified 21 proteins that were differentially expressed in PMCA2-null mice. These proteins are involved in calcium homeostasis, cell structure and chromosome organization. Our findings shed light on the molecular changes that underlie the neurological deficits observed in PMCA2-null mice. The optimized workflow presented here will be valuable for others who plan to implement the iTRAQ method.
Keywords: Cerebellum, iTRAQ, LC, MS/MS, Neuronal dysfunction
1 Introduction
Proteomics technologies have enabled the identification of key proteins involved in CNS function and neurodegeneration [1, 2]. Delineation of proteomic changes may be important for understanding CNS dysfunction. For example, impaired motor coordination has been associated with altered cerebellar expression of calbindin, septin 5 and syntaxin binding protein 1 [3]. In addition, alterations in mitogen-activated protein kinases have been implicated in the pathogenic events leading to schizophrenia [4]. However, one of the biggest challenges for the effective application of proteomics is to develop optimized methods that allow comparison of a large number of unique proteins under given experimental conditions. The difficulty in this stems from the wide range of protein concentrations and structural heterogeneity. Until recently, most proteomics analyses have been performed using 2-DE followed by MS-based protein identification. Published CNS studies utilizing 2-DE reported the identification of nearly 500 proteins either from mouse or human brain [5, 6]. In addition, 148, 165 and 38 proteins have been identified in rat hippocampus [7], human hippocampus [8] and pituitary [9], respectively. Although 2-DE has been effective for identifying new proteins and their PTMs, technical limitations confine its application to relatively abundant proteins. Moreover, it has been well documented that 2-DE fails to detect proteins of low abundance, high hydrophobicity, extreme pI or high Mr [10–12].
Alternatively, LC coupled with MS/MS-based methods is more effective at expanding the proteome coverage. For example, the “shotgun” approach developed by Yates et al. [13] has been proven rather effective for comprehensive proteomics studies [14]. In this approach, a protein mixture is digested into peptides, which are then separated by 2-D LC. The fractionated peptides are then identified by MS/MS. Since the analysis is performed on peptides instead of proteins, the shotgun approach can overcome the limitations of 2-DE when proteins with a wide range of pI, Mr or hydrophobicity are studied. Nielsen et al. [15] investigated the mouse plasma membrane proteome using this approach and defined 862 and 1685 proteins in the brain and hippocampus, respectively. Recently, a new isobaric iTRAQ™ (Applied biosystems Fostercity, CA, USA) technology has been developed for quantitative shotgun proteomics. This method facilitates a multiplexed comparison of proteins from up to four samples in a single experiment [16]. The labeling reagents consist of a quantification group (N-methylpiperazine), a balance group (carbonyl), and a hydroxyl succinimide ester group that reacts with primary amines (i.e., N-termini and/or lysine side chains). Peptide quantification is based on the relative abundance of the four reporter ions, m/z 114, 115, 116 and 117 produced following MS/MS fragmentation of isobaric iTRAQ-labeled peptide mixture. These peptides share similar chromatographic properties, allowing both peptide identification and quantification to be derived from the same MS/MS spectrum. iTRAQ chemistry offers more convenient multiplexed quantification over other shotgun approaches that require stringent reproducibility between chromatographic runs. Successful applications of this new technique have been reported in studies involving E. coli [17], yeast [16] and transformed mammalian cell lines [18]. It has also been used to analyze cellular organelle proteomes [19], endogenous human saliva peptides [20], cancer biomarkers [21] as well as phosphoproteomes [22]. However, its application for complex CNS studies has yet to be determined.
In this study, we evaluated iTRAQ peptide labeling efficiency, the relationship between ion signal intensity and quantification variance, as well as the impact on experimental noise reduction from biological sample replication. With this knowledge, we developed an optimized workflow for analyzing the cerebella of mice deficient in plasma membrane calcium ATPase 2 (PMCA2). We focused on the cerebellum because these mice exhibit strong neurological deficits attributable to partially cerebellar dysfunction including ataxia, dyscoordination of movement, abnormal gait and loss of balance [23]. As PMCA2 is abundantly expressed in Purkinje cells, it may play unique and selective roles in cerebellar function [24]. Therefore, we hypothesized that the delineation of proteomic changes in PMCA2-null mice could provide insights into the molecular changes that underlie cerebellar dysfunction. We demonstrated that the isobaric iTRAQ method could reveal significantly broader cerebellar proteome coverage than was previously reported from 2-DE studies. Consequently, we were able to quantify important changes in CNS proteins, which might contribute to neuronal pathology. Our results indicated alterations of proteins involved in calcium homeostasis and signaling, chromosomal organization and metabolism.
Since the iTRAQ approach can survey many more proteins than 2-DE, the technical issues associated with this high-throughput analysis of complex biological samples need to be addressed (see review in [25]). The optimized workflow outlined in this report addressed issues in experimental design, peptide labeling and identification efficiency, quantification accuracy and data analysis. This workflow will provide some insight for others who plan to employ this technology.
2 Materials and methods
2.1 Chemicals and reagents
HPLC-grade ACN, methanol and water were supplied by J. T. Baker (Phillipsburg, NJ, USA). Trypsin was purchased from Promega (Madison, WI, USA). Highest purity grade CHCA, TFA, HEPES and protease inhibitor cocktail (PIC) were purchased from Sigma-Aldrich (St. Louis, MO, USA). Synthetic peptides, bradykinin, glu-fibrinopeptide (GFP), and ACTH 18–39 were purchased from AnaSpec (San Jose, CA, USA). iTRAQ reagents were obtained from Applied Biosystems (ABI, Foster City, CA, USA).
2.2 Assessment of iTRAQ quantification accuracy
Three model peptides (bradykinin, GFP, and ACTH 18–39) were used to examine quantification accuracy. Two test samples containing the three peptides were labeled with iTRAQ 117 and 114 reagents based on the manufacturer’s protocol (ABI, Applied Biosystems iTRAQ™ Reagents Chemistry Reference Guide, 2004, http://docs.appliedbiosystems.com/pebiodocs/04351918.pdf). Labeled peptides were mixed together to give a 117/114 ratio of 2:1 at a combined final concentration of 5 pmol/μL for each peptide. Subsequently, the following concentration series was prepared by diluting the stock solution 1:2, 1:4, 1:8, 1:16, 1:32, 1:64, 1:128, 1:256, 1:512 and 1:1024 times. Three microliters of each peptide solution was mixed with 2 μL of CHCA and spotted in triplicate onto a MALDI plate. MS/MS spectra were acquired with five repeats for statistical evaluation.
2.3 Tissue collection, protein extraction and iTRAQ labeling
All experiments and procedures were conducted under the instructions of Institutional Animal Care and Use Committee-approved protocols. PMCA2−/−and PMCA2+/+ mice were described previously [26]. For method optimization, normal C57BL/6 mice were used. Mice were anesthetized and perfused at room temperature with 0.9% NaCl, followed by PBS, pH 7.5. The cerebella were dissected and stored at −80°C until analysis. The tissues were disrupted using intermittent sonication on ice in 20 vol of homogenization buffer (25 mM triethylammonium bicarbonate, TEAB, 20 mM Na2CO3, 2 μL PIC, and pH 10.0). The extracts were incubated on an orbital shaker for 1 h prior to centrifugation at 19 000 × g for 30 min at 4°C. The supernatants were collected and adjusted to pH 8.0 with HEPES. Protein concentrations were brought to 2.0 mg/mL as determined by the Bradford assay. Eighty micrograms of each sample was adjusted to 45 μL with 20 mM TEAB. The proteins were (i) denatured in 0.05% SDS w/v, (ii) reduced with 1.5 mM Tris-(2-carboxyethyl)phosphine at 60°C for 1 h, (iii) alkylated with 5 mM methyl methane thiosulfonate (MMTS) at room temperature for 10 min, (iv) digested with 8 μg trypsin at 37°C for 16 h and (v) labeled with the iTRAQ reagents according to the manufacturer’s protocol (ABI, Applied Biosystems iTRAQ™ Reagents Chemistry Reference Guide, 2004, http://docs.appliedbiosystems.com/pebiodocs/04351918.pdf ). Peptides from two PMCA2+/+ mice were labeled with iTRAQ tags 114 and 115, while the peptides from two PMCA2−/− mice were labeled with tags 116 and 117. Excess reagents were quenched by adding 300 μL of water and incubated for 30 min. The four samples were then mixed together, dried in a speedvac, and washed twice with 100 μL of water to remove any residual reagent.
2.4 Strong cation exchange (SCX) chromatography
The iTRAQ-labeled peptides were suspended in 0.5 mL of mobile phase A containing 10 mM KH2PO4 and 20% ACN (pH 3.0). They were separated on a BioCAD™ Perfusion Chromatography System (ABI) equipped with a polysulfoethyl A column (4 × 200 mm, 5 μm, 300 Å, Poly LC, Columbia, MD, USA), plus an upstream guard column (4 × 10 mm). The composition of mobile phase B was 600 mM KCl, 10 mM KH2PO4 and 20% ACN (pH 3.0). The column was first washed isocratically with mobile phase A for 10 min at 1.0 mL/min to remove unbound materials. Retained peptides were then eluted with a 40-min linear gradient from 0 to 50% B, followed by a 10-min linear gradient from 50 to 100% B, at a flow rate of 0.25 mL/min. Fifteen fractions were collected, desalted via PepClean™ C18 spin columns (Pierce, Rockford, IL, USA) and dried in a speedvac.
2.5 RPLC and MS/MS
Peptides in each SCX fraction were further separated on an Ultimate™ Chromatography System equipped with a Probot MALDI spotting device (Dionex, Sunnyvale, CA, USA). Peptides were resuspended in 10 μL of solvent A (5% ACN, 0.1% TFA), then loaded onto a 0.3 × 5-mm PepMap C18 trap column. They were resolved on a capillary PepMap column (0.1 × 150 mm, 3 μm, 100 Å, C18, Dionex) with a 70-min gradient of solvent A and solvent B (95% ACN, 0.1% TFA): from 0 to 4 min, 5 to 8% B; at 34 min, to 18% B; at 57 min, to 35% B; and at 64 min, to 95% B. The RPLC eluent was mixed in a 1:3 ratio with MALDI matrix (7 mg/mL CHCA in 60% ACN, 5 mM ammonium monobasic phosphate and internal calibrants, 50 fmol/μL each of GFP and ACTH 18–39) through a 30-nL mixing tee, and spotted onto MALDI plates in an 18×18 spot array format. The peptides were analyzed on a 4700 Proteomics Analyzer (ABI) in a plate-wide data-dependent fashion. Default calibrations in MS and MS/MS modes were updated daily and the deflector voltages (X1, Y1, X2 and Y2) were optimized weekly for optimal sensitivity. Metastable ion suppressor and the timed-ion-selector (TIS) were also optimized for the most precise precursor ion selections possible. TIS resolution was set at 200, which corresponded to ±5 Da at m/z of 1000. All positive ion MS/MS data were acquired using 1 keV collision energy. First, MS spectra were recorded for all 324 spots on each MALDI plate. Each spectrum was generated in the mass range of 850–3500 amu by averaging 1500 laser shots. MS ions that met the precursor selection criteria (200 ppm spot-to-spot precursor exclusion, S/N ratio >25 and a maximum of ten most abundant precursors per spot) were selected for subsequent MS/MS analyses, starting from the weakest to the strongest ion. MS/MS spectra were acquired with 4000 laser shots and smoothed with the Savitsky–Golay algorithm (FWHM = 9, polynomial order = 4).
2.6 MS data analysis and protein identification
Peptide identification was performed by searching the MS/MS spectra against the Swiss-Prot database (v46), using a local MASCOT search engine (v1.9) on a GPS server (v3.5, ABI). MS/MS peaks were filtered to exclude both the iTRAQ reporter ions and ions with S/N ratios <10. The following parameters were used for the search: trypsin with maximum one missed cleavage was selected; precursor mass tolerance was set at 50 ppm; MS/MS mass tolerance was set at 0.3 Da; iTRAQ-labeled N-termini and lysines as well as MMTS-labeled cysteines were set as fixed modifications unless described otherwise; oxidized methionines and iTRAQ-labeled tyrosines were set as variable modifications; mouse was chosen as the source of the proteins. The MASCOT-matched peptides included for protein identification and quantification analysis met the following criteria: (i) confidence interval (C.I.) values were no less than 95%; (ii) each peptide was assigned to only one protein and (iii) the peptide was not a partial sequence of another identified peptide. In addition, each identified protein contained at least two such peptides.
2.7 Protein quantification and statistical analysis
Peptide quantification: The reporter ion (m/z 114–117) peak areas (RPAs) were extracted from raw spectra using the GPS software (ABI). These values were corrected for isotopic carryover by version 3.5 of the GPS software. The RPAs were then normalized using Microsoft Excel based on the population median for each sample, assuming overall protein concentrations were comparable. The resulting dataset containing all four iTRAQ RPAs is later referred to as the “PMCA2 dataset” in Section 3. The expression ratio of each peptide was computed as the average of PMCA2−/− RPAs (m/z 117 and 116) relative to the average of the two PMCA2+/+ measurements (m/z 114 and 115). When there were multiple MS/MS spectra matched to identical peptides, a single peptide ratio was calculated with the contribution of each spectrum weighted proportionally to the average RPA of all four iTRAQ ions. The ratios were transformed into 2-based log values for subsequent analysis.
Protein expression analysis: We chose to only analyze proteins containing at least two matched peptides to reduce false positives. The protein expression ratios and SDs were computed as the average of all corresponding peptides whose average RPAs were larger than 5000 (see Section 3 for explanation). The population mean (Meanp) and SDp of all identified protein were computed.
Statistical analysis: Individual protein expression ratios from each of the four mice were calculated based on RPAs of m/z 117, 116, 115, and 114 relative to RPA of m/z 114. A p-value was produced via the Student’s t-test for each protein by comparing the two PMCA2−/− with the two PMCA+/+ values. The proteins that were classified as significantly changed had p-values less than or equal to 0.05 and with an absolute expression ratio that fell at least one SDp outside of Meanp (see Section 3 for explanation). In-house Perl scripts were written to automate all the calculations mentioned. Furthermore, we manually eliminated selected proteins that were probably a result of experimental artifacts of incomplete blood perfusion (see Section 3 for eliminated proteins and explanation).
2.8 Bioinformatics and protein functional analysis
Protein Mr and pI values were computed using the Emboss (v2.7.1) pepstats program [27], and Grand Average of Hydropathy (GRAVY) values were calculated as the sum of hydropathy values [28] of all amino acids, divided by the number of residues in the peptide, using an in-house Perl script. The Gene Ontology (GO) [29] protein functional classification was performed with Database for Annotation, Visualization and Integrated Discovery (DAVID) tools (v2.1, http://david.abcc.ncifcrf.gov/) [30]. M-A plots were performed with Spotfire DecisionSite 8.1.1 (Spotfire, Somerville, MA, USA). All statistical computations (including the hypergeometric tests) and all other plottings were performed with statistics package R, unless mentioned otherwise (v2.0, http://www.r-project.org/).
2.9 Western blotting
PMCA2 +/+ and PMCA2−/− mice were sacrificed by exposure to CO2. Cerebella were dissected out and homogenized on ice in eppendorf tubes using a motorized pestle in 200 μL lysis buffer containing 100 mM HEPES (pH 8.0), 150 mM sodium chloride, 0.02% sodium azide, 0.1% SDS, 1% IgepalCA 630, 0.5% deoxycholic acid, 0.2 mM phenylmethylsulfonyl fluoride, 2 g/mL aprotinin, 2 μg/mL leupeptin, 2 μg/mL pepstatin, and 50 mM sodium fluoride. The homogenate was mixed by vortexing for 15–30 s and kept on ice for 15 s. This procedure was repeated four times after which the homogenate was sonicated in an ultrasonic bath for 15 s, at lowest frequency, placed on ice for 30 min and centrifuged at 14 000 × g for 20 min at 4°C. The supernatant was collected and aliquots were stored at −80°C until use. Total protein concentrations were determined via BCA assay (Pierce). Proteins from three cerebella of PMCA2−/− mice were compared with those from three PMCA2+/+ mice. Ten micrograms of proteins obtained from individual cerebellum was loaded onto a 4–20% Novex Tris-glycine gel (Invitrogen, Carlsbad, CA, USA). Denaturing electrophoresis was performed for 90 min at 125 V. The proteins were then transferred onto a PVDF membrane for 90 min at 25 V. Adequate transfer of proteins onto PVDF membranes was ascertained by staining with BLOT-FastStain (Chemicon, Temecula, CA, USA). The membranes were scanned and total protein loaded on each lane was quantified by use of Un-Scan-It software (Silk Scientific, Orem, UT, USA). The membranes were probed with primary antibody (Calbindin: Chemicon, Temecula, CA, USA, 1:10,000 dilution). Chemiluminescent immunodetection was employed using a Western Breeze kit (Invitrogen). Signal was visualized by exposure of membranes to Hyperfilm ECL (GE Healthcare, Piscataway, NJ, USA) or by use of EpiChemi3 Darkroom Imaging System (UVP Bioimaging Systems, Upland, CA, USA). Band densities were quantified using the Un-Scan-It software (Silk Scientific) and normalized relative to total protein to compensate for experimental variations. Student’s t-test was performed in MS-Excel to generate p-values for the testing protein.
3 Results and discussion
3.1 Quantification accuracy is iTRAQ ion intensity-dependent
Prior to the PMCA2-null study, we designed an experiment to assess quantification accuracy. A mixture containing three peptides was labeled with iTRAQ tags 114 and 117 and combined in a 1:2 ratio. Serial dilutions of this mixture were made to cover a wide range of peptide concentrations from 5 fmol/μL to 5 pmol/μL. As a result, MS/MS measurements for iTRAQ reporter ion area (RPAs) varied by several orders of magnitude. Not surprisingly, variance for peak area measurements decreased as RPAs increased. Less than 20% CV was achieved consistently at above 5000 RPAs (vertical lines in Fig. 1A).
Figure 1.
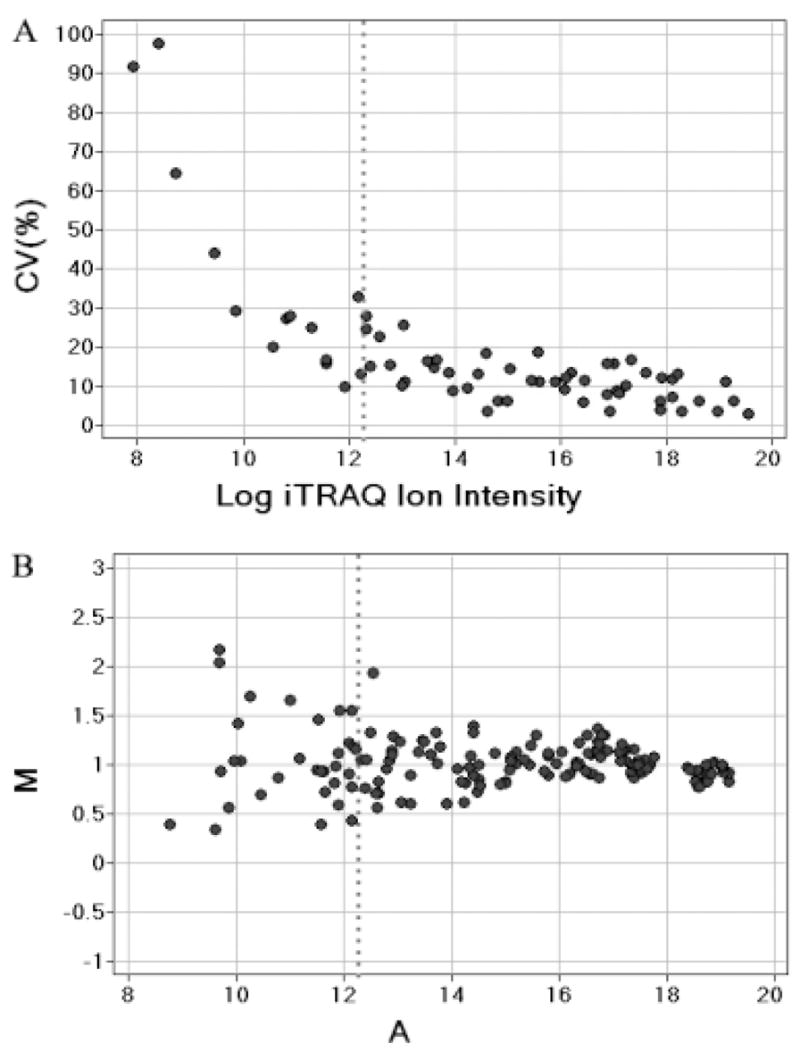
Assessment of iTRAQ quantification accuracy. A peptide mixture containing iTRAQ-labeled bradykinin, glu-fibrinopeptide, and ACTH 18–39 were mixed to give a 117/114 ratio of 2 at combined final concentration of 5 pmol/μL for each peptide. Serial dilutions of this solution (1:2, 1:4, 1:8, 1:16, 1:32, 1:64, 1:128, 1:256, 1:512, and 1:1024) were analyzed by ABI 4700 MALDI-TOF-TOF MS. Spectra were acquired with five repeats for statistical evaluation. (A) The CV of the iTRAQ reporter ion peak area (RPA) versus log iTRAQ ion intensity plot. The CV values were computed as the percentage SDs from the mean of all five measurements. (B) The M-A plot of log iTRAQ 117/114 ratios versus their average log RPAs. The theoretical ratio was 2 (log value of 1 on the y-axis). M = log2(RPA117/RPA114); A = [log2(RPA114)1log2(RPA117)]/2. The vertical dotted lines represent RPA values of 5000. Two-based log was used for all calculations.
Since the peptide expression changes were calculated as the iTRAQ RPA ratios, large RPA measurement variance would inevitably lead to highly variable quantification results. To assess the extent of this effect, we adopted the M-A plot, commonly used in microarray analysis [31], to evaluate the impact of ion signal intensities on peptide quantification accuracy. In this plot, M = log2(RPA117/RPA114) and A = [log2(RPA114) + log2(RPA117)]/2; thus, M was a measure of peptide expression ratio distribution and A was a measure of average reporter ion intensity. According to the M-A plot, the peptide expression accuracy was also ion intensity-dependent (Fig. 1B). The most significant deviations of the measured 117/114 ratios from the expected value of 2 were observed below 5000 RPAs (vertical line in Fig. 1B).
The inverse correlation between ion measurement CV and iTRAQ RPAs could be explained by counting statistics. Since the detection systems used in a TOF instrument count a number of events over the duration of the measurement, the data exhibit a statistical fluctuation described by the Poisson probability distribution. Consequently, the ion measurement will be proportional to an inverse square root of mean RPA values (Gedcke, D. A., ORTEC Application Note AN59 2001, http://www.ortec-online.com/application-notes/an59.pdf)[32]. Our experimental data followed this general trend. It should also be noted that the dependence of quantification accuracy on signal intensity is not specific to iTRAQ analysis. Isotope coded affinity tag (ICAT) [33], LC/MS [34] and microarray [35, 36] quantification measurements all share similar features. Thus, in order to obtain more accurate peptide expression ratios, we decided to filter out measurements less than 5000 RPAs.
3.2 Quantification accuracy can be improved with experimental repeats
Similar ion intensity-dependent effects could also be observed from the PMCA2 dataset. The M-A plots showed a similar ion intensity-dependent expression ratio distribution as seen for the test peptides (Fig. 2). When peptides from mice with similar genotypes were compared, the variance appeared to decrease at above 5000 RPAs (vertical dotted lines in Fig. 2A and B). As expected, the biological variation of PMCA2+/+ versus PMCA2−/− was larger when compared with mice of similar genotypes, especially when average RPAs rose above 5000 (compare Fig. 2C with 2A and 2B). By comparison, when the averaged values from each replicated group were analyzed, the variance was significantly reduced, even for RPAs below 5000 counts (Fig. 2D). This observation reflected the fact that repeats of biological samples can “average” out the analytical noise significantly; repeats are widely used in microarray experiment design and data analysis (see review [37]).
Figure 2.

Assessment of quantification variance in the PMCA2 dataset. The M-A plot of log peptide expression ratio versus the average log RPAs. (A) PMCA2+/+#2 vs. PMCA2+/+#1 (iTRAQ 115 to 114); M = log2(RPA115/RPA114); A = [log2(RPA114) + log2(RPA115)]/2. (B) PMCA2−/−#2 vs. PMCA2−/−#1 (iTRAQ 117 to 116); M = log2(RPA117/RPA116); A = [log2(RPA116) + log2(RPA117)]/2; (C) PMCA2−/−#1 vs. PMCA2+/+#2 (iTRAQ 116 to 115); M = log2(RPA116/RPA115); A = [log2(RPA115) + log2(RPA116)]/2; (D) Average of the two PMCA2−/− signals vs. that of the two PMCA2+/+ signals; M = log2[(RPA116 + RPA117)/(RPA114 + RPA115)]; A = {log2[(RPA114 + RPA115)/2] + log2[(RPA116 + RPA117)/2]}/2; The vertical dotted lines represent RPA values of 5000. Two-based log was used for all calculations.
Overall, the M-A plots were symmetrical across the ion intensity range, suggesting even labeling efficiencies among all four iTRAQ reagents. Consequently, additional procedures like flip dye experiments or lowess data normalization routines used in cDNA microarray analysis [31] to ease dye labeling bias appeared unnecessary. This could be due to the chemical stability and labeling efficiency of iTRAQ reagents, although lot-to-lot consistency has to be evaluated. For both microarray and DIGE analysis, light- and ozone-sensitive fluorescent dyes are used for labeling. Consequently, even if manufacturing quality control processes are well maintained, experimental artifacts can be introduced simply due to small variations of the laboratory environments [36, 38]. Therefore, flip dye experiments or lowess data normalization are commonly performed to compensate such sample handling artifacts.
Based on these findings, we filtered out peptides with less than 5000 average RPAs in the PMCA2 workflow. In addition, each peptide expression ratio was computed as the average of the two PMCA2−/− measurements (m/z 117 and 116) over that of the two control samples (m/z 114 and 115). This workflow could be improved further by incorporating a noise model analysis with comprehensive statistical routines, as described for microarray analysis [36, 37]. However, in order to build an accurate noise model, many more experiments have to be conducted to generate suitable data-sets. Considering the instrumentation and financial resource requirements of conducting iTRAQ experiments, only collaborations among many laboratories could achieve this goal.
3.3 Quantification accuracy affected by hardware limitations
In addition to low intensities of ion signals, other biological or technical factors can also contribute to measurement inaccuracy. For example, biological variations could originate from unstable phenotype expression from transgenic or gene knockout animals. Moreover, animal handling, analytical processes and sample complexity will significantly affect the quantitative outcome as well. Here we demonstrate an example of quantification errors introduced by hardware limitations. Despite our best efforts by performing 2-D LC separations to simplify the peptide content of each MALDI spot, it is not unusual to have two peptides with masses close to each other on the same sample spot. Inaccurate iTRAQ quantification can occur if the MS is unable to exclusively fragment selected ions. Our ABI 4700 TOF-TOF MS utilizes a TIS window at a maximal resolution of 200 (±5 Da at m/z 1000). For precursor ion selection, this relatively wide TIS window can potentially result in a “leak” with closely situated precursor co-selected for fragmentation. This adds uncertainties in peptide identification and more importantly produces unreliable quantification ratios. These ratios are weighted averages for the iTRAQ ions produced by MS/MS of all ions falling within the TIS window. Figure 3 illustrates this phenomenon. From the PMCA2-null experiment, LC-MALDI software selected a precursor ion of m/z 1176.68 from spot 52 for subsequent MS/MS analysis at an apex of its chromatographic elution. With the narrowest TIS window of 200 used in this work, peptide ions with m/z 1170.8 to 1182.6 were co-selected for fragmentation. Manual interpretation of the experimental data showed the multiplexed nature of the resulting spectrum from the combined fragmentation of both AAVSGLWGK (m/z 1176.68) from hemoglobin beta subunit and VCLLHEK (m/z 1175.65) from serum albumin (Fig. 3A and B). The resulting combined peptide expression ratio was 0.37 (PMCA2−/− vs PMCA2+/+ in Fig. 3A). Accurate iTRAQ ratios can be determined only when a single parent ion is selected for MS/MS. For example, when only m/z 1176.68 was selected for MS/MS from the MALDI spot 51 in which m/z 1175.65 was not observed, the resulting peptide expression ratio was 0.10 (Fig. 3C and D), which is likely to reflect the “actual” expression change of the peptide AAVSGLWGK.
Figure 3.

Quantification errors resulted from co-fragmentation of ions (A and B) MS/MS spectra of m/z 1176.68 selected in spot 52, which contained both AAVSGLWGK (with N-terminal and lysine iTRAQ labels) and VCLLHEK (with N-terminal, lysine iTRAQ labels and MMTS label on cysteine); (A) Expanded view of iTRAQ quantification region reflected the combined expression changes of both peptides; (B) The assignment of MS/MS ions to peptides AAVSGLWGK and VCLLHEK (underlined); B>(C and D) MS/MS spectra of m/z 1176.68 selected from spot 51, which contained only AAVSGLWGK(with N-terminal and lysine iTRAQ labels); (C) Expanded view of iTRAQ quantification region reflected the expression change of AAVSGLWGK; and (D) the assignment of MS/MS ions to peptide AAVSGLWGK.
When implementing iTRAQ for complex sample analysis, an efficient 2-D LC routine is crucial for reducing peptide complexity prior to MS/MS analysis. Moreover, using a MS with more precise precursor selection capability could help to alleviate this issue.
3.4 Efficient peptide labeling and confident protein identification
To further characterize the iTRAQ workflow, mouse cerebellar protein extracts were subjected to the iTRAQ procedure. Protein extracts were digested with trypsin and labeled with iTRAQ reagents. The labeled peptides were separated by SCX and RPLC, and then analyzed by MALDI-TOF/TOF MS to identify and quantify the peptides. Over 27 000 spectra were collected in over 300 h of MS/MS data acquisition. A MASCOT search against mouse proteins in the Swiss-Prot database led to the identification of 5457 peptides (C.I. >=95%) from 953 proteins (Supplementary Table 1). When the spectra were searched against the Swiss-Prot database allowing for optional N-terminal iTRAQ labeling, less than 0.8% of the identified peptides (with C.I. values >95%) were not labeled. This indicates that iTRAQ labeling was efficient. As a measure of protein identification accuracy of this workflow, all spectra were searched against a decoy Swiss-Prot database containing mouse proteins with reversed sequences. This procedure led to the identification of only 24 peptides from 12 proteins. Since the estimated false protein discovery rate was only 2.49% (calculation according to Peng et al. [39]), we concluded that the protein identification criteria used for this study were sufficiently stringent to allow for confident protein identification.
3.5 Effective CNS proteome coverage with current workflow
We evaluated whether the current approach had any bias towards analyzing proteins of particular characteristics. The pI, Mr and hydrophobicity (GRAVY) values of the identified proteins were compared with all 8880 mouse proteins annotated in the Swiss-Prot database. The distributions of the Mr and the hydrophobicity of identified proteins (dashed lines in Fig. 4A and B) were similar to those of the mouse proteome (solid lines in Fig. 4A and B), suggesting that our workflow was not biased over protein hydrophobicity or size. In Fig. 4C, the pI of the total mouse proteome showed a similar trimodal distribution observed by Schwartz et al. [40], with cytosolic proteins clustering at around pI of 5.0 and primarily integral membrane proteins at around pI of 9.0. By comparison, the cerebellar proteins identified in this study showed a higher acidic peak and lower basic peak, indicating the enrichment of cytosolic proteins. This phenomenon can be explained by the bias towards soluble proteins inherent in the protein extraction procedure, and does not necessarily reflect analytical limitations. Despite this bias, we identified many known membrane proteins, including neuro-transmitter receptors (Table 1).
Figure 4.

Property comparisons between identified mouse cerebellar proteins and all mouse proteins annotated in the Swiss-Prot database. (A) Mr, (B) hydrophobicity (GRAVY) and (C) pI distributions of the identified proteins (dashed lines) and 8880 mouse annotated proteins (solid lines) in Swiss-Prot database (v46). The frequency densities on Y-axes were computed by kernel density estimate functions in R package (http://www.r-project.org/) with default settings.
Table 1.
CNS cellular localization of some identified proteinsa
| Swiss-Prot Accession | Protein | Most common cellular localization |
|---|---|---|
| P03995 | Glial fibrillary acidic protein | Astrocytes |
| P56565 | S-100 A1 protein, alpha chain | |
| P50114 | S-100 A1 protein, beta chain | |
| P97352 | S-100 calcium binding protein A13 | |
| P16330 | CNPase | Oligodendrocytes |
| P04370 | Myelin basic protein | |
| P60202 | Myelin proteolipid protein | |
| P20917 | Myelin-associated glycoprotein | |
| Q61885 | Myelin-oligodendrocyte glycoprotein | |
| P46660 | Alpha-internexin | Neurons |
| P63054 | Brain-specific polypeptide PEP-19 | |
| Q60829 | Dopamine and cAMP-regulated protein | |
| P14873 | Microtubule-associated protein 1B (MAP 1B) | |
| P20357 | Microtubule-associated protein 2 | |
| P10637 | Microtubule-associated protein tau | |
| P19246 | Neurofilament triplet H | |
| P08551 | Neurofilament triplet L | |
| P08553 | Neurofilament triplet M | |
| P06837 | Neuromodulin | |
| P12660 | Purkinje cell protein 2 | |
| O88935 | Synapsin-1 | |
| Q8JZP2 | Synapsin-3 | |
| Q62277 | Synaptophysin | |
| O35633 | Vesicular GABA transporter | |
| P28663 | Beta-soluble NSF attachment protein | |
| Q9CWZ7 | Gamma-soluble NSF attachment protein | |
| P60521 | GABA(A) receptor associated protein | |
| P62812 | GABA(A) receptor alpha-1 subunit | |
| P16305 | GABA(A) receptor alpha-6 subunit | |
| P63137 | GABA(A) receptor beta-2 subunit | |
| Q9Z2W8 | Glutamate receptor 4 | |
| Q61625 | Glutamate receptor delta-2 subunit | |
| P06837 | Neuromodulin (GAP-43) |
The proteins are classified according to their known enriched expression in CNS cells. Some of these proteins may be expressed in other cell types.
3.6 iTRAQ method reveals broader proteome coverage than 2-DE
Proteins identified were compared with previously published mouse cerebellum proteomes. We observed 953 proteins, which was significantly more than those seen by 2-DE approaches. Compared with the only two 2-DE mouse cerebellum datasets to date, our iTRAQ dataset contained all 30 proteins that Beranova-Giorgianni et al. [41] reported using 2-DE, and 41 out of the 48 proteins that Pollak et al. [3] discovered from three different mouse strains (Fig. 5). While those two 2-DE datasets share less than 20% overlap, our cerebellar dataset contained more than 85% of the proteins found in either 2-DE dataset. In addition, our cerebellar proteome is even more comprehensive than the 104 [42] and 466 proteins identified from mouse brains using 2-DE [5]. Therefore, we conclude that this new method is suitable for cerebellum proteomics analysis, and it can encompass significantly broader proteome coverage than 2-DE methods. More recently, other groups have reported the identification of 4542 proteins from cortical neurons [43] and 7792 proteins from mouse brains [44] by improved multidimensional LC MS/MS methods. Consequently, further workflow improvement is possible for even broader proteome coverage.
Figure 5.

Mouse cerebellum proteome coverage comparisons among the current iTRAQ study and earlier 2-DE reports. Venn diagram analysis shows that iTRAQ dataset presented here contains more than 85% of the proteins in 2-DE analysis by Beranova-Giorgianni et al. [43] and Pollak et al. [3]. Six proteins were seen in all three datasets.
3.7 GO classification of identified proteins
The identified proteins were categorized by the DAVID software based on their GO annotations. GO annotations are structured and controlled vocabularies (ontologies) that describe gene products. They are composed of three independent ontologies: Biological Process, Molecular Function and Cellular Component. In each category, GO terms are connected into nodes of a network based on their relationships among one another and form directed acyclic graphs [29]. For each level-three GO term, a hypergeometric test was used to compare the number of identified cerebellar proteins with that of all mouse proteins in Swiss-Prot. A p-value was produced as an estimation of the relative protein enrichment for that term. Terms with significant experimental enrichment would have p-values closer to 0. For example, based on Biological Process classification, we found that proteins involved in neurotransmitter secretion and cell–cell signaling were enriched (p-values of 7.08E-4 and 3.43E-3, respectively; Supplementary Table 2A). Molecular Function classification indicated the enrichment of metal ion transport and calmodulin-binding proteins (p-values of 1.48E-18 and 1.70E-6, respectively, Supplementary Table 2B). When the Cellular Component was evaluated, we found that synaptic proteins and intracellular organelle proteins were enriched (p-values of 1.81E-4 and 7.38E-22, respectively, Supplementary Table 2C). Cytoplasmic proteins were also significantly enriched (p-value of 3.46E-61), which was in accordance with the pI distribution discussed earlier (Section 3.5 and Fig. 4C).
3.8 Identification of important neuronal proteins
Detailed examination of identified proteins revealed many important proteins specific to the CNS. In addition to proteins essential for neuronal function, we identified key proteins that are frequently expressed in astrocytes and oligodendrocytes (Table 1). Since CNS function involves delicate interactions among different cell types, the detection of cell type specific proteins indicates that the CNS proteome can be comprehensively studied by iTRAQ.
3.9 Proteins that maintain calcium homeostasis and neuronal structure are altered in PMCA-null mouse cerebellum
We applied the optimized iTRAQ workflow to assess proteomic changes in the cerebellum of PMCA2−/− mice versus PMCA2+/+ littermates. A Student’s t-test was employed to evaluate the significance of observed protein changes. Since the sample size was small, in order to reduce false positives, we only report here the proteins whose expression levels fell beyond 1 SD from the population mean. Overall, the protein ratio distribution was symmetrical with mean at 1.0-fold and SD of 0.11-fold. Among the 21 proteins that were deemed to be differentially expressed, 15 were increased in PMCA2-null mice while six were decreased (Table 2). Although hemoglobin was also found significantly decreased following our analysis routine (Fig. 3), it is excluded from Table 2 because we believed that its “change” was more likely due to a sample handling artifact rather than the consequence of PMCA2 gene knockout. Complexe removal of meninges and blood vessels from the cerebellum is difficult. The relative protein expression changes were reproducible when the spectra for peptides belonging to the same protein were evaluated (see examples in Fig. 6).
Table 2.
Functional classification of proteins changed in PMCA-null mice
| Swiss-Prot Acc. | Protein | Peptide count | Ratio | Range(±SD)a | p-value | Function |
|---|---|---|---|---|---|---|
| P11881 | Inositol 1,4,5-trisphosphate receptor 1 | 3 | 0.73 | 0.65–0.81 | 2.8E-02 | Calcium signalling |
| P12658 | Calbindin | 13 | 0.83 | 0.73–0.94 | 1.7E-02 | |
| P61161 | Actin-like protein 2 | 2 | 0.87 | 0.78–0.96 | 3.1E-02 | Cell structure |
| P16546 | Brain spectrin alpha chain | 19 | 0.9 | 0.77–1.05 | 2.0E-03 | |
| Q62261 | Brain spectrin beta chain | 12 | 0.9 | 0.80–1.00 | 4.6E-02 | |
| Q8BYI9 | Tenascin-R precursor | 4 | 1.31 | 1.04–1.64 | 2.6E-02 | |
| P26645 | Myristoylated alanine-rich C-kinase substrate(MARCKS) | 5 | 1.4 | 1.12–1.74 | 4.1E-02 | |
| Q8CI94 | Glycogen phosphorylase | 8 | 1.14 | 1.02–1.27 | 5.3E-03 | Metabolism |
| P26443 | Glutamate dehydrogenase 1 | 15 | 1.16 | 1.02–1.33 | 4.1E-03 | |
| Q61207 | Prosaposin | 2 | 1.19 | 1.12–1.27 | 6.1E-03 | |
| P15532 | Nucleoside diphosphate kinase A | 2 | 1.2 | 1.05–1.38 | 2.9E-02 | |
| Q05816 | Fatty acid-binding protein | 2 | 1.24 | 1.13–1.37 | 1.9E-02 | |
| P15105 | Glutamine synthetase | 8 | 1.3 | 1.07–1.58 | 2.2E-02 | |
| P52760 | Ribonuclease UK114 | 5 | 1.46 | 1.21–1.78 | 4.4E-02 | |
| Q9R0P9 | Ubiquitin carboxyl-terminal hydrolase isozyme L1 | 7 | 1.23 | 1.14–1.34 | 1.3E-04 | Protein homeostasis |
| Q00896 | Alpha-1-antitrypsin 1–3 precursor | 2 | 0.87 | 0.87–0.88 | 6.1E-03 | Stress response |
| O08709 | Peroxiredoxin 6 | 7 | 1.19 | 1.12–1.27 | 6.6E-03 | |
| P10812 | Histone H2A.291.A | 4 | 1.27 | 1.14–1.42 | 2.0E-02 | Chromosome organization |
| P15864 | Histone H1.2 | 5 | 1.29 | 1.21–1.37 | 1.3E-02 | |
| P60202 | Myelin proteolipid protein | 3 | 1.18 | 1.03–1.36 | 3.8E-02 | Myelin formation |
| Q9QYG0 | NDRG2 | 3 | 1.17 | 1.13–1.21 | 3.1E-02 | Cell growth |
The range is 1 SD from the mean of all associated peptides.
Figure 6.
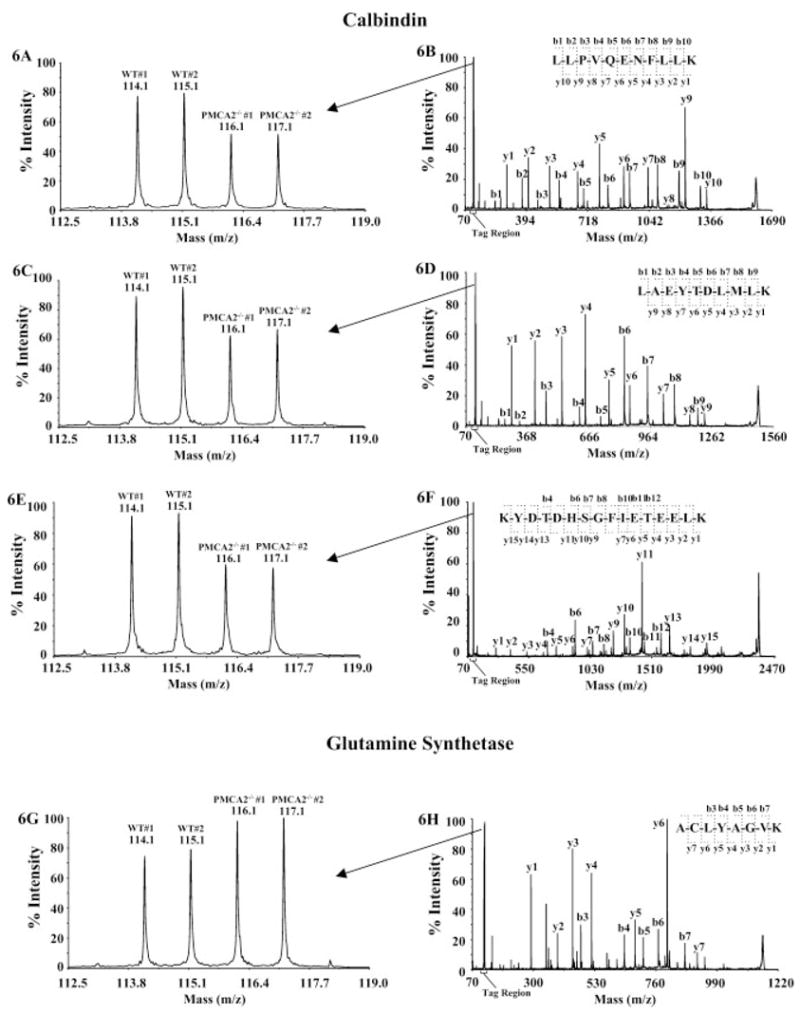
MS/MS spectra for selected proteins. Calbindin was down-regulated and glutamine synthetase was up-regulated in PMCA2-null mice. Three calbindin peptides and one glutamine synthetase peptide are shown. The down-regulations of calbindin in PMCA2-null mice were reproducible between mice and consistent among all three peptides (A, C and E). MS/MS spectra matching peptide LLPVQENFLLK (residue 169 to 179) are shown in A and B; LAEYTDLMLK (residue 142 to 151) in C and D and KYDTDHSGFIETEELK (residue 108 to 123) in E and F. For comparison, glutamine synthetase was up-regulated (G and H, spectrum for ACLYAGVK, residue 182 to 189). Peptide sequences were derived from the MS/MS spectra based on observations of continuous series of either N-terminal (b series) or C-terminal (y series) ions (B, D, F and H). Differential quantifications of the peptides were based on the relative iTRAQ signature peak areas at m/z 114, 115, 116 and 117 (A, C, E and G).
The most prominent changes occurred in proteins involved in calcium homeostasis, cellular structure maintenance, metabolism and chromosome organization (Table 2). The expression level of calcium-binding protein calbindin was significantly decreased (p <0.02). Further validation by Western blotting showed remarkable quantitative agreement between these two methods (Fig. 7). The expression ratio from Western blotting was ~70%, compared to ~80% observed in the iTRAQ experiment (Table 2). It is well known that calbindin plays critical roles in Pukinje cell Ca2+ homeostasis [45, 46]. Moreover, inositol 1,4,5-trisphosphate receptor 1 was also found reduced (p <0.03) which was also confirmed by Western analysis (manuscript submitted by Kurnellas et al.) . Thus, decreased Ca2+ extrusion due to the lack of PMCA2, together with a reduction in buffering capacity due to diminution of calbindin and other Ca2+ regulators, may cause pathological increases in intracellular Ca2+ levels in Purkinje or granule neurons. Such disturbances in Ca2+ levels can cause altered neurotransmitter release and synaptic transmission, which may lead to neurological deficits observed in PMCA2-null mice (manuscript submitted by Kurnellas et al.). The down-regulation of calbindin in PMCA2-null mice is consistent with an earlier study by Pollak et al. [3], which indicted that the reduction of calbindin might contribute to motor deficiency.
Figure 7.

Quantification of calbindin in the cerebellum of PMCA2-null and wild-type mice using Western blot analysis. Representative Western blots (left panel) were obtained from both wild-type (1–3) and PMCA2-null (4–6) mice. Quantification of the signal observed indicated a significant decrease in the levels of calbindin, corroborating the results obtained by iTRAQ analysis. * p < 0.04 by Student’s t-test.
Analysis of PMCA2-null cerebellum also raised the possibility of cytoskeletal abnormalities. There were changes in the levels of structural proteins such as spectrins (p <0.05) and proteins which interact with cytoskeletal elements such as MARCKS (p <0.05). Cytoskeletal anomalies may cause neuronal dysfunction by perturbing axonal transport and by disrupting synaptic communication due to the affected dendritic morphology and function. In addition, the expressions of many metabolic proteins were altered. Among those proteins were glutamine synthetase (p <0.03) and glutamate dehydrogenase 1 (p <0.05), whose expression levels were increased. These two enzymes mediate the metabolism of glutamate, an excitatory neurotransmitter involved in parallel fiber–Purkinje neuron communication. These observations suggest that glutamate levels might be decreased in PMCA2-null mice. Further studies are needed to test this hypothesis.
4 Concluding remarks
In this study, we were able to quantify nearly 1000 proteins and discover molecular changes that might account for the cerebellar dysfunctions observed in PMCA2-null mice. Our findings suggest that the iTRAQ method provides a powerful quantitative tool for neuronal studies. Successful implementation of this technology, however, requires careful consideration of experimental design, hardware choices and data analysis routines in order to ensure accurate protein quantification.
Supplementary Material
Acknowledgments
This project was supported in part by NIH grants NS046593 to H.L. and NS046363 to S.E. We dedicate this manuscript to the loving memory of our colleague and friend Dr. Longwen Deng. We thank Ms. Anna Mezzacapo, Drs. Ray Birge, Lin Yan and Andrew Parrott for the helpful discussions during the preparation of this manuscript.
Abbreviations
- GFP
glu-fibrinopeptide
- GO
gene ontology
- PMCA2
plasma membrane calcium ATPase 2
- RPA
reporter ion peak area
- TIS
timed-ion-selector
References
- 1.Rohlff C. Int J Neuropsychopharmacol. 2001;4:93–102. doi: 10.1017/S1461145701002267. [DOI] [PubMed] [Google Scholar]
- 2.Rohlff C. Electrophoresis. 2000;21:1227–1234. doi: 10.1002/(SICI)1522-2683(20000401)21:6<1227::AID-ELPS1227>3.0.CO;2-L. [DOI] [PubMed] [Google Scholar]
- 3.Pollak D, Weitzdoerfer R, Yang YW, Prast H, et al. Neurochem Int. 2005;46:19–29. doi: 10.1016/j.neuint.2004.07.003. [DOI] [PubMed] [Google Scholar]
- 4.Kyosseva SV. Cerebellum. 2004;3:94–99. doi: 10.1080/14734220410029164. [DOI] [PubMed] [Google Scholar]
- 5.Klose J, Nock C, Herrmann M, Stuhler K, et al. Nat Genet. 2002;30:385–393. doi: 10.1038/ng861. [DOI] [PubMed] [Google Scholar]
- 6.Fountoulakis M, Juranville JF, Dierssen M, Lubec G. Proteomics. 2002;2:1547–1576. doi: 10.1002/1615-9861(200211)2:11<1547::AID-PROT1547>3.0.CO;2-M. [DOI] [PubMed] [Google Scholar]
- 7.Fountoulakis M, Tsangaris GT, Maris A, Lubec G. J Chromatogr B Analyt Technol Biomed Life Sci. 2005;819:115–129. doi: 10.1016/j.jchromb.2005.01.037. [DOI] [PubMed] [Google Scholar]
- 8.Yang JW, Czech T, Lubec G. Electrophoresis. 2004;25:1169–1174. doi: 10.1002/elps.200305809. [DOI] [PubMed] [Google Scholar]
- 9.Beranova-Giorgianni S, Giorgianni F, Desiderio DM. Proteomics. 2002;2:534–542. doi: 10.1002/1615-9861(200205)2:5<534::AID-PROT534>3.0.CO;2-K. [DOI] [PubMed] [Google Scholar]
- 10.Lubec G, Krapfenbauer K, Fountoulakis M. Prog Neurobiol. 2003;69:193–211. doi: 10.1016/s0301-0082(03)00036-4. [DOI] [PubMed] [Google Scholar]
- 11.Choudhary J, Grant SG. Nat Neurosci. 2004;7:440–445. doi: 10.1038/nn1240. [DOI] [PubMed] [Google Scholar]
- 12.Zhao Y, Giorgianni F, Desiderio DM, Fang B, Beranova-Giorgianni S. Anal Chem. 2005;77:5324–5331. doi: 10.1021/ac050354e. [DOI] [PubMed] [Google Scholar]
- 13.Yates JR., 3rd J Mass Spectrom. 1998;33:1–19. doi: 10.1002/(SICI)1096-9888(199801)33:1<1::AID-JMS624>3.0.CO;2-9. [DOI] [PubMed] [Google Scholar]
- 14.Swanson SK, Washburn MP. Drug Discov Today. 2005;10:719–725. doi: 10.1016/S1359-6446(05)03450-1. [DOI] [PubMed] [Google Scholar]
- 15.Nielsen PA, Olsen JV, Podtelejnikov AV, Andersen JR, et al. Mol Cell Proteomics. 2005;4:402–408. doi: 10.1074/mcp.T500002-MCP200. [DOI] [PubMed] [Google Scholar]
- 16.Ross PL, Huang YN, Marchese JN, Williamson B, et al. Mol Cell Proteomics. 2004;3:1154–1169. doi: 10.1074/mcp.M400129-MCP200. [DOI] [PubMed] [Google Scholar]
- 17.Aggarwal K, Choe LH, Lee KH. Proteomics. 2005;5:2297–2308. doi: 10.1002/pmic.200401231. [DOI] [PubMed] [Google Scholar]
- 18.Unwin RD, Pierce A, Watson RB, Sternberg DW, Whetton AD. Mol Cell Proteomics. 2005;4:924–935. doi: 10.1074/mcp.M400193-MCP200. [DOI] [PubMed] [Google Scholar]
- 19.Chen X, Walker AK, Strahler JR, Simon ES, et al. Mol Cell Proteomics. 2006;5:306–312. doi: 10.1074/mcp.M500172-MCP200. [DOI] [PubMed] [Google Scholar]
- 20.Hardt M, Witkowska HE, Webb S, Thomas LR, et al. Anal Chem. 2005;77:4947–4954. doi: 10.1021/ac050161r. [DOI] [PubMed] [Google Scholar]
- 21.DeSouza L, Diehl G, Rodrigues MJ, Guo J, et al. J Proteome Res. 2005;4:377–386. doi: 10.1021/pr049821j. [DOI] [PubMed] [Google Scholar]
- 22.Zhang Y, Wolf-Yadlin A, Ross PL, Pappin DJ, et al. Mol Cell Proteomics. 2005;4:1240–1250. doi: 10.1074/mcp.M500089-MCP200. [DOI] [PubMed] [Google Scholar]
- 23.Kozel PJ, Friedman RA, Erway LC, Yamoah EN, et al. J Biol Chem. 1998;273:18693–18696. doi: 10.1074/jbc.273.30.18693. [DOI] [PubMed] [Google Scholar]
- 24.Stahl WL, Eakin TJ, Owens JW, Jr, Breininger JF, et al. Brain Res Mol Brain Res. 1992;16:223–231. doi: 10.1016/0169-328x(92)90229-5. [DOI] [PubMed] [Google Scholar]
- 25.Julka S, Regnier FE. Brief Funct Genomic Proteomic. 2005;4:158–177. doi: 10.1093/bfgp/4.2.158. [DOI] [PubMed] [Google Scholar]
- 26.Kurnellas MP, Nicot A, Shull GE, Elkabes S. FASEB J. 2005;19:298–300. doi: 10.1096/fj.04-2549fje. [DOI] [PMC free article] [PubMed] [Google Scholar]
- 27.Rice P, Longden I, Bleasby A. Trends Genet. 2000;16:276–277. doi: 10.1016/s0168-9525(00)02024-2. [DOI] [PubMed] [Google Scholar]
- 28.Kyte J, Doolittle RF. J Mol Biol. 1982;157:105–132. doi: 10.1016/0022-2836(82)90515-0. [DOI] [PubMed] [Google Scholar]
- 29.Ashburner M, Ball CA, Blake JA, Botstein D, et al. Nat Genet. 2000;25:25–29. doi: 10.1038/75556. [DOI] [PMC free article] [PubMed] [Google Scholar]
- 30.Dennis G, Jr, Sherman BT, Hosack DA, Yang J, et al. Genome Biol. 2003;4:P3. [PubMed] [Google Scholar]
- 31.Dudoit S, Yang YH, Callow MJ, Speed TP. Statistica Sinica. 2002;12:111–139. [Google Scholar]
- 32.Chernushevich IV, Loboda AV, Thomson BA. J Mass Spectrom. 2001;36:849–865. doi: 10.1002/jms.207. [DOI] [PubMed] [Google Scholar]
- 33.Molloy MP, Donohoe S, Brzezinski EE, Kilby GW, et al. Proteomics. 2005;5:1204–1208. doi: 10.1002/pmic.200400994. [DOI] [PubMed] [Google Scholar]
- 34.Anderle M, Roy S, Lin H, Becker C, Joho K. Bioinformatics. 2004;20:3575–3582. doi: 10.1093/bioinformatics/bth446. [DOI] [PubMed] [Google Scholar]
- 35.Irizarry RA, Hobbs B, Collin F, Beazer-Barclay YD, et al. Biostatistics. 2003;4:249–264. doi: 10.1093/biostatistics/4.2.249. [DOI] [PubMed] [Google Scholar]
- 36.Yang YH, Speed T. Nat Rev Genet. 2002;3:579–588. doi: 10.1038/nrg863. [DOI] [PubMed] [Google Scholar]
- 37.Allison DB, Cui X, Page GP, Sabripour M. Nat Rev Genet. 2006;7:55–65. doi: 10.1038/nrg1749. [DOI] [PubMed] [Google Scholar]
- 38.Tonge R, Shaw J, Middleton B, Rowlinson R, et al. Proteomics. 2001;1:377–396. doi: 10.1002/1615-9861(200103)1:3<377::AID-PROT377>3.0.CO;2-6. [DOI] [PubMed] [Google Scholar]
- 39.Peng J, Elias JE, Thoreen CC, Licklider LJ, et al. J Proteome Res. 2003;2:43–50. doi: 10.1021/pr025556v. [DOI] [PubMed] [Google Scholar]
- 40.Schwartz R, Ting CS, King J. Genome Res. 2001;11:703–709. doi: 10.1101/gr.gr-1587r. [DOI] [PubMed] [Google Scholar]
- 41.Beranova-Giorgianni S, Pabst MJ, Russell TM, Giorgianni F, et al. Brain Res Mol Brain Res. 2002;98:135–140. doi: 10.1016/s0169-328x(01)00333-3. [DOI] [PubMed] [Google Scholar]
- 42.Gauss C, Kalkum M, Lowe M, Lehrach H, et al. Electrophoresis. 1999;20:575–600. doi: 10.1002/(SICI)1522-2683(19990301)20:3<575::AID-ELPS575>3.0.CO;2-3. [DOI] [PubMed] [Google Scholar]
- 43.Yu LR, Conrads TP, Uo T, Kinoshita Y, et al. Mol Cell Proteomics. 2004;3:896–907. doi: 10.1074/mcp.M400034-MCP200. [DOI] [PubMed] [Google Scholar]
- 44.Wang H, Qian WJ, Chin MH, Petyuk VA, et al. J Proteome Res. 2006;5:361–369. doi: 10.1021/pr0503681. [DOI] [PMC free article] [PubMed] [Google Scholar]
- 45.Schmidt H, Stiefel KM, Racay P, Schwaller B, et al. J Physiol. 2003;551:13–32. doi: 10.1113/jphysiol.2002.035824. [DOI] [PMC free article] [PubMed] [Google Scholar]
- 46.Gall D, Roussel C, Nieus T, Cheron G, et al. Prog Brain Res. 2005;148:321–328. doi: 10.1016/S0079-6123(04)48025-X. [DOI] [PubMed] [Google Scholar]
Associated Data
This section collects any data citations, data availability statements, or supplementary materials included in this article.