

Abstract
Langmuir-Blodgett multilayers of alternating barium arachidate and barium dimyristoyl phosphatidate are characterized by secondary ion mass spectrometry employing a 40 keV buckminsterfullerene (C60) ion source. These films exhibit well-defined structures with minimal chemical mixing between layers, making them an intriguing platform to study fundamental issues associated with molecular depth profiling. The experiments were performed using three different substrates of 306 nm, 177 nm, and 90 nm in thickness, each containing six subunits with alternating chemistry. The molecular subunits are successfully resolved for the 306 nm and 177 nm films by cluster ion depth profiling at cryogenic temperatures. In the depth profile, very little degradation was found for the molecular ion signal of the underneath layers compared with that of the top layer, indicating that the formation of chemical damage is removed as rapidly as it is formed. The resolving power decreases as the thickness of the alternating subunits decrease, allowing a depth resolution of 20 to 25 nm to be achieved. The results show the potential of LB films as an experimental model system for studying fundamental features of molecular depth profiling.
Polyatomic projectiles have expanded potential applications of secondary ion mass spectrometry (SIMS) experiments [1–3]. An important modality is to obtain molecular information as a function of depth via mass spectrometry using the polyatomic ion-beam to erode through organic and/or biological samples [4–8]. Molecular depth profiling of this type has generally not been possible with traditional atomic projectiles due to accumulation of ion-induced damage [9, 10]. For bombardment with molecular clusters, however, the chemical damage is often removed as fast as it accumulates, leaving the sample underneath relatively intact [11, 12]. Ultimately, three-dimensional mass spectral analysis of complex molecular systems can be achieved with the combination of molecular depth profiling and SIMS imaging [13, 14]. Although several different projectiles have been shown to be effective for these types of experiments, we and others [4, 7, 8, 15] have reported that buckminsterfullerene (C60+) is particularly effective in this regard.
With the emergence of cluster SIMS, a fundamental understanding of the sputtering process is needed to optimize the parameters for molecular depth profiling. An essential element for experimental investigation of the interaction between energetic cluster ions and a molecular solid is the availability of a model system which has a well-defined chemical structure and can be reproducibly synthesized. Previously, we have utilized 300-nm trehalose sugar films spin-cast onto Si substrates as such a platform [8, 11]. Recently, Shard et al. have reported on a different system consisting of organic delta layers and demonstrates the depth dependence of depth resolution [16]. Together with an analytical model, parameters such as depth resolution, sputtering yield, and the thickness of the altered layer at the surface were able to be estimated.
Earlier experiments have suggested that multilayer films prepared by Langmuir-Blodgett (LB) techniques might make a good model for more complicated systems [11, 12]. Here we show how this technology can be employed to construct samples consisting of multilayers of organic thin films with varying chemical composition. The specific goals of this preliminary study are to establish the degree of ion-beam induced chemical damage that occurs during depth profiling and to determine the degree of mixing that occurs between the layers during erosion. Ultimately, we hope that this platform will allow optimization of the parameters necessary to characterize buried interfaces using cluster SIMS.
Langmuir-Blodgett (LB) films are formed by amphiphilic molecules at the air-water interface and are subsequently transferred to a solid substrate to form monolayers and multilayers [17–19]. By changing the type of molecule applied to the air-water interface, it is straightforward to form layers with differing chemical composition. More importantly, LB multilayers have been well-characterized and are known to form sharp boundaries between the layers due to the amphiphilic character of the molecules [18–25]. In this study, LB films of barium arachidate and barium dimyristoyl phosphatidate alternating in varying thicknesses are formed and depth profiled by a 40 keV C60+ ion beam. The morphology of the surfaces before, during and after bombardment is monitored using atomic force microscopy (AFM). The results show that the profile of molecular-specific ion signals accurately represents the chemical structures of these LB films through at least 300 nm of erosion. The extent of how well these structures are resolved by depth profiling suggests that the depth resolution is about 20 nm. In general, we suggest that this system is well-suited as a model to fully investigate the experimental parameters necessary for optimization of molecular depth profiling experiments.
Experimental
Materials
Arachidic acid (AA), barium chloride (99.999%), potassium hydrogen carbonate (99.7%), and copper(II) chloride (99.999%) and solvents were purchased from Sigma-Aldrich (Allentown, PA). Dimyristoyl phosphatidic acid (DMPA) was purchased from Avanti Polar Lipids (Alabaster, AL). All the chemicals were used without further purification. The high purity water used in preparation of all LB films was obtained from a Nano-pure Diamond Life Science Ultrapure Water Systems (Barnstead International, Dubuque, IA) and has a resistivity of 18.2 MΩ-cm.
Substrate and LB Film Preparation
Single crystal (100) silicon wafers 3 × 3 in. square were employed as the substrate for all the films. The Si substrates were cleaned by submerging the substrates in a piranha etch solution (3:1 H2SO4/H2O2) for 10 to 15 min and rinsed with high purity water several times to ensure the hydrophilicity of the Si/SiO2 surface. (Extreme caution must be exercised when using piranha etch. An explosion-proof hood should be used.) A Kibron μTrough S-LB (Helsinki, Finland) was used for isotherm acquisition and multilayer LB film preparation. The subphase contained 70 mL of aqueous solution of 10-4 M BaCl2, 10-3 M KHCO3, and 10-7 M CuCl2. The BaCl2 was added to form salt with arachidic acid and DMPA at pH 7 which was adjusted by addition of KHCO3. The CuCl2 was used to enhance film stability after synthesis of a large number of layers. Monolayers of AA and DMPA at the air-water interface were aged for 30 min and compressed at a constant rate of 7 Å2/ molecule/min. When the surface pressure reached 33 mN/m, the film was transferred onto the Si substrate by vertical deposition at the rate of 10 mm/min. The surface pressure was measured and kept constant during film transfer by a Wilhelmy wire interfaced to a personal computer. At least three layers of AA were always applied onto the substrate initially to ensure further multilayer formation. An even number of DMPA or AA layers were deposited consecutively. The films were allowed to dry for 15 min between each deposition.
Instrumentation
Depth profiling of LB films was performed by a TOF-SIMS instrument described previously [5]. The system is equipped with a 40 keV C60+ ion source (Ionoptika; Southampton, U.K.), which is directed to the target at an angle of 40° relative to the surface normal. Under typical operating conditions, the C60+ ion source delivers a 0.2 nA ion current at a 30 μm probe size onto the analysis stage. The samples were sputtered over an area of 200 μm × 300 μm in dc mode by the C60+ ion beam during depth profiling. The erosion time of each cycle varies from 3 to 10 s. Between erosion cycles, SIMS spectra were taken from a smaller area of 50 μm × 75 μm located at the center of sputtered region. The C60+ fluence was kept below of 1010 cm-2 to avoid any possible effects of beam induced damage during spectral acquisition. The mass spectrometer was operated in a delayed extraction mode with 50 nsec delay time between the primary ion pulse and the secondary ion extraction pulse. Charge compensation was found to be unnecessary for positive SIMS mode. Secondary ion intensity was calculated by integrating the peak area of the corresponding mass value. Mass resolution of ∼2500 was achieved at m/z 500. All depth profiles were recorded after cooling the substrate to 100 K. Cooling was necessary to avoid thermally-induced mixing of the layers, and yielded results with considerable improved depth resolution.
Ellipsometry and AFM Measurements
The crater depth was measured by AFM (Nanopics 2100; KLA-Tencor, San Jose, CA) with a maximum field of view of 800 μm × 800 μm in contact mode. The thickness of the LB films was determined by a single-wavelength (632.8 nm, 1 mm spot size, 70° angle of incidence) Stokes ellipsometer (model LSE; Gaertner Scientific Corp., Skokie, IL), and the value is averaged over at least three measurements.
Results and Discussion
Using LB technology, our strategy is to construct a series of multilayer thin films whose thickness varies from a few nanometers to about 50 nm to assess the ability of cluster SIMS to distinguish between the layers. LB films have well-defined interfaces and exhibit very little chemical mixing between each layer, [19], which make it suited for fundamental studies of cluster ion induced interface mixing and depth resolution. This work is focused on developing LB multilayers as a stable and robust platform so that more fundamental issues of molecular depth profiling can be understood.
LB Film Characteristics
LB multilayers are prepared using layer-by-layer deposition on clean Si substrates. The resulting films are stable under ambient condition for over 1 mo as indicated by their color, mass spectra and depth profiles. The barium ions in the subphase form barium salts with AA or DMPA under pH 8 which is controlled by KHCO3. This pH value allows monolayers to be transferred smoothly onto the substrate with a minimum of defects [24]. The monolayers are transferred at a surface pressure of 33 mN/m, a pressure corresponding to the solid-phase region. At that surface pressure, each AA and DMPA molecule occupies an area of 20 Å2and 41 Å2, respectively. These molecular areas lead to a corresponding monolayer density of 5.0 × 10¹⁴ molecules/cm2 and 2.5 × 10¹⁴ molecules/cm2. These numbers can be used to accurately calculate the sputtering yield, defined as the number of molecule equivalents removed per incident particle.
The films are prepared by creating a block of AA multilayers, switching the monolayer on the subphase to DMPA, and preparing a block of DMPA multilayers on top of the AA block. This process is then repeated many times to produce films shown schematically in Figure 1. The thickness of each film equals the thickness of one monolayer multiplied by the number of layers applied to the substrate. The monolayer thicknesses for AA and DMPA are 2.7 nm and 2.2 nm, respectively, as measured by ellipsometry. The values of the thicknesses of each building block and of the entire film for the substrates examined in this work are noted in the Figure 1. The use of films with different block size will allow a test of the depth resolution during depth profiling as shown later.
Figure 1.
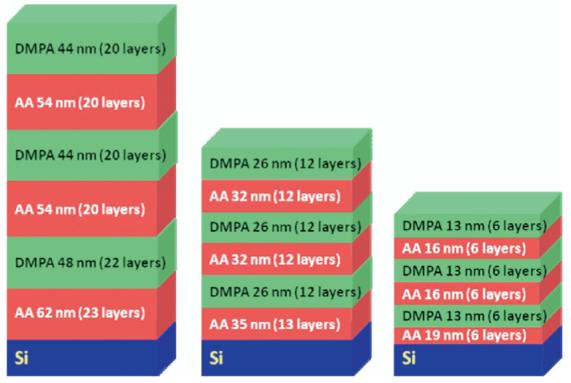
Schematic of three alternating Langmuir-Blodgett films with thickness of each block and number of layers listed.
The LB films have different colors depending upon thickness due to optical interference. A light microscope image of LB20 after depth profiling is shown in Figure 2a. The exposed Si crater formed by C60 erosion is seen as a grey rectangle, while the blue area is the virgin LB film. The uniformity of the color is indicative of uniform film deposition.
Figure 2.

(a) Optical image of LB20 film with a crater in the middle which is created after C60+ depth profiling (the crater is the grey area, which is surrounded by blue uneroded area); (b) AFM measurements of LB20 films with a crater which is formed by C60+ depth profiling.
In addition to light microscopy, AFM is also used to characterize the LB films, as illustrated in Figure 2b. The crater is determined to be 200 μm × 300 μm and the crater depth is measured to be 330 nm for the LB20 sample. For this situation, the LB film itself is calculated to be 307 nm in thickness, as determined from the known number of layers deposited multiplied by the appropriate monolayer thickness as determined by ellipsometry. The difference between the numbers is largely because the AFM data include a small contribution from erosion into the Si substrate. The estimated yield of Si under 40 keV C60+ bombardment is about 200 Si atoms/C60+ [26] and the fluence applied to the bare Si to form this crater is about 7 × 10¹³ ions/cm2. Hence, about 30 nm of Si will be eroded away. These numbers show that there is excellent agreement between AFM measurements of the crater, and ellipsometry measurements on the respective monolayers, providing additional evidence for the high quality of these LB multilayer structures.
It is possible to acquire an approximate indication of the surface roughness associated with these films. The AFM measurements on the clean Si substrate after the piranha etch show that over an area of 20 μm by 20 μm, the rms roughness is about 15 nm. Before the piranha etch, the roughness is about 1 nm, showing that this treatment is responsible for the new surface properties. Measurements on the LB film before sputtering yield a surface roughness of 20 nm, which does not change significantly with film thickness. The roughness of the LB film, after C60+ bombardment and before complete removal of the film, was also measured to range from 20 to 25 nm. Hence, the LB film roughness data suggest that there is minimal topography formation during bombardment, and that the film retains a planar configuration to at least a precision of 15 nm.
Characterization of LB Films by SIMS
Before depth profiling, the SIMS spectra of the LB monolayers of AA and DMPA are determined. The monolayers are prepared under the same conditions as the multilayers to ensure mass spectral uniformity. The mass spectra and chemical structure of AA and DMPA are shown in Figure 3. The barium containing peaks dominate both spectra and provide more specific chemical information [27]. The characteristic peaks for AA are m/z 449 and 463, corresponding to the [M - H + Ba]+ and [M - H + Ba + CH2]+, respectively. Molecular ions for DMPA are not observed, however a high-mass fragment peak at m/z 525 is significant and unique to DMPA. Lower mass peaks at m/z 371 and 355 are also characteristic of DMPA. Hence, for depth profiling, m/z 463 is used to represent AA and m/z 525 for DMPA.
Figure 3.

Chemical structures and C60+-induced mass spectrum of LB monolayer. (a) AA; (b) DMPA. Both spectra have Ba+ at m/z 138 and BaOH+ at m/z 155. AA has characteristic peaks at m/z 463 and 471, while DMPA is characterized by peaks m/z 355, 371, and 525.
Depth profiles of the three LB films by C60+ ion bombardment are displayed in Figure 4. The integrated molecular-specific peak intensities of AA, DMPA, and Si, are plotted versus C60+ ion fluence. Note that the SIMS peak at m/z 112 for the silicon cluster Si+4 is used instead of Si+ at m/z 28 due to the isobaric hydrocarbon interference. As shown in Figure 4a for LB 20, the DMPA signal increases during the initial bombardment, then reaches its maximum. The initial increase most likely arises from surface contamination since it was not observed in the depth profile of fresh-made LB film. The signal remains at a maximum value before decreasing as the AA signal begins to increase from baseline. When the AA signal reaches its maximum, the DMPA signal reaches its minimum. This completes the first cycle of the depth profile. Upon further bombardment, these cycles repeat themselves until the film/Si interface is reached. Note that the AA and DMPA maximum and minimum signal intensities remain nearly constant. The conservation of these molecular ion signals indicates that the ion bombardment does not create significant damage to the underneath layers, a result which is predicted by many molecular dynamics computer simulations of the bombardment process [10, 28, 29]. In sum-mary, the depth profile accurately represents the molecular structure of these alternating block LB films.
Figure 4.
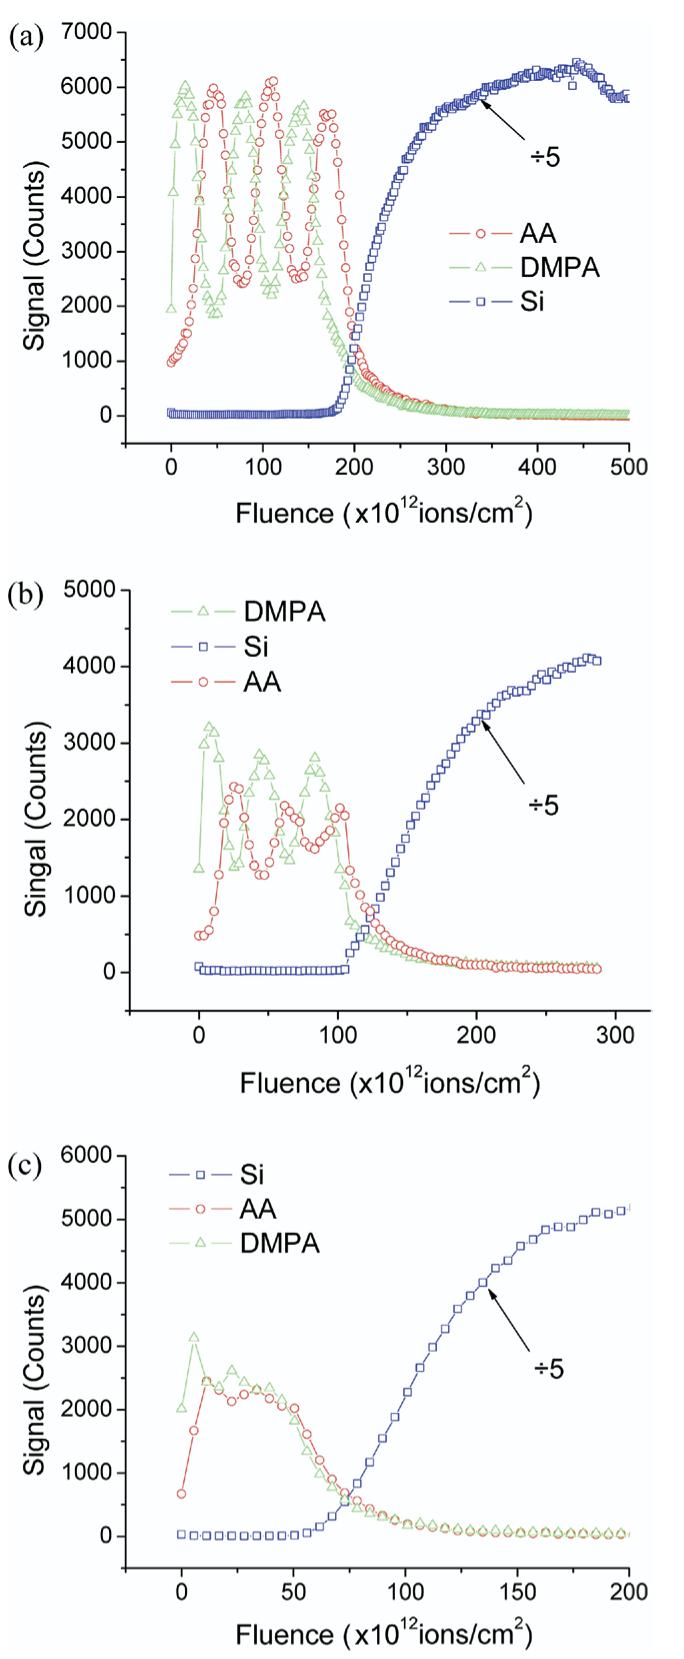
C60+ ion fluence dependence of AA, DMPA, and Si signals of (a) LB20, (b) LB12, and (c) LB6 films. AA, DMPA, and Si are represented by m/z 463, m/z 525, and m/z 112, respectively.
For LB12, where the block thickness is 26-32 nm, essentially the same profile is obtained as shown in Figure 4b, except that the individual blocks are less well resolved. This trend is continued for LB6 in Figure 4c, where the block thickness is 13 to 16 nm. This leads to a semiquantitative estimation that the depth resolution should range between 16 to 26 nm with the 40 keV C60+ projectile.
Computer simulations of the ion bombardment of 20 keV C60+ into a solid benzene matrix show that at normal incidence, a crater is formed at the surface with a depth of 4.2 nm, and a width of 8.7 nm, [Postawa, Z., private communication]. As noted above, very little damage or mixing is observed below the crater. Hence, it is our view that the intrinsic limit to the depth resolution ought to be near the 4.2 nm value. The fact that our measured interface width is larger than this value could arise from a number of sources, including roughness of the Si substrate, angle of incidence of the projectile, thermal mixing even at reduced temperatures, and/or topography formation during erosion of the organic film.
Calculation of Depth Resolution
It is possible to gain a semi-quantitative estimate of the interface width/depth resolution by examining the magnitude of the signal excursions in the depth profile, which has been explored for atomic depth profiling [30]. These fluctuations can be described as a contrast as follows:
where Smax and Smin are the maximum and minimum signal observed for one peak and SB is the residual background signal observed at the relevant m/z value. The SB value is determined from a two chemical block system consisting of films of sufficient thickness (∼140 nm) to allow steady-state signals to be achieved. There is an intrinsic relationship between contrast and depth resolution. Assuming that the depth response function is the integral of the product of a delta function (representing the discrete layer interface) and a Gaussian function, the depth resolution Δz equals 2σ, the half width of the Gaussian function. In the depth response function, Δz corresponds to the points where the signal drops from 84% to 16% intensity. If the chemical block, d, is much thicker than Δz, the signal coming from the chemical layer should reach a steady-state and the contrast is unity. On the other hand, the contrast approaches zero when d is much smaller than Δz. Between these two extreme situations, the contrast ranges from zero to one. The plot of contrast versus d/δz is displayed in Figure 5. Since the block thickness d is known for the LB films and the contrast can be measured from the depth profiles, the depth resolution is obtained by using this plot. The calculated depth resolution values of samples LB20 and LB12 are shown in Table 1, together with their measured contrasts. The LB6 is not studied since the contrast is almost lost. Although d is different for the two samples, the calculated Δz values are similar for each interface and correspond well with our previous estimation. Hence, having access to a reproducible model system along with a simple strategy for measuring depth resolution provides a good starting point to quantify the molecular depth profile experiments.
Figure 5.
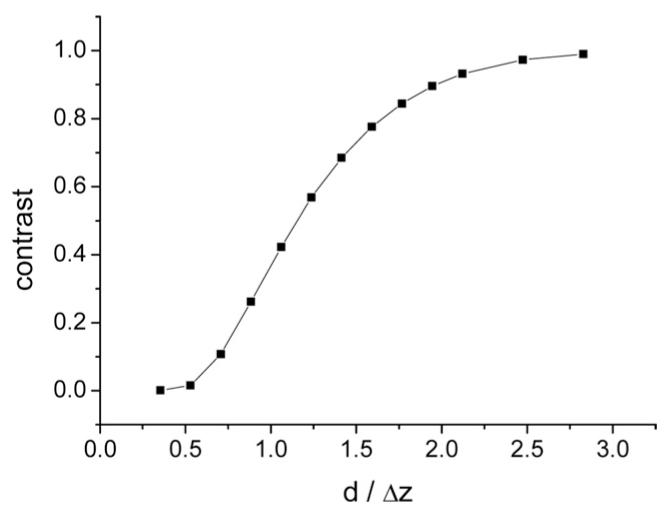
The plot of depth profile contrast versus layer thickness (d) over interface width (Δz).
Table 1.
The contrast and depth resolution for the top four interfaces of sample LB20 and LB12
| Sample | 1st Interface |
2nd Interface |
3rd Interface |
4th Interface |
|---|---|---|---|---|
| LB20 | ||||
| Contrast | 0.97 | 0.93 | 0.83 | 0.85 |
| Δz | 18 nm | 25 nm | 27 nm | 30 nm |
| LB12 | ||||
| Contrast | 0.65 | 0.6 | 0.55 | 0.27 |
| Δz | 19 nm | 25 nm | 22 nm | 35 nm |
Conclusions
We have shown that it is possible to make alternating chemical structures with sharp interfaces by using LB techniques. These structures make excellent models for detailed characterization of the molecular depth profiles created using cluster SIMS. By utilizing the relationship between contrast and interface width, we have also calculated the depth resolution to be about 17 to 35 nm, a value consistent with numbers reported for polymer and organic/inorganic interfaces [7, 8]. Most importantly, the degree of interface mixing increases only slightly, at least up to a film thickness of 300 nm, as the multilayer structure is systematically removed. With this platform, it should be possible to examine the influence of a number of important properties on the quality of the depth profile. For example, we are looking for better ways to prepare an appropriate hydro-philic Si surface without having to employ the piranha etch, since this procedure adds some uncertainty to the depth scale via surface roughening. Other factors that can possibly affect the value of depth resolution are also under investigation, including bombarded area, projectile energy, and projectile incident angle.
Acknowledgments
The material is based upon work supported by the National Institutes of Health under grant EB002016-13, the National Science Foundation under grant CHE-555314, and the Department of Energy grant DE-FG02-06ER15803. The authors also thank Dr. David Allara and his research group for the use of the ellipsometer, Dr. Thomas Mallouk and his group for the use of light microscopy.
References
- 1.Winograd N. The magic of cluster SIMS. Anal. Chem. 2005;77:142A–149A. [Google Scholar]
- 2.Winograd N, Postawa Z, Cheng J, Szakal C, Kozole J, Garrison BJ. Improvements in SIMS Continue—Is the end in sight? Appl. Surf. Sci. 2006;252:6836–6843. [Google Scholar]
- 3.Jones EA, Lockyer NP, Vickerman JC. Mass spectral analysis and imaging of tissue by TOF-SIMS—The role of buckminsterfullerene, C-60(+), primary ions. Int. J. Mass Spectrom. 2007;260:146–157. [Google Scholar]
- 4.Wucher A, Sun SX, Szakal C, Winograd N. Molecular depth profiling of histamine in ice using a buckminsterfullerene probe. Anal. Chem. 2004;76:7234–7242. doi: 10.1021/ac049641t. [DOI] [PubMed] [Google Scholar]
- 5.Sostarecz AG, Mcquaw CM, Wucher A, Winograd N. Depth profiling of Langmuir-Blodgett films with a buckminsterfullerene probe. Anal. Chem. 2004;76:6651–6658. doi: 10.1021/ac0492665. [DOI] [PubMed] [Google Scholar]
- 6.Mahoney CM, Roberson SV, Gillen G. Depth profiling of 4-acetamindophenol-doped poly(lactic acid) films using cluster secondary ion mass spectrometry. Anal. Chem. 2004;76:3199–3207. doi: 10.1021/ac035532n. [DOI] [PubMed] [Google Scholar]
- 7.Wagner MS. Molecular depth profiling of multilayer polymer films using time-of-flight secondary ion mass spectrometry. Anal. Chem. 2005;77:911–922. doi: 10.1021/ac048945c. [DOI] [PubMed] [Google Scholar]
- 8.Cheng J, Winograd N. Depth profiling of peptide films with TOF-SIMS and a C-60 probe. Anal. Chem. 2005;77:3651–3659. doi: 10.1021/ac048131w. [DOI] [PubMed] [Google Scholar]
- 9.Postawa Z, Czerwinski B, Szewczyk M, Smiley EJ, Winograd N, Garrison BJ. Enhancement of sputtering yields due to C-60 versus Ga bombardment of Ag{111} as explored by molecular dynamics simulations. Anal. Chem. 2003;75:4402–4407. doi: 10.1021/ac034387a. [DOI] [PubMed] [Google Scholar]
- 10.Postawa Z, Czerwinski B, Szewczyk M, Smiley EJ, Winograd N, Garrison BJ. Microscopic insights into the sputtering of Ag{111} induced by C-60 and Ga bombardment. J. Phys. Chem. B. 2004;108:7831–7838. doi: 10.1021/jp050821w. [DOI] [PubMed] [Google Scholar]
- 11.Cheng J, Wucher A, Winograd N. Molecular depth profiling with cluster ion beams. J. Phys. Chem. B. 2006;110:8329–8336. doi: 10.1021/jp0573341. [DOI] [PubMed] [Google Scholar]
- 12.Fletcher JS, Conlan XA, Jones EA, Biddulph G, Lockyer NP, Vickerman JC. TOF-SIMS analysis using C-60-effect of impact energy on yield and damage. Anal. Chem. 2006;78:1827–1831. doi: 10.1021/ac051624w. [DOI] [PubMed] [Google Scholar]
- 13.Gillen G, Fahey A, Wagner M, Mahoney C. 3D molecular imaging SIMS. Appl. Surf. Sci. 2006;252:6537–6541. [Google Scholar]
- 14.Fletcher JS, Lockyer NP, Vaidyanathan S, Vickerman JC. TOF-SIMS 3D biomolecular imaging of Xenopus laevis oocytes using buckminsterfullerene (C-60) primary ions. Anal. Chem. 2007;79:2199–2206. doi: 10.1021/ac061370u. [DOI] [PubMed] [Google Scholar]
- 15.Mahoney CM. Depth profiling of poly(L-lactic acid)/triblock copolymer blends with time-of-flight secondary ion mass spectrometry. Anal. Chem. 2005;77:3570–3578. doi: 10.1021/ac048274i. [DOI] [PubMed] [Google Scholar]
- 16.Shard AG, Brewer PJ, Green FM, Gilmore IS. Measurement of sputtering yields and damage in C60SIMS depth profiling of model organic materials. Surf. Interface Anal. 2007;39:294–298. [Google Scholar]
- 17.Roberts G. Langmuir-Blodgett films. Plenum Press; New York, NY: 1990. [Google Scholar]
- 18.Blodgett KB. Films built by depositing successive monomolecular layers on a solid surface. J. Am. Chem. Soc. 1935;57:1007–1022. [Google Scholar]
- 19.Blodgett KB. Properties of built-up films of barium stearate. J. Phys. Chem. 1937;41:975–984. [Google Scholar]
- 20.Ha K, Ahn W, Rho S, Suh S, Synn D, Stelzle M, Rabolt JF. Characterization of orientation of perfluorostearic acid Langmuir-Blodgett multilayers by infrared spectroscopic methods. Thin Solid Films. 2000;372:223–229. [Google Scholar]
- 21.Lozano P, Fernandez AJ, Ruiz JJ, Camacho L, Martin MT, Munoz E. Molecular organization of LB multilayers of phospholipid and mixed phospholipid/viologen by FTIR spectroscopy. J. Phys. Chem. B. 2002;106:6507–6514. [Google Scholar]
- 22.Novak VR, Zhizhimontov VV, Belyayev AV, Bykov VA. Surface morphology of arachidic acid-Cd arachidate LB-films studied with SFM. Mol. Mater. 2000;12:111–123. [Google Scholar]
- 23.Ouyang JM, Li CA, Ling WH. Properties of bilirubin/stearic acid mixed monolayer and multilayers. Mol. Crystals Liquid Crystals Sci. Technol. A. 1999;337:129–132. [Google Scholar]
- 24.Takamoto DY, Aydil E, Zasadzinski JA, Ivanova AT, Schwartz DK, Yang TL, Cremer PS. Stable ordering in Langmuir-Blodgett films. Science. 2001;293:1292–1295. doi: 10.1126/science.1060018. [DOI] [PubMed] [Google Scholar]
- 25.Vitta S. Structural investigation of thin films and multilayers using X-ray scattering. Curr. Sci. 2000;79:61–69. [Google Scholar]
- 26.Kozole J, Winograd N. Fundamental Studies of the C60+ Bombardment of Silicon. Appl. Surf. Sci (submitted).
- 27.Wittmaack K, Laxhuber L, Mohwald H. Sample-Thickness Dependence and Chemical Effects in Sims Depth Profiling of Multilayer Langmuir-Blodgett-Films. Nucl. Instrum. Methods Phys. Res. B. 1987;18:639–643. [Google Scholar]
- 28.Postawa Z, Czerwinski B, Winograd N, Garrison BJ. Microscopic insights into the sputtering of thin organic films on Ag{111} induced by C-60 and Ga bombardment. J. Phys. Chem. B. 2005;109:11973–11979. doi: 10.1021/jp050821w. [DOI] [PubMed] [Google Scholar]
- 29.Russo MF, Szakal C, Kozole J, Winograd N, Garrison BJ. Sputtering yields for C-60 and Au-3 bombardment of water ice as a function of incident kinetic energy. Anal. Chem. 2007;79:4493–4498. doi: 10.1021/ac070105l. [DOI] [PMC free article] [PubMed] [Google Scholar]
- 30.Seah MP, Lea C. Depth Resolution in Composition Profiles by Ion Sputtering and Surface-Analysis for Single-Layer and Multilayer Structures on Real Substrates. Thin Solid Films. 1981;81:257–270. [Google Scholar]