

Abstract
Background:
Selenium, an essential micronutrient, has received considerable attention for its antioxidant properties. In addition, selenium may affect several cardiometabolic risk factors, such as glucose homeostasis and lipid concentrations. However, the effects of selenium intake on the lipid profile in selenium-replete populations, such as the United States, are largely unknown.
Objective:
We examined the relation of serum selenium concentrations with serum lipids in a representative sample of US adults.
Design:
This was a cross-sectional analysis of 5452 men and women aged ≥ 20 y participating in the third National Health and Nutrition Examination survey. Serum selenium was measured by atomic absorption spectrometry.
Results:
The multivariable adjusted differences in total cholesterol, LDL cholesterol, HDL cholesterol, apolipoprotein B (apo B), and apolipoprotein A-I (apo A-I) comparing the highest with the lowest quartile of serum selenium were 16.6 mg/dL (95% CI: 11.6, 21.4 mg/dL), 10.9 mg/dL (95% CI: 6.4, 15.4 mg/dL), 3.2 mg/dL (95% CI: 1.6, 5.0 mg/dL), 8.9 mg/dL (95% CI: 5.6, 12.2 mg/dL), and 6.9 mg/dL (95% CI: 1.7, 12.1 mg/dL), respectively. Participants in the highest quartile of serum selenium had 10% higher concentrations of triacylglycerols than did participants in the lowest quartile (ratio of triacylglycerol concentrations: 1.10; 95% CI: 1.05, 1.17). The difference in the ratios of LDL cholesterol to HDL cholesterol and apo B to apo A-I that compared the highest with the lowest selenium quartiles were 0.11 (95% CI: −0.02, 0.25) and 0.03 (95% CI: 0.00, 0.06), respectively.
Conclusion:
Elevated serum selenium was associated with elevated serum concentrations of total cholesterol, LDL cholesterol, HDL cholesterol, triacylglycerols, apo B, and apo A-I among US adults, a selenium-replete population. Experimental studies are needed to determine cause and effect relations and the potential mechanisms underlying these associations.
INTRODUCTION
Selenium, an essential micronutrient, has received considerable attention for its antioxidant properties mediated through glutathione peroxidases and other selenoproteins (1, 2). Glutathione peroxidase synthesis, however, plateaus with increasing selenium concentrations. In the United States, a country with relatively high selenium intake, 99% of US adults have serum selenium concentrations > 95 ng/mL (3), well above the concentration needed to maximize the activity of glutathione peroxidases. In selenium-replete populations such as the United States, other effects of selenium not related to its antioxidant properties may thus be the primary determinants of the beneficial or harmful effects of selenium intake population-wide.
In rats, selenium supplementation increased LDL-receptor activity and mRNA expression (4) and decreased β-hydroxy-β-methylglutaryl coenzyme A reductase mRNA expression, resulting in lower concentrations of total cholesterol, LDL cholesterol, and apolipoprotein B (apo B) (5). As a consequence, it was proposed that selenium intake may beneficially affect the lipid profile (4, 5). In humans, randomized trials of the effect of selenium intake or supplementation on lipid concentrations are limited to studies in which selenium was given in combination with other vitamins or minerals (6, 7) or to small short-term studies (8, 9). Observational studies of the association between selenium and lipids are inconsistent, finding positive associations of serum selenium with total cholesterol (6, 10-14), with LDL cholesterol (10, 14), or with HDL cholesterol or the ratio of HDL cholesterol to total cholesterol (HDL cholesterol:total cholesterol) (8, 14-17). Those studies were conducted mostly in populations with relatively low serum concentrations of selenium, and their generalizability to a selenium-replete population is uncertain (6-17).
Recent randomized and observational evidence indicate that high selenium exposure in selenium-replete populations may increase diabetes risk (18-20). Because of current interest in selenium for chronic disease prevention, it is important to understand the full range of effects of high selenium exposure on cardiovascular risk factors, including lipids. The objective of this analysis was thus to evaluate the association of serum selenium concentrations with serum lipid concentrations in US adults with the use of data from the third National Health and Nutrition Examination Survey (NHANES III).
SUBJECTS AND METHODS
NHANES III, conducted from 1988 to 1994, used a stratified multistage probability cluster design to obtain a representative sample of the civilian noninstitutionalized US population (21). For the present study, we selected 7129 participants from NHANES III, aged ≥20 y, who participated in the morning medical examinations and fasted ≥9 h. We then excluded 114 women who were pregnant at the time of the survey; 339 participants with missing serum selenium data; 179 participants with missing lipid concentrations or with triacylglycerols > 400 mg/dL, precluding LDL-cholesterol estimation; 538 participants with missing values on other variables of interest; and 507 participants with a history of cardiovascular disease or cancer. The final analyses were based on a total of 5452 NHANES III participants. In NHANES III, apolipoprotein A-I (apo A-I) and apo B were measured only during 1988–1991; therefore, apolipoprotein concentrations were only available on 2589 participants.
NHANES III study protocols were approved by the National Center for Health Statistics Institutional Review Board. Oral and written consent was obtained from all participants.
Data collection and measurements
The laboratory procedures and quality control methods for serum measurements of selenium, lipids, and apolipoprotein were described before (22, 23). To measure serum selenium, whole blood was collected in containers previously screened for selenium contamination. After clotting and centrifugation, serum was collected, frozen at −20 °C, and shipped to the laboratory. Serum selenium was measured with the use of atomic absorption spectrometry (22, 24, 25). The limit of detection was 8 ng/mL. The between-assay CV for quality control–pooled samples analyzed throughout the duration of the survey ranged from 4.0% to 6.4% (22).
Serum lipids were measured at the Lipoprotein Analytic Laboratory at the Johns Hopkins University in Baltimore, MD. Total cholesterol, triacylglycerols, and HDL cholesterol were measured with the use of a Hitachi 704 Analyzer and reagents from Roche/Boehringer Mannheim Diagnostics (Indianapolis, IN), and LDL-cholesterol concentrations were calculated with the use of the Friedewald formula (26). Apo A-I and apo B were measured by radial immunodiffusion or rate immunonephelometry, and results were converted to values based on the World Health Organization–International Federation of Clinical Chemistry and Laboratory Medicine International Reference Materials (23).
Other laboratory procedures were described in detail (22). In brief, serum C-reactive protein was measured by latex-enhanced nephelometry, a low-sensitivity assay, serum creatinine by the Jaffé-modified kinetic method, and serum cotinine by HPLC and atmospheric-pressure chemical ionization tandem mass spectrometry.
Information about age, sex, race-ethnicity, education, family income, menopausal status, cigarette smoking, alcohol consumption, physical activity, history of cardiovascular disease and cancer, use of cholesterol-lowering medication, and use of vitamin-mineral supplements was based on interview questionnaires (21). Body mass index (in kg/m2) was calculated. Diabetes mellitus was defined as a plasma glucose ≥ 126 mg/dL, a self-report of a physician diagnosis of diabetes, or current medication use. Glomerular filtration rate was estimated by the formula from the Modification of Diet in Renal Disease Study after alignment of serum creatinine concentration with the assay used to develop the formula (27, 28).
Statistical methods
Participants were divided into quartiles of serum selenium concentration based on the weighted population distribution. Serum triacylglycerol concentrations were markedly right skewed and were log10 transformed for statistical analyses. We used multivariable linear regression to estimate the differences (95% CIs) in concentrations of serum total cholesterol, LDL cholesterol, HDL cholesterol, log10-triacylglycerols, apo B, apo A-I, ratio of LDL cholesterol to HDL cholesterol, and ratio of apo B to apo A-I (apo B:apo A-I) comparing the 3 highest quartiles of serum selenium with the lowest quartile. Because triacylglycerols were log10-transformed, the results of the regression models for triacylglycerols are reported as ratios in triacylglycerol concentrations, comparing the 3 highest quartiles of serum selenium with the lowest quartile. To further explore the shape of the relation between serum selenium and serum lipids, we used restricted cubic splines with knots at the 5th, 35th, 65th, and 95th percentiles of the serum selenium distribution (29).
We fitted 3 models with progressive levels of adjustment. Model 1 was adjusted for age, sex, and race-ethnicity. Model 2 was further adjusted for education, family income, menopausal status, cigarette smoking, serum cotinine, alcohol consumption, physical activity, and body mass index. Model 3 was further adjusted for use of cholesterol-lowering medication, vitamin-mineral use, glomerular filtration rate, C-reactive protein, diabetes mellitus, thyroxin, and thyroid-stimulating hormone.
The association of serum selenium concentrations as a continuous variable with serum concentrations of LDL cholesterol, HDL cholesterol, and triacylglycerol was determined for subgroups defined by sex, age, race-ethnicity, smoking status, alcohol consumption, body mass index, vitamin-mineral supplement use, and cholesterol-lowering medication use. From those models we estimated the difference in lipid concentrations comparing the 80th (137.7 ng/mL) with the 20th (111.4 ng/mL) percentile of the selenium distribution, assuming a linear dose-response relation between selenium and LDL cholesterol, HDL cholesterol, and logtriacylglycerols. Although we used a comparison between the 80th and 20th percentiles, the statistical significance of these analyses would be the same if we had used other percentiles for comparison. P values for the interactions were obtained with the use of Wald tests. Data were analyzed with the use of SUDAAN (version 9.0; Research Triangle Institute, Research Triangle Park, NC) to account for the NHANES weights and complex design.
RESULTS
The mean serum concentration of selenium in study participants was 125.7 ng/mL. On average, participants with higher selenium concentrations were more likely to be men, non-Hispanic white, and high school educated (Table 1). Serum selenium concentrations were inversely associated with body mass index, C-reactive protein, and the prevalence of smoking.
Table 1.
Baseline characteristics of the study population by quartile (Q) of serum selenium concentrations (n = 5452)1
| Q1 (<113.7 ng/mL) |
Q2 (113.7–123.6 ng/mL) |
Q3 (123.7–134.6 ng/mL) |
Q4 (≥134.7 ng/mL) |
P for trend | |
|---|---|---|---|---|---|
| Age (y) | 42.8 ± 0.92 | 42.5 ± 0.6 | 43.2 ± 0.9 | 43.5 ± 0.9 | 0.46 |
| Sex, male (%) | 41.0 (2.2)3 | 43.7 (1.9) | 52.2 (2.0) | 54.2 (1.7) | <0.001 |
| Race (%) | |||||
| Non-Hispanic white | 68.3 (2.7) | 76.4 (2.2) | 78.9 (1.4) | 83.3 (2.4) | <0.001 |
| Non-Hispanic black | 16.9 (1.1) | 10.4 (0.8) | 7.8 (0.7) | 6.8 (1.0) | <0.001 |
| Mexican American | 5.3 (0.8) | 5.5 (0.5) | 5.8 (0.7) | 4.4 (0.8) | 0.50 |
| High school education (%) | 74.7 (1.9) | 77.1 (1.8) | 79.9 (1.8) | 80.5 (1.7) | <0.001 |
| Body mass index (kg/m2) | 27.0 ± 0.3 | 26.4 ± 0.3 | 26.4 ± 0.2 | 25.9 ± 0.2 | 0.01 |
| Current smoking (%) | 33.8 (2.0) | 30.6 (2.2) | 27.1 (1.8) | 20.9 (1.8) | <0.001 |
| Current alcohol consumption (%) | 62.8 (2.5) | 62.7 (2.3) | 67.7 (2.1) | 66.0 (3.4) | 0.28 |
| Hypertension (%) | 27.6 (1.9) | 25.2 (1.5) | 27.3 (1.4) | 28.9 (2.1) | 0.45 |
| Diabetes (%) | 4.6 (0.6) | 5.6 (0.9) | 4.9 (0.6) | 5.7 (0.9) | 0.44 |
| Vitamin-mineral supplement users (%) | 41.7 (2.6) | 41.3 (2.2) | 40.5 (2.1) | 42.1 (2.8) | 0.97 |
| C-reactive protein <0.03 mg/dL (%) | 69.3 (2.4) | 75.1 (2.0) | 77.5 (1.9) | 78.1 (2.2) | 0.008 |
| Serum selenium (ng/mL) | 105.9 ± 0.4 | 118.9 ± 0.1 | 128.9 ± 0.2 | 147.0 ± 0.9 | — |
Adjusted for age, sex, and race-ethnicity.
x̄ ± SE (all such values).
SE in parentheses (all such values).
Higher serum concentrations of selenium were associated with higher concentrations of serum lipids and apolipoproteins. The multivariable-adjusted differences in total cholesterol, LDL cholesterol, HDL cholesterol, apo B, and apo A-I, comparing the highest with the lowest quartile of serum selenium were 16.6 mg/dL (95% CI: 11.6, 21.4 mg/dL), 10.9 mg/dL (95% CI: 6.4, 15.4 mg/dL), 3.2 mg/dL (95% CI: 1.6, 5.0 mg/dL), 8.9 mg/dL (95% CI: 5.6, 12.2 mg/dL), and 6.9 mg/dL (95% CI: 1.7, 12.1 mg/dL), respectively (Table 2). After multivariable adjustment, participants in the highest quartile of serum selenium had 10% higher concentrations of triacylglycerols than did participants in the lowest quartile (ratio of triacylglycerol concentrations: 1.10; 95% CI: 1.05, 1.17) (Table 3. Spline regression models showed relatively linear increases in serum lipids and apolipoproteins by serum selenium concentrations (Figure 1). The multivariable-adjusted differences in LDL cholesterol:HDL cholesterol and apo B:apo A-I, comparing the highest with the lowest quartile of serum selenium, were 0.11 (95% CI: −0.02, 0.25) and 0.03 (95% CI: 0.00, 0.06), respectively (Table 4).
Table 2.
Difference (95% CI) in serum lipid and lipoprotein concentrations by quartile (Q) of serum selenium concentrations (n = 5452)1
| Q1 (<113.7 ng/mL) | Q2 (113.7–123.6 ng/mL) | Q3 (123.7–134.6 ng/mL) | Q4 (≥134.7 ng/mL) | P for trend | |
|---|---|---|---|---|---|
| Serum total cholesterol (mg/dL) | 192.62 | 198.7 | 202.9 | 208.8 | |
| Model 13 | 0.0 (reference) | 6.3 (1.7, 10.9) | 9.9 (6.4, 13.4) | 15.5 (10.1, 20.8) | <0.001 |
| Model 24 | 0.0 (reference) | 7.3 (2.7, 11.8) | 10.4 (7.1, 13.7) | 16.9 (11.9, 22.0) | <0.001 |
| Model 35 | 0.0 (reference) | 7.2 (2.6, 11.8) | 10.0 (6.7, 13.4) | 16.6 (11.6, 21.4) | <0.001 |
| Serum LDL cholesterol (mg/dL) | 120.3 | 124.0 | 128.2 | 131.1 | |
| Model 13 | 0.0 (reference) | 3.7 (−0.9, 8.2) | 6.9 (2.8, 11.0) | 9.5 (4.6, 14.3) | <0.001 |
| Model 24 | 0.0 (reference) | 4.8 (0.3, 9.3) | 7.9 (4.1, 11.8) | 11.3 (6.7, 15.8) | <0.001 |
| Model 35 | 0.0 (reference) | 4.7 (0.2, 9.2) | 7.5 (3.7, 11.4) | 10.9 (6.4, 15.4) | <0.001 |
| Serum HDL cholesterol (mg/dL) | 49.1 | 50.8 | 49.8 | 52.1 | |
| Model 13 | 0.0 (reference) | 2.2 (0.7, 3.8) | 2.2 (0.5, 4.0) | 4.7 (2.5, 6.9) | <0.001 |
| Model 24 | 0.0 (reference) | 1.6 (0.2, 3.0) | 1.1 (−0.4, 2.6) | 3.1 (1.4, 4.8) | 0.001 |
| Model 35 | 0.0 (reference) | 1.6 (0.2, 3.1) | 1.2 (−0.3, 2.6) | 3.2 (1.6, 5.0) | <0.001 |
| Serum apo B (mg/dL)6 | 99.8 | 101.4 | 105.9 | 106.2 | |
| Model 13 | 0.0 (reference) | 1.8 (−1.4, 5.0) | 5.5 (1.5, 9.5) | 5.7 (1.5, 9.8) | 0.009 |
| Model 24 | 0.0 (reference) | 3.5 (0.0, 6.9) | 7.0 (3.8, 10.2) | 9.1 (5.9, 12.3) | <0.001 |
| Model 35 | 0.0 (reference) | 3.5 (0.1, 6.9) | 7.0 (4.0, 10.4) | 8.9 (5.6, 12.2) | <0.001 |
| Serum apo A-I (mg/dL)6 | 140.0 | 144.1 | 140.1 | 147.8 | |
| Model 14 | 0.0 (reference) | 4.7 (1.0, 8.4) | 3.2 (0.1, 6.3) | 9.9 (4.3, 15.5) | 0.001 |
| Model 25 | 0.0 (reference) | 3.3 (−0.4, 6.9) | 1.1 (−1.7, 4.0) | 6.9 (1.5, 12.2) | 0.02 |
| Model 35 | 0.0 (reference) | 3.1 (−0.6, 6.8) | 1.1 (−1.6, 3.8) | 6.9 (1.7, 12.1) | 0.01 |
Apo B, apolipoprotein B; apo A-I, apolipoprotein A-I.
x̄ within each quartile (all such values).
Adjusted for age (continuous), sex (male, female), and race-ethnicity (non-Hispanic white, non-Hispanic black, Mexican American, other).
Further adjusted for education (≥12 y of school completed, <12 y of school completed), family income (≥$20 000,<$20 000), postmenopausal status for women (yes, no), cigarette smoking (current, former, never), serum cotinine (continuous), alcohol consumption (current, former, never), physical activity (0, 1-2, ≥3 times/wk), and body mass index (continuous).
Further adjusted for cholesterol-lowering medication use (yes, no), vitamin-mineral supplement use (yes, no), glomerular filtration rate (continuous), C-reactive protein (≥1.0 mg/dL, 0.3-0.9 mg/dL, <0.3 mg/dL), diabetes mellitus (yes, no), thyroid-stimulating hormone (continuous), and thyroxine (continuous).
Analysis based on subsample of 2589 participants because apo B and apoA-I were only measured during 1988-1991.
Table 3.
Ratio (95% CI) of serum triacylglycerol concentrations by quartile (Q) of serum selenium concentrations (n = 5452)
| Q1 (<113.7 ng/mL) | Q2 (113.7–123.6 ng/mL) | Q3 (123.7–134.6 ng/mL) | Q4 (≥134.7 ng/mL) | P for trend | |
|---|---|---|---|---|---|
| Serum triacylglycerols (mg/dL) | 101.11 | 104.3 | 110.8 | 111.9 | |
| Model 12 | 1.00 (reference) | 1.02 (0.95, 1.07) | 1.05 (1.00, 1.12) | 1.05 (1.00, 1.12) | 0.06 |
| Model 23 | 1.00 (reference) | 1.05 (0.98, 1.10) | 1.10 (1.02, 1.15) | 1.12 (1.07, 1.17) | <0.001 |
| Model 34 | 1.00 (reference) | 1.05 (0.98, 1.10) | 1.07 (1.02, 1.15) | 1.10 (1.05, 1.17) | <0.001 |
Geometric x within each quartile (all such values).
Adjusted for age (continuous), sex (male, female), and race-ethnicity (non-Hispanic white, non-Hispanic black, Mexican American, other).
Further adjusted for education (≥12 y of school completed, <12 y of school completed), family income (≥$20 000, <$20 000), postmenopausal status for women (yes, no), cigarette smoking (current, former, never), serum cotinine (continuous), alcohol consumption (current, former, never), physical activity (0, 1-2, ≥3 times/wk), and body mass index (continuous).
Further adjusted for cholesterol-lowering medication use (yes, no), vitamin-mineral supplement use (yes, no), glomerular filtration rate (continuous), C-reactive protein (≥1.0 mg/dL, 0.3-0.9 mg/dL, <0.3 mg/dL), diabetes mellitus (yes, no), thyroid-stimulating hormone (continuous), and thyroxine (continuous).
FIGURE 1.
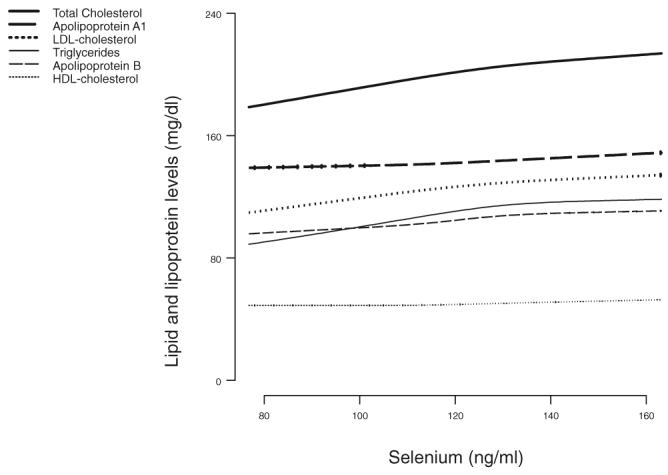
Serum lipid and lipoprotein concentrations by serum selenium concentrations, Third National Health and Nutrition Examination Survey. Dose-response lines are based on restricted cubic spline transformations with 4 knots. Results were adjusted for education, family income, postmenopausal status for women, cigarette smoking, serum cotinine, alcohol consumption, physical activity, body mass index, cholesterol-lowering medication use, vitamin-mineral supplement use, glomerular filtration rate, C-reactive protein, diabetes mellitus, thyroid-stimulating hormone, and thyroxine.
TABLE 4.
Difference (95% CI) in the ratio of LDL cholesterol to HDL cholesterol (LDL cholesterol:HDL cholesterol) and in the ratio of apolipoprotein B to apolipoprotein A-I (apo B:apo A-I) by quartile (Q) of serum selenium concentrations (n = 5452)
| Q1 (<113.7 ng/mL) | Q2 (113.7–123.6 ng/mL) | Q3 (123.7–134.6 ng/mL) | Q4 (≥134.7 ng/mL) | P for trend | |
|---|---|---|---|---|---|
| Serum LDL cholesterol:HDL cholesterol | 2.691 | 2.67 | 2.83 | 2.81 | |
| Model 12 | 0.00 (reference) | −0.05 (−0.18, 0.08) | 0.04 (−0.13, 0.20) | 0.00 (−0.18, 0.17) | 0.78 |
| Model 23 | 0.00 (reference) | 0.01 (−0.13, 0.14) | 0.12 (−0.03, 0.27) | 0.12 (−0.01, 0.25) | 0.02 |
| Model 34 | 0.00 (reference) | 0.00 (−0.13, 0.14) | 0.11 (−0.04, 0.27) | 0.11 (−0.02, 0.25) | 0.04 |
| Serum apo B:apo A-I5 | 0.74 | 0.73 | 0.78 | 0.74 | |
| Model 12 | 0.00 (reference) | −0.01 (−0.04, 0.02) | 0.02 (−0.02, 0.06) | −0.01 (−0.05, 0.03) | 0.97 |
| Model 23 | 0.00 (reference) | 0.01 (−0.03, 0.05) | 0.04 (0.01, 0.07) | 0.03 (0.00, 0.06) | 0.009 |
| Model 34 | 0.00 (reference) | 0.01 (−0.02, 0.05) | 0.05 (0.02, 0.08) | 0.03 (0.00, 0.06) | 0.009 |
x̄ within each quartile (all such values).
Adjusted for age (continuous), sex (male, female), and race-ethnicity (non-Hispanic white, non-Hispanic black, Mexican American, other).
Further adjusted for education (≥12 y of school completed, <12 y of school completed), family income (≥$20 000, <$20 000), postmenopausal status for women (yes, no), cigarette smoking (current, former, never), serum cotinine (continuous), alcohol consumption (current, former, never), physical activity (0, 1-2, ≥3 times/wk), and body mass index (continuous).
Further adjusted for cholesterol-lowering medication use (yes, no), vitamin-mineral supplement use (yes, no), glomerular filtration rate (continuous), C-reactive protein (≥1.0 mg/dL, 0.3-0.9 mg/dL, <0.3 mg/dL), diabetes mellitus (yes, no), thyroid-stimulating hormone (continuous), and thyroxine (continuous).
Analysis based on subsample of 2589 participants because apo B and apo A-I were only measured during 1988-1991.
When the associations of serum selenium concentrations with serum LDL cholesterol, HDL cholesterol, and triacylglycerols were evaluated by study subgroups (Figure 2 and Figure 3), none of the interactions were statistically significant except for the interaction of serum selenium and sex on serum HDL cholesterol (P < 0.001) and the interaction of serum selenium and race on serum HDL cholesterol (P = 0.03).
FIGURE 2.

Differences in serum concentrations of LDL cholesterol and HDL cholesterol comparing the 80th (137.7 ng/mL) with the 20th (111.4 ng/mL) percentile of the serum selenium distribution. Differences (95% CI in parentheses) in concentrations of serum LDL cholesterol and HDL cholesterol were derived from multiple linear regression models that included serum selenium concentrations as a continuous variable. Differences were adjusted for age, sex, race-ethnicity, education, family income, postmenopausal status for women, cigarette smoking, serum cotinine, alcohol consumption, physical activity, body mass index, cholesterol-lowering medication use, vitamin-mineral supplement use, glomerular filtration rate, C-reactive protein, diabetes mellitus, thyroid-stimulating hormone, and thyroxine. The area of each square is proportional to the inverse of the variance. Horizontal lines represent 95% CIs. None of the P values for the interactions was statistically significant at the 0.05 level, except for the interaction of serum selenium and sex on serum HDL cholesterol (P < 0.001) and the interaction of serum selenium and race on serum HDL cholesterol (P = 0.03). Although we used a comparison between the 80th and 20th percentiles, the statistical significance of these analyses would be the same if we had used other percentiles for comparison.
FIGURE 3.

Ratios of serum triacylglycerol concentrations comparing the 80th (137.7 ng/mL) with the 20th (111.4 ng/mL) percentile of the serum selenium distribution. Ratios (95% CI in parentheses) of triacylglycerol concentrations were derived from multiple linear regression models that included serum selenium concentrations as a continuous variable. Ratios were adjusted for age, sex, race-ethnicity, education, family income, postmenopausal status for women, cigarette smoking, serum cotinine, alcohol consumption, physical activity, body mass index, cholesterol-lowering medication use, vitamin-mineral supplement use, glomerular filtration rate, C-reactive protein, diabetes mellitus, thyroid-stimulating hormone, and thyroxine. The area of each square is proportional to the inverse of the variance. Horizontal lines represent 95% CIs. None of the P values for the interactions was statistically significant at the 0.05 level. Although we used a comparison between the 80th and 20th percentiles, the statistical significance of these analyses would be the same if we had used other percentiles for comparison.
DISCUSSION
In this large cross-sectional study, conducted in a representative sample of the US population, serum selenium concentrations were positively associated with serum concentrations of total cholesterol, LDL cholesterol, HDL cholesterol, apo B, apo A-I, and triacylglycerols. The associations were moderately strong and relatively linear, and they persisted after adjustment for age, sex, race, thyroid hormone concentrations, supplement use, or other traditional cardiovascular risk factors. The rigorous methods and the detailed quality control procedures of NHANES III, the large sample size, and the representative nature of the population sample add to the strength of these findings.
Serum selenium concentrations were also positively associated with total-cholesterol concentrations in several cross-sectional studies conducted in Denmark (11), France (6, 14), Italy (13), Norway (only among women) (12), and Spain (10). In those studies, average serum concentrations of selenium ranged from 76 ng/mL (10) to 125 ng/mL (12). Three small studies conducted in the Netherlands (n = 82) (30), Portugal (n = 126) (15), and Finland and Japan (n = 60) (31) reported no relation between serum concentrations of selenium and total cholesterol. Another small study of Japanese women (n = 127) found a positive relation of serum concentrations of selenium with total cholesterol among premenopausal women but not among postmenopausal women (32). Finally, in 142 women from Korea (16), participants in the highest selenium quartile had lower concentrations of total cholesterol, although the associations were not adjusted by age, and selenium concentrations were inversely related to age in that study. Except in a few small studies that were subject to greater random variability, the association of selenium with total-cholesterol concentrations seems largely consistent across populations.
Few studies have evaluated the association of serum selenium with the different components of the lipid profile, and the relations appear to differ across studies. For instance, 1 study reported a positive association between selenium and LDL cholesterol (10), whereas 2 studies reported no association (14, 17); 2 studies reported a positive association with HDL cholesterol (14, 17), whereas 2 other studies did not (11, 13). Small sample sizes and selective reporting of findings may explain some of those inconsistencies. Moreover, none of the studies that evaluated triacylglycerols found a positive association with serum selenium concentrations (6, 11-13). Specifically, the SU.VI.MAX study found no association between selenium and triacylglycerols. Selenium concentrations in the SU.VI.MAX study (x̄ ± SD: 89.6 ± 15.8 ng/mL in men; 85.7 ± 15.0 ng/mL in women) were substantially lower than those in NHANES III. This finding could reflect a differential association of selenium with serum lipids in selenium-deficient compared with selenium-replete populations.
Evidence from randomized clinical trials on the effects of selenium supplementation on the lipid profile is limited. In 2 large trials, selenium supplementation was administered in combination with other vitamins and minerals (6, 7), and the effects of selenium cannot be isolated. The SU.VI.MAX study randomly assigned participants to 100 μg selenium, 120 mg vitamin C, 30 mg vitamin E, and 20 mg zinc or to placebo and followed them for 7.5 y. At the end of follow-up, women in the active intervention group had higher concentrations of total cholesterol and men were more likely to use lipid-lowering medication than were participants in the placebo group (6). In the Shandong Intervention Trial in Linqu County, China, 204 adults receiving 37.5 μg selenium, 250 mg vitamin C, and 100 IU vitamin E for 7.3 y had higher concentrations of total cholesterol and LDL cholesterol at the end of follow-up than did participants receiving placebo (7). No differences were observed in HDL-cholesterol concentrations. Two small trials have evaluated the lipid effects of selenium alone in supplements. In China, 40 healthy tin miners were randomly assigned to supplements with 300 μg selenium or placebo and followed for 1 y (9). At the end of follow-up, cholesterol concentrations were higher in the selenium group (153 ± 91.2 mg/dL) than in the placebo group (145 ± 95.7 mg/dL), although this difference was not statistically significant. Finally, a small Finnish trial randomly assigned 27 healthy medical students to selenium (96 μg/d) or to placebo for 2 wk. This short course of selenium had no effect on concentrations of total cholesterol, HDL cholesterol, or triacylglycerol or on HDL cholesterol:total cholesterol (8).
The mechanisms underlying the association of serum selenium with lipid concentrations are unclear. Selenium could affect lipid concentrations, although the mechanisms proposed so far point to decreasing total-cholesterol concentrations with increasing selenium. In rats, supplementation with 1 μg/g Se increased LDL-receptor activity and mRNA expression, an effect hypothesized to be mediated through type I 5′-iodothyronine deiodinase. Iodothyronine deiodinases are selenoproteins involved in activating thyroxine to triiodothyronine, which increases LDL-receptor gene expression (4). In our study, the association between selenium and lipid concentrations did not change after adjustment for concentrations of thyroid-stimulating hormone and thyroxin. Also in rats, supplementation with 1 ppm selenium decreased apo B concentrations and mRNA expression of β-hydroxy-β-methylglutaryl coenzyme A reductase, the rate-limiting enzyme in hepatic cholesterol synthesis (5, 33).
Alternatively, increased selenium and lipid concentrations could be the consequence of a common exposure. Selenium is incorporated into selenoproteins as selenocysteine (1, 34). Selenoproteins, including glutathione peroxidases, iodothyronine deiodinases, selenoprotein P, and thioredoxin reductase, are responsible for the biological functions of selenium (1, 3). Above selenium levels needed to maximize serum selenoprotein concentration and activity (70–90 ng/mL Se in serum or plasma), increases in serum selenium, however, reflect the nonspecific incorporation of selenomethionine replacing methionine in albumin and other serum proteins (3, 35, 36). Because 99% of the NHANES III participants had serum selenium > 95 ng/mL (3), variation in selenium concentrations in our study population probably reflect variation in selenomethionine concentrations but not selenoprotein activity. The association between selenium and lipid concentrations could then be driven by a common dietary factor or by general overnutrition, but this association was not modified after adjustment for body mass index or use of vitamin-mineral supplements.
Because of our cross-sectional design, we cannot determine the cause and effect relation of the association between selenium and lipid concentrations. Mechanistic studies, conducted in populations with different selenium repletion status, are needed to establish the causal effect of selenium on lipid concentrations. In the United States and in other populations with high selenium exposure, those studies will help clarify the potential chronic toxicity of selenium concentrations in the high-normal range. Indeed, selenium is known to have a relatively narrow therapeutic range, and its toxicity is partly related to the ability of some selenium compounds to generate reactive oxygen species (37-39). The tolerable upper intake amount for selenium has been set at 400 μg/d by the Institute of Medicine to avoid visible symptoms of selenium toxicity in sensitive persons (3). Unfavorable effects of selenium on serum lipids and possibly on diabetes risk (18-20) in selenium-replete populations, such as the United States, could explain the lack of beneficial effects of selenium on coronary heart disease in studies conducted in the United States (40-43).
In conclusion, high serum concentrations of selenium were associated with high serum concentrations of total cholesterol, LDL cholesterol, HDL cholesterol, triacylglycerols, apo B, and apo A-I among US adults, a selenium-replete population. Ongoing trials of selenium supplements should monitor serum lipid and apolipoprotein concentrations (44, 45). Additional studies are also needed to determine cause and effect relations and potential mechanisms across a wide range of selenium exposures.
Acknowledgments
The author's responsibilities were as follows—JB, AN-A, and EG: conception, design, collection and assembly of data, analysis and interpretation of the data, statistical expertise, and drafting of the article; JB, AN-A, SS, AM, ERM, and EG: critical revision of the article for important intellectual content and final approval of the article. None of the authors had a personal or financial conflict of interest.
Footnotes
Supported by grants from the National Institute of Environmental Health Sciences (1 R01 ES012673) and the American Heart Association (0230232N).
REFERENCES
- 1.Rayman MP. The importance of selenium to human health. Lancet. 2000;356:233–41. doi: 10.1016/S0140-6736(00)02490-9. [DOI] [PubMed] [Google Scholar]
- 2.Navas-Acien A, Bleys J, Guallar E. Selenium intake and cardiovascular risk: what is new? Curr Opin Lipidol. 2008;19:43–9. doi: 10.1097/MOL.0b013e3282f2b261. [DOI] [PubMed] [Google Scholar]
- 3.Food and Nutrition Board, Institute of Medicine . A report of the Panel on Dietary Antioxidants and Related Compounds, Subcommittees on Upper Reference Levels of Nutrients and Interpretation and Uses of Dietary Reference Intakes, and the Standing Committee on the Scientific Evaluation of Dietary Reference Intakes. National Academy Press; Washington, DC: 2000. Dietary reference in-takes for vitamin C, vitamin E, selenium, and carotenoids. [Google Scholar]
- 4.Dhingra S, Bansal MP. Hypercholesterolemia and LDL receptor mRNA expression: modulation by selenium supplementation. Biometals. 2006;19:493–501. doi: 10.1007/s10534-005-5393-z. [DOI] [PubMed] [Google Scholar]
- 5.Dhingra S, Bansal MP. Modulation of hypercholesterolemia-induced alterations in apolipoprotein B and HMG-CoA reductase expression by selenium supplementation. Chem Biol Interact. 2006;161:49–56. doi: 10.1016/j.cbi.2006.02.008. [DOI] [PubMed] [Google Scholar]
- 6.Hercberg S, Bertrais S, Czernichow S, et al. Alterations of the lipid profile after 7.5 years of low-dose antioxidant supplementation in the SU. VI.MAX Study. Lipids. 2005;40:335–42. doi: 10.1007/s11745-006-1391-3. [DOI] [PubMed] [Google Scholar]
- 7.Zhang L, Gail MH, Wang YQ, et al. A randomized factorial study of the effects of long-term garlic and micronutrient supplementation and of 2-wk antibiotic treatment for Helicobacter pylori infection on serum cholesterol and lipoproteins. Am J Clin Nutr. 2006;84:912–9. doi: 10.1093/ajcn/84.4.912. [DOI] [PubMed] [Google Scholar]
- 8.Luoma PV, Sotaniemi EA, Korpela H, Kumpulainen J. Serum selenium, glutathione peroxidase activity and high-density lipoprotein cholesterol–effect of selenium supplementation. Res Commun Chem Pathol Pharmacol. 1984;46:469–72. [PubMed] [Google Scholar]
- 9.Yu SY, Mao BL, Xiao P, et al. Intervention trial with selenium for the prevention of lung cancer among tin miners in Yunnan, China. A pilot study Biol Trace Elem Res. 1990;24:105–8. doi: 10.1007/BF02917199. [DOI] [PubMed] [Google Scholar]
- 10.Gamez C, Ruiz-Lopez D, Artacho R, Navarro M, Puerta A, Lopez C. Serum selenium in institutionalized elderly subjects and relation to other nutritional markers. Clin Chem. 1997;43:693–4. [PubMed] [Google Scholar]
- 11.Suadicani P, Hein HO, Gyntelberg F. Serum selenium concentration and risk of ischaemic heart disease in a prospective cohort study of 3000 males. Atherosclerosis. 1992;96:33–42. doi: 10.1016/0021-9150(92)90035-f. [DOI] [PubMed] [Google Scholar]
- 12.Ringstad J, Jacobsen BK, Thomassen Y. The Tromso Heart Study: relationships between the concentration of selenium in serum and risk factors for coronary heart disease. J Trace Elem Electrolytes Health Dis. 1987;1:27–31. [PubMed] [Google Scholar]
- 13.Jossa F, Trevisan M, Krogh V, et al. Serum selenium and coronary heart disease risk factors in southern Italian men. Atherosclerosis. 1991;87:129–34. doi: 10.1016/0021-9150(91)90015-u. [DOI] [PubMed] [Google Scholar]
- 14.Coudray C, Roussel AM, Mainard F, Arnaud J, Favier A. Lipid peroxidation level and antioxidant micronutrient status in a pre-aging population; correlation with chronic disease prevalence in a French epidemiological study (Nantes, France) J Am Coll Nutr. 1997;16:584–91. [PubMed] [Google Scholar]
- 15.Viegas-Crespo AM, Neve J, Monteiro ML, Amorim MF, Paulo OS, Halpern MJ. Selenium and lipid parameters in plasma of Portuguese subjects. J Trace Elem Electrolytes Health Dis. 1994;8:119–22. [PubMed] [Google Scholar]
- 16.Lee O, Moon J, Chung Y. The relationship between serum selenium levels and lipid profiles in adult women. J Nutr Sci Vitaminol (Tokyo) 2003;49:397–404. doi: 10.3177/jnsv.49.397. [DOI] [PubMed] [Google Scholar]
- 17.Salonen JT, Salonen R, Seppanen K, et al. Relationship of serum selenium and antioxidants to plasma lipoproteins, platelet aggregability and prevalent ischaemic heart disease in Eastern Finnish men. Atherosclerosis. 1988;70:155–60. doi: 10.1016/0021-9150(88)90109-8. [DOI] [PubMed] [Google Scholar]
- 18.Bleys J, Navas-Acien A, Guallar E. Selenium and diabetes: more bad news for supplements. Ann Intern Med. 2007;147:271–2. doi: 10.7326/0003-4819-147-4-200708210-00177. [DOI] [PubMed] [Google Scholar]
- 19.Stranges S, Marshall JR, Natarajan R, et al. Effects of long-term selenium supplementation on the incidence of type 2 diabetes: a randomized trial. Ann Intern Med. 2007;147:217–23. doi: 10.7326/0003-4819-147-4-200708210-00175. [DOI] [PubMed] [Google Scholar]
- 20.Bleys J, Navas-Acien A, Guallar E. Serum selenium and diabetes in U.S. adults. Diabetes Care. 2007;30:829–34. doi: 10.2337/dc06-1726. [DOI] [PubMed] [Google Scholar]
- 21.National Center for Health Statistics . Plan and operation of the Third National Health and Nutrition Examination Survey, 1988-1994. US Department of Health and Human Services; Hyattsvlle, MD: 1994. Publication 94–1308. [Google Scholar]
- 22.Gunther EW, Lewis BL, Koncikowski SM. Laboratory procedures used for the Third National Health and Nutrition Examination Survey (NHANES III) 1988–1994. US Department of Health and Human Services; Atlanta, GA: 1996. [Google Scholar]
- 23.Bachorik PS, Lovejoy KL, Carroll MD, Johnson CL, Albers JJ, Marcovina SM. Measurement of apolipoproteins A-I and B during the National Health and Nutrition Examination Survey (NHANES) III. Clin Chem. 1994;40:1915–20. [PubMed] [Google Scholar]
- 24.Lewis SA, Hardison NW, Veillon C. Comparison of isotope dilution mass spectrometry and graphite furnace atomic absorption spectrometry with Zeeman background correction for determination of plasma selenium. Anal Chem. 1986;58:1272–3. doi: 10.1021/ac00297a070. [DOI] [PubMed] [Google Scholar]
- 25.Paschal DC, Kimberly MM. Automated direct determination of selenium in serum by electrothermal atomic absorption spectroscopy. Atomic Spectrosc. 1986;7:75–8. [Google Scholar]
- 26.Friedewald WT, Levy RI, Fredrickson DS. Estimation of the concentration of low-density lipoprotein cholesterol in plasma, without use of the preparative ultracentrifuge. Clin Chem. 1972;18:499–502. [PubMed] [Google Scholar]
- 27.Coresh J, Astor BC, McQuillan G, et al. Calibration and random variation of the serum creatinine assay as critical elements of using equations to estimate glomerular filtration rate. Am J Kidney Dis. 2002;39:920–9. doi: 10.1053/ajkd.2002.32765. [DOI] [PubMed] [Google Scholar]
- 28.Levey AS, Bosch JP, Lewis JB, Greene T, Rogers N, Roth D. A more accurate method to estimate glomerular filtration rate from serum creatinine: a new prediction equation. Modification of Diet in Renal Disease Study Group. Ann Intern Med. 1999;130:461–70. doi: 10.7326/0003-4819-130-6-199903160-00002. [DOI] [PubMed] [Google Scholar]
- 29.Greenland S. Dose-response and trend analysis in epidemiology: alternatives to categorical analysis. Epidemiology. 1995;6:356–65. doi: 10.1097/00001648-199507000-00005. [DOI] [PubMed] [Google Scholar]
- 30.Bukkens SG, de Vos N, Kok FJ, Schouten EG, de Bruijn AM, Hofman A. Selenium status and cardiovascular risk factors in healthy Dutch subjects. J Am Coll Nutr. 1990;9:128–35. doi: 10.1080/07315724.1990.10720361. [DOI] [PubMed] [Google Scholar]
- 31.Koskinen T, Pyykko K, Kudo R, Jokela H, Punnonen R. Serum selenium, vitamin A, vitamin E and cholesterol concentrations in Finnish and Japanese postmenopausal women. Int J Vitam Nutr Res. 1987;57:111–4. [PubMed] [Google Scholar]
- 32.Karita K, Yamanouchi Y, Takano T, Oku J, Kisaki T, Yano E. Associations of blood selenium and serum lipid levels in Japanese premenopausal and postmenopausal women. Menopause. 2008;15:119–24. doi: 10.1097/gme.0b013e31806bf32c. [DOI] [PubMed] [Google Scholar]
- 33.Nassir F, Moundras C, Bayle D, et al. Effect of selenium deficiency on hepatic lipid and lipoprotein metabolism in the rat. Br J Nutr. 1997;78:493–500. doi: 10.1079/bjn19970166. [DOI] [PubMed] [Google Scholar]
- 34.Finley JW. Bioavailability of selenium from foods. Nutr Rev. 2006;64:146–51. doi: 10.1111/j.1753-4887.2006.tb00198.x. [DOI] [PubMed] [Google Scholar]
- 35.Burk RF. Selenium, an antioxidant nutrient. Nutr Clin Care. 2002;5:75–9. doi: 10.1046/j.1523-5408.2002.00006.x. [DOI] [PubMed] [Google Scholar]
- 36.Hill KE, Xia Y, Akesson B, Boeglin ME, Burk RF. Selenoprotein P concentration in plasma is an index of selenium status in selenium-deficient and selenium-supplemented Chinese subjects. J Nutr. 1996;126:138–45. doi: 10.1093/jn/126.1.138. [DOI] [PubMed] [Google Scholar]
- 37.Spallholz JE. On the nature of selenium toxicity and carcinostatic activity. Free Radic Biol Med. 1994;17:45–64. doi: 10.1016/0891-5849(94)90007-8. [DOI] [PubMed] [Google Scholar]
- 38.Spallholz JE, Palace VP, Reid TW. Methioninase and selenomethionine but not Se-methylselenocysteine generate methylselenol and superoxide in an in vitro chemiluminescent assay: implications for the nutritional carcinostatic activity of selenoamino acids. Biochem Pharmacol. 2004;67:547–54. doi: 10.1016/j.bcp.2003.09.004. [DOI] [PubMed] [Google Scholar]
- 39.Drake EN. Cancer chemoprevention: selenium as a prooxidant, not an antioxidant. Med Hypotheses. 2006;67:318–22. doi: 10.1016/j.mehy.2006.01.058. [DOI] [PubMed] [Google Scholar]
- 40.Flores-Mateo G, Navas-Acien A, Pastor-Barriuso R, Guallar E. Selenium and coronary heart disease: a meta-analysis. Am J Clin Nutr. 2006;84:762–73. doi: 10.1093/ajcn/84.4.762. [DOI] [PMC free article] [PubMed] [Google Scholar]
- 41.Stranges S, Marshall JR, Trevisan M, et al. Effects of selenium supplementation on cardiovascular disease incidence and mortality: secondary analyses in a randomized clinical trial. Am J Epidemiol. 2006;163:694–9. doi: 10.1093/aje/kwj097. [DOI] [PubMed] [Google Scholar]
- 42.Bleys J, Navas-Acien A, Guallar E. Serum selenium levels and all-cause, cancer, and cardiovascular mortality among US adults. Arch Intern Med. 2008;168:404–10. doi: 10.1001/archinternmed.2007.74. [DOI] [PubMed] [Google Scholar]
- 43.Bleys J, Miller ER, III, Pastor-Barriuso R, Appel LJ, Guallar E. Vitamin-mineral supplementation and the progression of atherosclerosis: a meta-analysis of randomized controlled trials. Am J Clin Nutr. 2006;84:880–7. doi: 10.1093/ajcn/84.4.880. [DOI] [PubMed] [Google Scholar]
- 44.Lippman SM, Goodman PJ, Klein EA, et al. Designing the Selenium and Vitamin E Cancer Prevention Trial (SELECT) J Natl Cancer Inst. 2005;97:94–102. doi: 10.1093/jnci/dji009. [DOI] [PubMed] [Google Scholar]
- 45.Marshall JR, Sakr W, Wood D, et al. Design and progress of a trial of selenium to prevent prostate cancer among men with high-grade prostatic intraepithelial neoplasia. Cancer Epidemiol Biomarkers Prev. 2006;15:1479–84. doi: 10.1158/1055-9965.EPI-05-0585. [DOI] [PubMed] [Google Scholar]