Abstract
We have used amperometric measurements in a model system consisting of two liposomes connected with a membrane nanotube to monitor catechol release during artificial exocytosis and thereby to elucidate the effect of small-chain alcohols on this dynamic membrane process. To determine the rate of membrane shape change, catechol release during membrane distention was monitored amperometrically, and the presence of alcohols in the buffer was shown to accelerate the membrane distention process in a concentration-dependent manner. Compression isotherms for the same lipid composition in the absence and presence of ethanol and 1-propanol were measured to determine how these short-chain alcohols affect the lipid packing in monolayers. The isotherms show a marked decrease in lipid packing density that is dependent on the particular alcohol and its concentration. Comparison of the electrochemical and isotherm results suggests a correlation between decreasing lipid packing density and increasing rates of membrane shape change.
Introduction
Ethanol is among the most abused substances the world around, leading to issues of alcohol dependency, tolerance, and withdrawal. However, the exact mechanism through which ethanol imparts its sedative, intoxicating, and addictive effects is still a matter of debate. One possible explanation is that ethanol acts specifically on cellular receptors and other membrane proteins, examples of which include ethanol enhancement of GABAA receptor responses1-3 and inhibition of NMDA-type glutamate receptors.4,5 An alternative or expanded hypothesis is that alcohol partitioning into the membrane leads to an increase in lipid disorder, which in turn could alter membrane protein function.6-9 Initial experiments aimed at this hypothesis focused solely on the membrane properties of cells from animals that had been exposed to ethanol. Goldstein and co-workers discovered increased membrane fluidity in mouse synaptosomal membranes upon ethanol exposure.10 Curiously, the increase in fluidity disappeared in mice given long-term ethanol treatments, suggesting a membranous basis for alcohol tolerance.9
Since ethanol and other short-chain alcohols show effects on both membranes and membrane proteins, studies on the physicochemical interactions of alcohols with biomolecules and macromolecular biological assemblies (in this study, lipid bilayers) are becoming crucial to the furthering of our understanding of the complex interactions that alcohols have inside, outside, and on the surface of cells. The prevailing theory, resulting largely from spectroscopic and fluorescence data, is that short-chain alcohols will partition into a membrane and reside in a lipid bilayer near the head group, with the hydroxyl group pointing toward the aqueous environment and the alkane portion of the alcohol molecule oriented toward the hydrophobic interior of the membrane.11,12
Previous work on model systems has also shown that short-chain alcohols can alter the mechanical (bending and stretching) properties of lipid bilayers.13 In these studies Ly and Longo used a micropipet aspiration method to measure changes in the properties of giant stearoyloleoylphosphatidylcholine (SOPC) vesicles, determining that the presence of linear alcohols decreases the membrane bending modulus, decreases lysis tension, and increases the area occupied by each lipid molecule.14 It should be noted that these changes were positively correlated with the alcohol concentration and length of the alcohol alkane chain. Other groups have observed an increase in the rate of lateral lipid diffusion, a decrease in the phase transition temperature, an increase in permeability, and a thinner bilayer due to leaflet interdigitation in model membrane systems.15-17 These changes in the physical properties of lipid bilayers in the presence of alcohols could lead to altered function of integral membrane proteins, like ion channels, as well as alteration of processes that require membrane shape transformations.18,19
Dynamic reorganizations of membrane shape are common in cell biology. Cell division, membrane budding from the Golgi apparatus and endoplasmic reticulum, endocytosis, and exocytosis all require membrane shape change, with some of the faster processes (exocytosis and fast endocytosis) occurring on the second to millisecond time scale.20,21 In this paper we demonstrate that the presence of the short-chain alcohols ethanol and 1-propanol alters the kinetics of shape changes in a liposome-based model system. Previous data suggest that these two alcohols alter the physical properties of a liposome membrane in a static system.13,14 Here a dynamic model system is used, and the hypothesis is that alcohol interaction with the membrane will lead to accelerated shape change due to a lower lipid packing density and subsequent decrease in the membrane bending modulus. Amperometric results are compared to compression isotherms for the same lipid composition in the absence and presence of ethanol and 1-propanol. The results show that liposomes in alcoholic buffer undergo exocytosis-like shape changes faster than liposomes in alcohol-free buffer and that 1-propanol has a larger acceleratory effect than ethanol. Subsequent Langmuir balance experiments show that alcohols give rise to an increase in area per lipid molecule, with 1-propanol leading to a larger increase than ethanol. The combination of these experiments shows that the interaction of short-chain linear alcohols with lipid bilayers causes a decreased lipid packing density and a subsequent decrease in the resistance to shape change.
Materials and Methods
Liposome—Lipid Nanotube Preparation
Surface-immobilized, unilamellar liposomes and nanotube networks were prepared from soy polar extract (Avanti Polar Lipids, Inc., Alabaster, AL) as described previously.22 The lipid composition of soy polar extract was 45.7% phosphatidylcholine, 22.1% phosphatidylethanolamine, 18.4% phosphatidylinositol, 6.9% phosphatidic acid, and 6.9% unknown lipid fragments, according to data provided by Avanti Polar Lipids, Inc. All liposomes were rehydrated in a buffer containing 5 mM Trizma base, 30 mM K3PO4, 30 mM KH2PO4, and 0.5 mM EDTA adjusted to pH 7.4 with H2SO4. All buffer salts were obtained from Sigma-Aldrich, St. Louis, MO. In the cases of buffer containing ethanol or 1-propanol, all alcohols used were of high grade and were used as received without further purification. The alcohol solutions used were 5 and 10 vol % for ethanol and 2, 5, and 8 vol % for propanol, but are expressed in units of moles per liter.
For the formation of the liposome—nanotube network (Figure 1) a small glass micropipet was inserted (Figure 1A) by micromanipulation (Micromanipulator MHW-3, Narishige, Inc., East Meadow, NY) into the unilamellar liposome assisted by transiently disrupting the membrane using an electric field generated with a constant-voltage isolated stimulator set to apply a 2 V square wave pulse 10 ms in duration (DS2A-Mk. II, Digitimer, Inc., Hertfordshire, U.K.). The stimulator was connected to a custom-built microinjector holding the micropipet and a 5 μm diameter carbon fiber electrode (Dagan Corp., Minneapolis, MN) positioned opposite the micropipet with a micromanipulator (Sutter MP-85, Sutter Instrument Co., Novato, CA). The pipet was then translated across the inner volume of the liposome to the distal membrane, at which time another transient voltage pulse was applied, allowing the tip of the micropipet to exit the liposome (Figure 1B). The pipet was then withdrawn toward the center of the liposome. Lipid adhesion to the micropipet tip during withdrawal results in a lipid tube that is up to tens of micrometers in length and 100–300 nm in diameter.23 During pipet withdrawal, external pressure upon the solution, controlled with a FemtoJet (Eppendorf/Brinkmann Instruments, Hauppauge, NY), was used to flow catechol solution out of the micropipet. As solution flowed out of the pipet a smaller liposome formed on the tip of the micropipet, connected to the larger, external liposome by the lipid nanotube (Figure 1C). As solution continued to flow, the interior liposome grew and the nanotube connection shortened, resulting finally in membrane distention and release of the catechol solution contained within the smaller liposome (Figure 1D,E). The process was repeated as long as solution was flowing and the membrane nanotube remained adhered to the pipet tip (Figure 1F).
Figure 1.
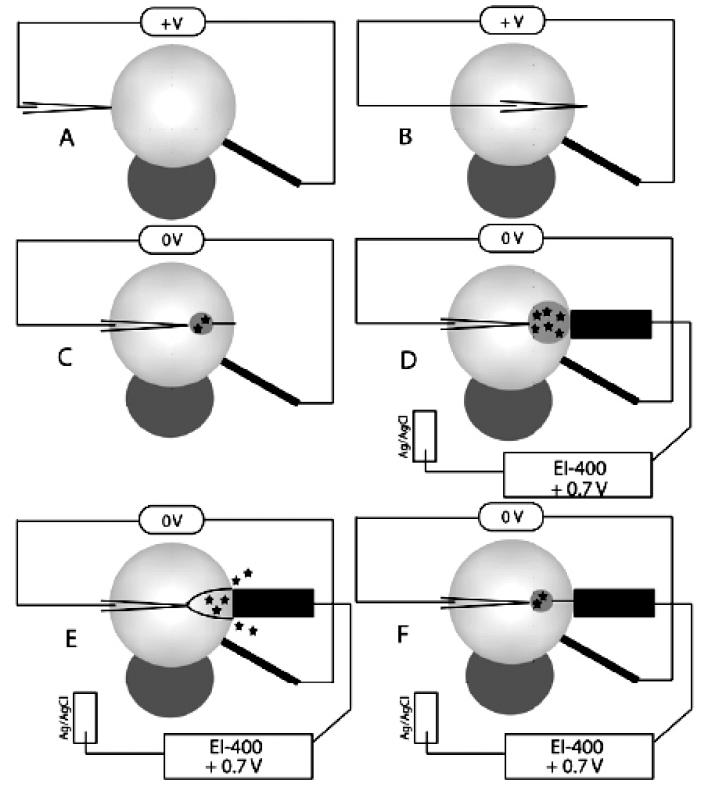
Schematic of liposome—nanotube network formation, where the light gray sphere represents a unilamellar liposome and the darker sphere below it represents a multilamellar protuberance, which anchors the liposomes to the glass coverslip. (A) A voltage (+V) is applied with a constant-voltage isolated stimulator across a liposome between a carbon fiber microelectrode (2.5 μm radius) and a micropipet, facilitating entry into the liposome. (B) After the micropipet is translated to the distal face of the liposome, another voltage pulse is applied, allowing the micropipet tip to exit the liposome. (C) The micropipet is retracted toward the center of the liposome with an adherent membrane nanotube. When solution flows out of the micropipet, a smaller vesicle forms from the nanotube at the pipet tip and slowly expands. (D) The interior vesicle continues to expand, and the membrane nanotube connection shortens until it resembles the fusion pore in a secretory cell. A detection electrode (16.5 μm radius carbon fiber) is positioned to detect released catechol, with +0.7 V being applied (vs Ag/AgCl reference) by an Ensman EI-400 potentiostat. (E) The interior vesicle rapidly opens, distending fully and releasing its contents to the extraliposomal space, where it is amperometrically detected. (F) The membrane nanotube remains adherent to the pipet tip, and because solution is continuously flowing, the process of vesicle inflation and release repeats continuously.
For amperometric measurements, 1 mM catechol (Sigma-Aldrich, St. Louis, MO) in phosphate buffer (5 mM Trizma base, 30 mM K3PO4, 30 mM KH2PO4, 0.5 mM EDTA adjusted to pH 7.4 with H2SO4) was placed in the vesicles via the microinjection pipet as vesicles were formed.
Microscopy
The liposome experiments were monitored microscopically with the 20× objective on an Olympus IX-70 microscope (Olympus America, Melville, NY) in differential interference contrast (DIC) mode. The video of the experiments was viewed with a Sony EXWAVE-HAD charge-coupled device (CCD) camera at a 33 Hz frame rate and recorded with iMovie software on an Apple G5 personal computer.
Amperometric Measurements
Carbon fibers (33 μm diameter) were aspirated into borosilicate glass capillaries (1.2 mm o.d., 0.69 mm i.d., Sutter Instrument Co.), and the capillaries were drawn to a fine tip with a commercial micropipet puller (model P-97, Sutter Instrument Co.) sealed in pulled glass capillaries with epoxy (Epoxy Technology, Billerica, MA). After beveling on a micropipet beveler (model BV-10, Sutter Instrument Co.) at 85° and testing in 0.1 mM catechol (in the same phosphate buffer used for the liposome experiments), electrodes were placed against the artificial cell with a micromanipulator (model MHW-3, Narishige, Inc.), and the current was monitored at 0.70 V versus a Ag/AgCl reference electrode with an Ensman Instruments EI-400 potentiostat. Data were collected at 1 kHz with a Digidata model 1322A interface and recorded with Axoscope 8.1 software (Axon Instruments, Foster City, CA). All amperometric experiments were carried out at ambient room temperature. Analysis of amperometric current transients was done manually with Mini-Analysis software, version 6.0.3, from Synaptosoft, Inc.
Compression Isotherm Experiments
Surface pressure—area isotherms for lipid monolayers were obtained using a Kibron μTrough S-LB (Kibron, Inc., Helsinki, Finland) interfaced to a personal computer. The surface pressure was monitored with a Wilhelmy wire. The soy lipid extract was dissolved in chloroform to make a 2 mg/mL solution. The monolayers were prepared by spreading 5 μL of the lipid solution onto the air/water interface at room temperature (23 ± 1 °C). The subphase was either phosphate buffer (5 mM Trizma base, 30 mM K3PO4, 30 mM KH2PO4, 0.5 mM EDTA adjusted to pH 7.4 with H2SO4) or phosphate buffer containing 0.86 or 1.71 M ethanol or 0.27, 0.67, or 1.07 M propanol. The films were aged for at least 20 min for solvent evaporation and film equilibration. The monolayer was then compressed at a constant rate of 7 (Å2/molecule)/min until the surface pressure started to decrease. All isotherms used for analytical purposes were the average of three individual isotherm measurements.
Results and Discussion
Formation of Liposomes in Alcoholic Buffer
There are no prior examples in the literature of rehydration of polar soy extract to form liposomes in phosphate buffer containing ethanol or propanol. The liposomes formed in these alcoholic buffers appeared very similar to those that occur upon rehydration in nonalcoholic phosphate buffer, with a unilamellar liposome forming as a protrusion from a multilamellar liposome. In these studies it is crucial that a unilamellar liposome forms attached to a multilamellar liposome because there is a need for a lipid source to form additional membrane surface during growth of the unilamellar liposome during inflation. Absence of a reservoir of excess lipid would lead to liposome lysis upon insertion of the micropipet as a lipid bilayer has a maximum area expansion of approximately 2–5% before rupture.24 The concentrations of alcohol used in this study do not seem to affect membrane adhesion to the pipet tip for network formation. However, at alcohol concentrations higher than those reported above, membrane—glass adhesion is not strong between the multilamellar liposomes and the glass coverslips (data not shown). This led to difficulty in the required micromanipulation for liposome network formation, and thus, experiments at those concentrations were not carried out.
Amperometric Analysis of Membrane Distention
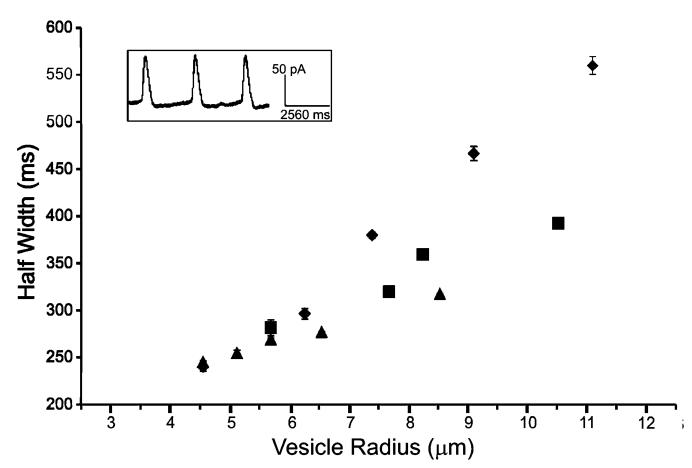
In previous experiments of this type, the distention of the liposome—nanotube network upon inner vesicle growth was termed “artificial exocytosis” because of the similarities with exocytosis in living cells.22,25 Schematic representation of this process is shown in Figure 1. Just before the distention of the membrane in the artificial system, the geometry appears strikingly similar to that of exocytosis in a natural system, and amperometric current transients that signify detection of released catechol have shapes that are qualitatively similar to those of current transients recorded upon exocytotic release from living cells. As shown previously, repeated release of catechol from the interior vesicle results in consecutive peaks that are nearly identical (Figure 2, inset).
Figure 2.
Characteristics of catechol release from vesicles. A plot of peak half-width vs vesicle radius reveals the kinetic dependency on vesicular size. Key: (◆) events measured in alcohol-free buffer; (■) events measured in 0.86 M ethanol buffer; (▲) events measured in 1.71 M ethanol buffer. Error bars represent ± the standard error of the mean (SEM), and in many cases the error bars are smaller than the symbols that represent the data points due to the extremely small peak to peak variation. Inset: An amperometric trace resulting from catechol release during membrane distention.
The kinetics of release, as judged by the full width at halfmaximum (“half-width”), are dependent on the size of the vesicle from which release is measured, where the release detected from larger vesicles results in broader peaks. Figure 2 shows the size dependency of release from vesicles ranging in radius from nearly 5 μm to greater than 10 μm. The breadth of peaks increases with increasing vesicle size because additional time is required for mass transport to the amperometric electrode of the larger volume of catechol solution. The mass transport of catechol solution to the detection electrode is largely driven by the distention of the membrane, which takes longer for larger vesicles, and the local convection and solution flow caused by distention.25 While the typical size of vesicles from which release was measured is much larger than that for a synaptic vesicle, these vesicles are only slightly larger than secretory granules found in beige mouse mast cells.26
Previous experiments have shown that the presence of ethanol and propanol can change the physical properties of vesicles, including the bending modulus.13,14 Ly and co-workers measured up to a 50% reduction in the bending modulus for vesicles in the presence of ethanol and propanol. Figure 2 illustrates how ethanol in the rehydration buffer increases the rate that catechol is released. Release characteristics are shown for experiments performed without ethanol and with 0.86 and 1.71 M ethanol. As the vesicles are subjected to higher concentrations of ethanol, the catechol release events are temporally shorter. For larger vesicles, the acceleratory effect of ethanol and propanol is greater (Figure 2). This is due to the fact that the release of catechol from larger vesicles requires the rearrangement of the shape of a larger portion of the membrane. This is a larger area for the short-chain alcohols to exert their effect and leads to a larger acceleratory effect.
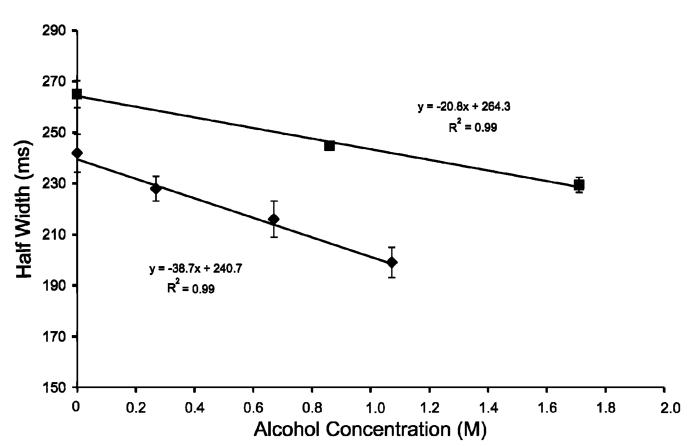
Perhaps a more demonstrative depiction of this effect is a plot of the peak half-width vs alcohol concentration, which is shown in Figure 3. Points representing release from approximately 4.5 and 5 μm radius (propanol and ethanol treatment, respectively) vesicles clearly show the peak half-width (release kinetics) is negatively correlated with alcohol concentration.
Figure 3.
Peak half-width as a function of alcohol concentration. Points representing ethanol-treated vesicles (■) and representing propanol-treated vesicles (◆) are shown above. The error bars represent ± SEM.
Previous reports have shown that propanol causes a larger decrease in the membrane bending modulus than does ethanol at the same concentration.14 This effect is important in the interpretation of the data presented here and is manifested as nonidentical slopes. In Figure 3 the slope of the half-width vs concentration plot for ethanol-treated vesicles is -21 ms/M, while the slope for propanol-treated vesicles is -39 ms/M. These slope values have been determined to be statistically different by regression analysis and a Student’s t test at the 95% confidence level. The larger negative slope that occurs with propanol treatment is indicative of a larger acceleratory effect on membrane distention as a function of concentration. The additional -CH2-group present in the larger alcohol leads to more favorable partitioning into the vesicle membrane and therefore a larger decrease in the bending modulus14 and, thus, a larger change in release kinetics as a function of propanol concentration.
Whether the presence of alcohols in this system has an effect on the bending modulus of the membrane is unknown; however, following the work of Ly and Longo, we assume that the bending modulus does decrease in the presence of alcohol. Interestingly, on the basis of the work of Ly and Longo,14 it might be assumed that ∼1 M propanol would result in a 50% reduction in the bending modulus. However, only an 18% decrease in the half-width is observed. It is possible that the bending modulus decrease observed for the soy polar extract lipid bilayer is less than that for an SOPC bilayer, as used by Ly and Longo, upon alcohol treatment. An alternative explanation would be that the bending modulus of the membrane is only one factor influencing the rate of membrane distention. Other factors, such as the size of the vesicle and the pressure applied to the injection pipet, may have an influence on the rate of membrane shape change. Presumably there is some minimum peak half-width value that is dependent on the vesicular size (surface area and volume) and the flow rate from the inflation pipet, and no matter how flexible the membrane becomes, the measured peak will never fall below that minimum.
Binary aqueous solutions of ethanol and propanol have been shown to possess higher viscosity than pure water.27 The addition of either of these alcohols increases the solution viscosity in a nonlinear fashion, up to a maximum that is greater than 2 times the viscosity of pure water at 20–30 mol % alcohol. In our studies we see an increased rate of membrane distention with the addition of alcohol in spite of the increased solution viscosity. It is likely that alcohols have an even more profound acceleratory effect on the rate of membrane shape change, but some of this effect is being masked by the increased viscosity of the experimental medium.
Different alcohols show effects that differ in magnitude as determined by amperometric analysis, but this only gives a macroscale description of the effects of alcohols on a bilayer membrane. These results are very demonstrative in that they suggest that the presence of alcohols can change the rate at which vesicles change shape, and this effect is dependent on both the alcohol concentration and the length of the alcohol molecule. However, the amperometric data reveal no molecular details about the mechanism of this effect. For this reason, Langmuir balance experiments were performed to determine how monolayers of soy polar extract spread on the surface of a buffer are affected by the presence of ethanol and propanol.
Lipid Monolayers at the Air/Alcoholic Buffer Interface
Compression isotherms of lipid monolayers can provide some insight into the changes in molecular order due to the presence of ethanol and propanol. With a micropipet aspiration technique, Ly and Longo demonstrated that exposure of SOPC vesicles to both ethanol and propanol results in a significant increase in the area per lipid molecule, a decrease in the area compressibility modulus, and a decrease in the lysis tension.13,14 However, no studies have been reported in the literature that examine the interfacial behavior of soy polar extract lipids in the presence of linear alcohols.
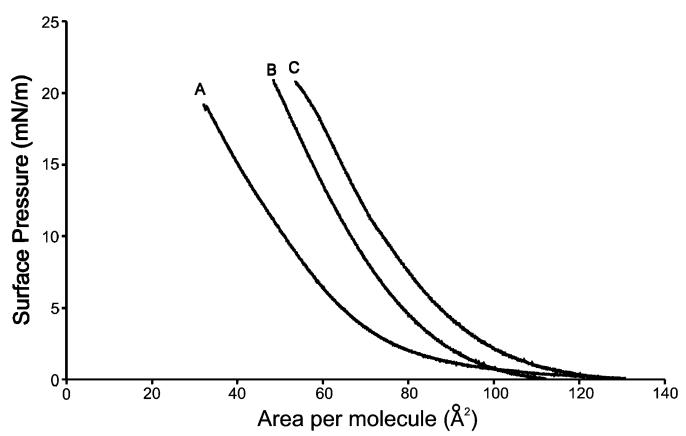
Figure 4 illustrates the measured isotherms of monolayers on buffers with no added alcohol (A), 0.86 M ethanol buffer (B), and 0.67 M propanol (C). The measured isotherms of soy polar extract in the absence of alcohol reported here compare quite favorably to isotherms of soybean lecithin monolayers at the air/water interface.28,29
Figure 4.
Compression isotherms of soybean extract lipid monolayers on phosphate buffer solutions containing no alcohol (A), 0.86 M ethanol (B), and 0.67 M propanol (C).
From the isotherms it is readily apparent that the presence of alcohols results in a larger area per lipid molecule at a given pressure. The increase in area per molecule occurs because an excess of alcohol molecules at the interface facilitates alcohol partitioning into the monolayer. Previous studies have shown a surface excess of alcohols at interfacial alkane monolayers by experiment30 and computer simulation.31 Extension of this work to water/lipid interfaces has shown similar excesses, albeit not as large. For the bulk concentration range of 0–20% (v/v) ethanol, Ly and Longo have predicted a 2–3-fold surface excess of ethanol at an SOPC/water interface.13 In subsequent work they have shown that solutions containing propanol have a larger surface excess than ethanol solutions, which is hypothesized to be the cause of the difference in ethanol and propanol isotherms observed in this study.
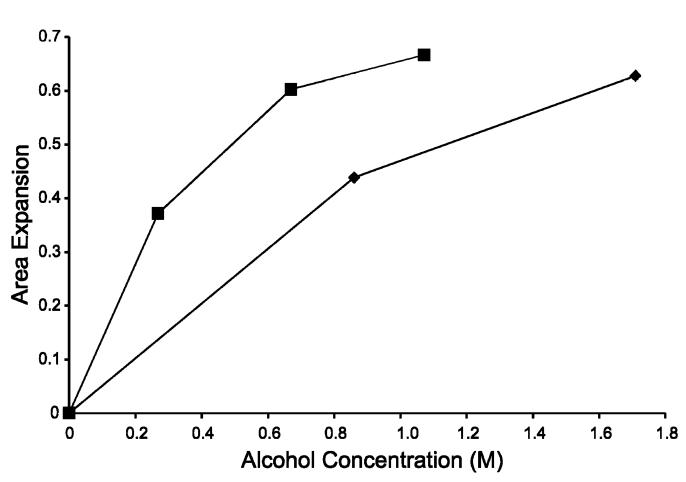
In Figure 4 it is apparent that propanol has a larger effect on the area per molecule in the monolayer than does ethanol. At every pressure the area per lipid molecule on the surface of 0.67 M propanol solution is larger than that in 0.86 M ethanol. The partitioning of alcohols into the interface region occurs because the interactions between the alcohol and lipid molecules on the surface are more favorable than the interactions between the alcohol and the water molecules in the bulk, which is the net result of the buffer—monolayer interactions, alcohol—monolayer interactions, and buffer—alcohol interactions. An effective way to quantify the degree to which alcohols in the subphase affect the lipid monolayer packing density on the surface is to calculate the area expansion(δA/Ao). Area expansion is calculated at a given surface pressure with the following equation:
| (1) |
where AA,∏ is the area per molecule for a monolayer in the presence of an alcohol at a given pressure, ∏, and Ao,∏ is the area per molecule for a monolayer with no alcohol present at the same pressure. Plotting ΔA/Ao vs alcohol concentration (Figure 5) very clearly shows the difference in the magnitude of the effects of ethanol and propanol. To achieve equivalent amounts of area expansion, a concentration of ethanol approximately 3 times greater than that of propanol is needed. This supports previous calculations that have shown that propanol will partition into a water/lipid interface with a partition coefficient 3 times greater than that of ethanol partitioning.14,32 The effects of ethanol on a lipid bilayer are shown schematically in Figure 6 comparing membrane schematics without and with added alcohol. In Figure 6B the model is drawn to show that the area per lipid molecules has increased, with the void space created filled largely by ethanol molecules. In addition, the bilayer is modeled to have slightly interdigitated membrane leaflets, leading to a thinner membrane in the presence of ethanol as has been observed with X-ray diffraction.17 The decreased surface density of lipids and thinning of the bilayer quite possibly contribute mechanistically to the increased rate of membrane distention presented in this paper.
Figure 5.
Area expansion (ΔA/Ao) at 15 mN/m vs alcohol concentration for propanol (■) and ethanol (◆).
Figure 6.
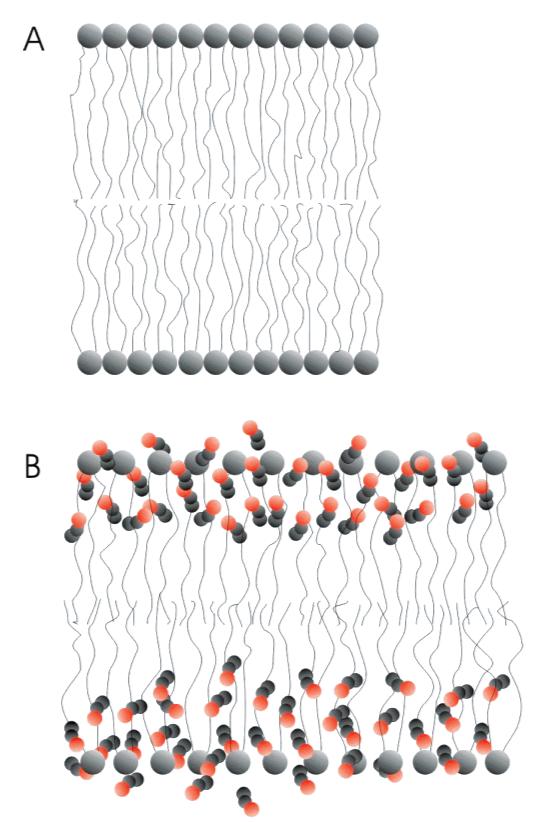
Schematic representation of the action of ethanol at a lipid bilayer membrane: (A) lipid bilayer membrane in the absence of ethanol; (B) lipid bilayer membrane in the presence of ethanol showing the ethanol molecules (gray and red) partitioning into the more hydrophilic head group and glycerol backbone region of the bilayer and an increase in the area per lipid molecule. Also, the membrane in (B) is shown to be slightly thinner due a small leaflet interdigitation, which is an experimentally observed response to the presence of ethanol.17
Alcohols at the Membrane Surface Promote Accelerated Membrane Shape Change
Short-chain alcohols have been theorized to break up monolayer continuity to promote fusion of discontinuous membranes. Experimentally, Chanturiya et al. have demonstrated this by measuring a greater probability of fusion between small vesicles and planar lipid bilayers in the presence of alcohols.33 Those studies, however, did not address whether the presence of alcohols promotes acceleration of the postfusion membrane distention. The results presented here demonstrate that the presence of ethanol can alter the rate at which membranes change shape in an exocytosis-like fashion. While the concentrations of the alcohols used in this study are appreciably higher than blood levels during intoxication, there is some evidence that ethanol accumulates in certain tissues to levels higher than found in blood. In particular are regions of the brain, most notably the striatum, which can accumulate ethanol to levels that are 3 times the level found in the blood.34 In addition, the rate of clearance in the striatum is slower than in other body regions. This may have implications for the kinetics of neurotransmission in chronic abusers of alcohol during episodes of binge drinking. The work presented here also demonstrates that the rate of distention after fusion can be measured by using an electrochemical technique with high temporal resolution, and this approach is useful for examining the effects of many types of biologically relevant molecules on membrane shape change.
Acknowledgment
This work was supported, in part, by grants from the National Science Foundation and the National Institutes of Health. We thank Nick Kuklinski for statistical assistance. A.G.E. gratefully acknowledges the support of the European Union for a Marie Curie Chair.
References
- (1).Korpi ER, Kleingoor C, Kettenmann H, Seeburg PH. Nature. 1993;361:356–9. doi: 10.1038/361356a0. [DOI] [PubMed] [Google Scholar]
- (2).Proctor WR, Diao L, Freund RK, Browning MD, Wu PH. J. Physiol. 2006;575:145–59. doi: 10.1113/jphysiol.2006.112730. [DOI] [PMC free article] [PubMed] [Google Scholar]
- (3).Wallner M, Hanchar HJ, Olsen RW. Proc. Natl. Acad. Sci. U.S.A. 2006;103:8540–5. doi: 10.1073/pnas.0600194103. [DOI] [PMC free article] [PubMed] [Google Scholar]
- (4).Lovinger DM, White G, Weight FF. Science. 1989;243:1721–4. doi: 10.1126/science.2467382. [DOI] [PubMed] [Google Scholar]
- (5).Lovinger DM, White G, Weight FF. Ann. Med. 1990;22:247–52. doi: 10.3109/07853899009148935. [DOI] [PubMed] [Google Scholar]
- (6).Mitchell DC, Litman BJ. Biochemistry. 1999;38:7617–23. doi: 10.1021/bi990634m. [DOI] [PubMed] [Google Scholar]
- (7).Mitchell DC, Litman BJ. J. Biol. Chem. 2000;275:5355–60. doi: 10.1074/jbc.275.8.5355. [DOI] [PubMed] [Google Scholar]
- (8).Chin JH, Goldstein DB. Mol. Pharmacol. 1977;13:435–41. [PubMed] [Google Scholar]
- (9).Chin JH, Goldstein DB. Science. 1977;196:684–5. doi: 10.1126/science.193186. [DOI] [PubMed] [Google Scholar]
- (10).Chin JH, Goldstein DB. Adv. Exp. Med. Biol. 1977;85A:111–22. doi: 10.1007/978-1-4899-5181-6_8. [DOI] [PubMed] [Google Scholar]
- (11).Barry JA, Gawrisch K. Biochemistry. 1994;33:8082–8. doi: 10.1021/bi00192a013. [DOI] [PubMed] [Google Scholar]
- (12).Barry JA, Gawrisch K. Biochemistry. 1995;34:8852–60. doi: 10.1021/bi00027a037. [DOI] [PubMed] [Google Scholar]
- (13).Ly HV, Block DE, Longo ML. Langmuir. 2002;18:8988–8995. [Google Scholar]
- (14).Ly HV, Longo ML. Biophys. J. 2004;87:1013–33. doi: 10.1529/biophysj.103.034280. [DOI] [PMC free article] [PubMed] [Google Scholar]
- (15).Chen SY, Yang B, Jacobson K, Sulik KK. Alcohol. 1996;13:589–95. doi: 10.1016/s0741-8329(96)00073-0. [DOI] [PubMed] [Google Scholar]
- (16).Rowe ES. Biochim. Biophys. Acta. 1985;813:321–30. doi: 10.1016/0005-2736(85)90248-2. [DOI] [PubMed] [Google Scholar]
- (17).Slater JL, Huang CH. Prog. Lipid Res. 1988;27:325–59. doi: 10.1016/0163-7827(88)90010-0. [DOI] [PubMed] [Google Scholar]
- (18).Cantor RS. Biochemistry. 1997;36:2339–44. doi: 10.1021/bi9627323. [DOI] [PubMed] [Google Scholar]
- (19).Cantor RS. J. Phys. Chem. B. 1997;101:1723–1725. [Google Scholar]
- (20).Burgoyne RD, Morgan A. Physiol. Rev. 2003;83:581–632. doi: 10.1152/physrev.00031.2002. [DOI] [PubMed] [Google Scholar]
- (21).Ryan TA. Neuron. 1996;17:1035–7. doi: 10.1016/s0896-6273(00)80236-6. [DOI] [PubMed] [Google Scholar]
- (22).Cans AS, Wittenberg N, Karlsson R, Sombers L, Karlsson M, Orwar O, Ewing A. Proc. Natl. Acad. Sci. U.S.A. 2003;100:400–4. doi: 10.1073/pnas.232702599. [DOI] [PMC free article] [PubMed] [Google Scholar]
- (23).Karlsson R, Karlsson M, Karlsson A, Cans AS, Bergenholtz J, Akerman B, Ewing AG, Voinova M, Orwar O. Langmuir. 2002;18:4186–4190. [Google Scholar]
- (24).Kwok R, Evans E. Biophys. J. 1981;35:637–52. doi: 10.1016/S0006-3495(81)84817-5. [DOI] [PMC free article] [PubMed] [Google Scholar]
- (25).Cans AS, Wittenberg N, Eves D, Karlsson R, Karlsson A, Orwar O, Ewing A. Anal. Chem. 2003;75:4168–75. doi: 10.1021/ac0343578. [DOI] [PubMed] [Google Scholar]
- (26).Breckenridge LJ, Almers W. Proc. Natl. Acad. Sci. U.S.A. 1987;84:1945–9. doi: 10.1073/pnas.84.7.1945. [DOI] [PMC free article] [PubMed] [Google Scholar]
- (27).Nagasawa Y, Nakagawa Y, Nagafuji A, Okada T, Miyasaka H. J. Mol. Struct. 2005;735–36:217–223. [Google Scholar]
- (28).Torosian G, Lemberger AP. J. Pharm. Sci. 1968;57:17–22. doi: 10.1002/jps.2600570103. [DOI] [PubMed] [Google Scholar]
- (29).Torosian G, Lemberger AP. J. Pharm. Sci. 1969;58:864–6. doi: 10.1002/jps.2600580716. [DOI] [PubMed] [Google Scholar]
- (30).Bartell FE, Davis JK. J. Phys. Chem. 1941;45:1321–1336. [Google Scholar]
- (31).Rivera JL, McCabe C, Cummings PT. Phys. ReV. E: Stat. Nonlinear Soft Matter Phys. 2003;67:011603. doi: 10.1103/PhysRevE.67.011603. [DOI] [PubMed] [Google Scholar]
- (32).Katz Y, Diamond JM. J. Membr. Biol. 1974;17:101–20. doi: 10.1007/BF01870175. [DOI] [PubMed] [Google Scholar]
- (33).Chanturiya A, Leikina E, Zimmerberg J, Chernomordik LV. Biophys. J. 1999;77:2035–45. doi: 10.1016/S0006-3495(99)77044-X. [DOI] [PMC free article] [PubMed] [Google Scholar]
- (34).Chen JC, Lin CC, Ng CC, Chiu TF, Shyr MH. J. Stud. Alcohol Drugs. 2007;68:649–53. doi: 10.15288/jsad.2007.68.649. [DOI] [PubMed] [Google Scholar]


