

Abstract
Quantum dots emerge as an attractive alternative to small molecule fluorophores as fluorescent tags for in vivo cell labeling and imaging. This communication presents a method for specific labeling of live cells using quantum dots. The labeling is mediated by HaloTag protein expressed at the cell surface which forms a stable covalent adduct with its ligand (HaloTag ligand). The labeling can be performed in one single step with quantum dot conjugates that are functionalized with HaloTag ligand, or in two steps with biotinylated HaloTag ligand first and followed by streptavidin coated quantum dots. Live cell fluorescence imaging indicates that the labeling is specific and takes place at the cell surface. This HaloTag protein-mediated cell labeling method should facilitate the application of quantum dots for live cell imaging.
Keywords: Quantum dots, HaloTag protein, Live cell labeling, Fluorescence imaging
Fluorescence imaging of proteins in vivo opens up a window into the cellular protein biochemistry, enabling direct visualization of protein dynamics, localization, and interactions in single living cells [1]. Most of current labeling strategies employ either green fluorescent protein (GFP) and its color variants or small organic fluorophores that are chemically introduced to the target proteins [2-8]. While each fluorescent tag possesses its own advantages, both share the same shortcoming for long-term imaging, that is, low photostability. Recent advance in the nanotechnology has generated a powerful addition to the labeling arsenal, which is semiconductor nanocrystallites (also known as quantum dots, QDs). Semiconductor QDs are a class of new material intermediate between small molecules and bulk size materials, and possess unique electrical and optical properties due to the quantum confinement effect [9]. They have broad absorption and narrow emission spectra, large extinct coefficients, high photostability, and long fluorescence lifetime. Their fluorescent emission is dependent on the size of the nanoparticles—larger size produces longer emission wavelength [10]. All these potential advantages make quantum dots attractive as a fluorescent tag for biological applications such as in vitro assay detection and in vivo cell labeling and imaging [11-16]. For these biological applications, QDs are often coated with biocompatible molecules such as phospholipids [17], amphiphilic polymers [18], peptides [19-20], or nucleic acids [21], followed by further functionalization with biorecognition molecules such as receptor-binding ligands antibody to label specific proteins. For example, antibody conjugated QDs have been applied to label multiple cellular targets in fixed samples [22], and to image xenografted prostate tumors in vivo [18]. Streptavidin conjugated QDs have allowed the visualization of dynamics of neuroreceptors in cultured neurons [23]. Quantum dots conjugated with bioluminescent proteins can emit light via bioluminescence resonance energy transfer without external light excitation, and have been applied to in vivo animal imaging [24]. This communication presents a general method for labeling surface proteins in live cells with QDs based on a genetically engineered hydrolase as the mediator.
Our labeling strategy utilizes an engineered bacterial enzyme, haloalkane dehalogenase–the HaloTag protein (HTP) [25]. The native HTP is a monomeric protein (MW ∼ 33 KDa) that cleaves carbon halogen bonds in aliphatic halogenated compounds [26]. Upon the nucleophilic attack to Asp106 in the enzyme by the chloroalkane, an ester bond is formed between the HaloTag ligand and the protein (Scheme 1). HTP contains a critical mutation in the catalytic triad (His272 to Phe) so that the formed ester bond between HTP and HaloTag ligand cannot be further hydrolyzed (Scheme 1). HaloTag ligands labeled with small organic dyes such as coumarin and fluorescein have been developed for in vivo labeling of target proteins. We have previously demonstrated this technology for specific bioconjugation of bioluminescent proteins to quantum dots [27]. In this work, we genetically fused the HTP to a cell membrane anchoring domain to present HTP extracelluarlly for the QD labelling. The labeling can be performed in one single step with QDs conjugates that are functionalized with HaloTag ligand, or in a two-step procedure with biotinylated HaloTag ligand first and followed by streptavidin-coated QDs. Live cell fluorescence imaging indicates that the labeling is specific and takes place at the cell surface. This HaloTag protein-mediated cell labeling method should facilitate the application of quantum dots for live cell imaging.
Scheme 1.
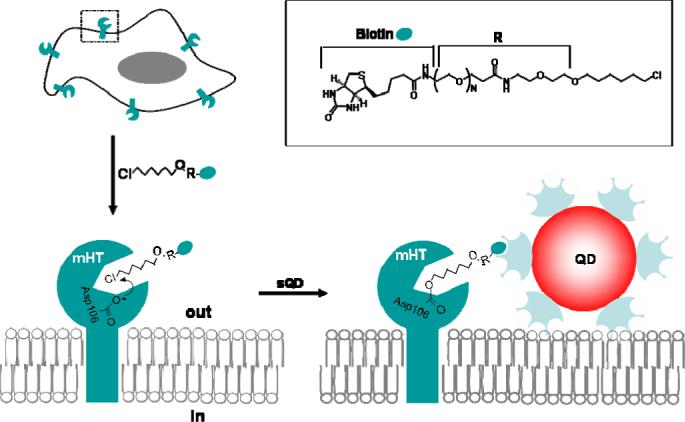
Schematic representation of the design of the HaloTag protein-mediated labeling of membrane protein in living cells with quantum dots.
Materials and methods
General methods and chemicals
Unless otherwise stated, all reagents and solvents were obtained from commercial sources and used without purification. Water was deionized by passing through a Milli-Q water filtration system. Analytical TLC was performed with 0.25 mm silica gel 60F plates with fluorescent indicator (254 nm). Plates were visualized by ultraviolet light. 1H NMR spectra were measured on a Varian INOVA 400 magnetic resonance spectrometer. Data for 1H NMR spectra are reported as follows: chemical shifts are reported as δ in units of parts per million (ppm) relative to chloroform-d (δ 7.26, s) and Methanol-d4 (δ 4.87, s); multiplicities are reported as follows: s (singlet), d (doublet), t (triplet), q (quartet), dd (doublet of doublets), m (multiplet), or br (broadened); coupling constants are reported as a J value in Hertz (Hz); the number of protons (n) for a given resonance is indicated nH, and is based on spectral integration values. EI-MS spectrometric analyses were performed at the Mass Spectrometry Facility of Stanford University, California.
Synthesis of biotinylated HaloLigands 1 and 2
HaloTag ligands 1 and 2 are prepared according to Scheme 2.
Scheme 2.

Synthesis of biotinylated HaloLigands 1 and 2. Reagents and conditions: a) Boc2O, EtOH, 0 °C-r.t.; b) NaH, DMF, 0 °C; then 1-chloro-6-iodohexane, r.t.; c) TFA, anisole, CH2Cl2, r.t. then K2CO3, MeOH; d) 6 or 7, TBTU, HOBt, DMF, r.t; then 5; e) piperidine, DMF, r.t; f) Biotin-NHS, DIPEA, DMF.
3: To a solution of 2-(2-aminoethoxy)ethanol (1.05 g, 10 mmol) in anhydrous EtOH (20 mL) at 0 °C was added Boc2O (2.2 g, 10 mmol). After stirring at room temperature for 2 h, the reaction mixture was diluted with CH2Cl2, washed with brine and the organic layer was dried over Na2SO4. The solvent was removed to get the residue 3 (2.05 g, 100%), which was used for the next step without further purification. 1HNMR: (400 MHz, CDCl3) δ 5.07 (br, 1 H), 3.74(m, 2 H), 3.60 (m, 4 H), 3.33 (m, 2 H), 2.69 (m, 1 H), 1.45 (s, 9 H).
4: Under argon, to a solution of 3 (1.0 g, 5.0 mmol) in anhydrous DMF (5 mL) at 0 °C was added 80% of NaH (192 mg, 6.0 mmol). After stirring at 0 °C for 30 min, 1-chloro-6- iodohexane (1.5 g, 6.1 mmol) was added to the reaction mixture. After 4h the reaction was quenched with 1N of HCl, and extracted with CH2Cl2. The organic layer was washed with brine and dried over Na2SO4 and then evaporated. The residue was purified by flash column on silica gel to afford 0.9 g (56%) of 4 as colorless oil. 1HNMR: (400 MHz, CDCl3) δ 5.07 (br, 1 H), 3.64−3.50 (m, 8 H), 3.47(t, J = 6.8 Hz, 3 H), 3.36−3.28 (m, 2 H), 1.82−1.74 (m, 2 H), 1.66−1.57 (m, 2 H), 1.50−1.34 (m, 4 H), 1.45 (s, 9 H). EI-MS: m/z 324.2 [M+1]+; calc 323.2.
5: Compound 4 (650 mg, 2.0 mmol) was dissolved in 4 mL of CH2Cl2 and treated with TFA (1.0 mL) at room temperature for 2h. The solvent was removed and the residue was treated with anhydrous K2CO3 (550 mg, 4.0 mmol) in MeOH (5 mL). The mixture was filtered and the filtrate was concentrated to give amine 5 (406 mg, 91%) as colorless oil. 1HNMR: (400 MHz, CDCl3) δ 3.95−3.40 (m, 8 H), 3.10−2.80 (m, 2 H), 1.82−1.74 (m, 2 H), 1.65−1.56 (m, 2 H), 1.50−1.32 (m, 4 H). EI-MS: m/z 223.8 [M+1]+; calc 223.1.
8: To a mixture of 6 (200 mg, 0.5 mmol), TBTU (160 mg, 0.5 mmol) and HOBt (80 mg, 0.6 mmol) in 3.0 mL of anhydrous CH2Cl2 was added DIPEA ( 175 μL, 1.0 mmol) at room temperature. The reaction mixture was stirred for 5 min and then 5 (130 mg, 0.6 mmol) was added. After stirring for 1h, the reaction mixture was quenched with NH4Cl and extracted with EtOAc. The organic layer was washed with brine, dried over Na2SO4 and evaporated. The residue was purified by flash column on silica gel to get 250 mg (83 %) of 8 as colorless oil. 1HNMR: (400 MHz, CDCl3) δ 7.76 (d, J = 7.6 Hz, 1 H), 7.61 (d, J = 7.2 Hz, 1 H), 7.42−7.36 (m, 2 H), 7.34−7.27 (m, 2 H), 6.63 (br, 1 H), 5.78 (br, 1 H), 4.43 (d, J = 6.8 Hz, 2 H), 4.24−4.21 (m, 2 H), 3.73 (t, J = 6.4 Hz, 2 H), 3.66−3.40 (m, 20 H), 2.45 (t, J = 6.4 Hz, 2 H), 1.80−1.72 (m, 2 H), 1.64−1.54 (m, 2 H), 1.48−1.30 (m, 4 H). EI-MS: m/z 605.3 [M+1]+; calc 604.3.
9: To a mixture of compound 6 (130 mg, 0.25 mmol), TBTU (80 mg, 0.25 mmol) and HOBt (40 mg, 0.3 mmol) in 1.5 mL of anhydrous CH2Cl2 was added DIPEA ( 100 μL, 0.6 mmol) at room temperature. The reaction mixture was stirred for 5 min and then 5 (70 mg, 0.31 mmol) was added. After stirring for 1h, the reaction mixture was quenched with NH4Cl and extracted with EtOAc. The organic layer was washed with brine, dried over Na2SO4 and evaporated. The residue was purified by flash column on silica gel to afford 140 mg (76 %) of 9 as colorless oil. 1HNMR: (400 MHz, CDCl3) δ 7.76 (d, J = 7.2 Hz, 1 H), 7.61 (d, J = 7.2 Hz, 1 H), 7.41−7.37 (m, 2 H), 7.34−7.29 (m, 2 H), 6.64 (br, 1 H), 5.56 (br, 1 H), 4.40 (m, 2 H), 4.24−4.22 (m, 2 H), 3.72 (t, J = 6.0 Hz, 2 H), 3.66−3.40 (m, 34 H), 2.45 (t, J = 6.0 Hz, 2 H), 1.80−1.72 (m, 2 H), 1.62−1.54 (m, 2 H), 1.50−1.30 (m, 4 H). EI-MS: m/z 767.5 [M+1]+; calc 766.4.
1: To a solution of 8 (61 mg, 0.10 mmol) in 1.5 mL of anhydrous CH2Cl2 was added piperidine (300 L) at room temperature. After stirring for 1h, the solvent was removed under reduced pressure and the residue was dried in vacuum overnight. The resultant amine was dissolved in DMF. To this solution was added DIPEA (100 L) and Biotin-NHS (50 mg, 0.15 mmol) at room temperature. The reaction mixture was diluted with EtOAc, washed with brine, dried over Na2SO4 and evaporated. The residue was purified by flash column on silica gel to get 22 mg (36%) of 1. 1HNMR: (400 MHz, CD3OD) δ 4.51−4.48 (m, 1 H), 4.32−4.28 (m, 1 H), 3.74 (t, J = 6.0 Hz, 1 H), 3.62−3.52 (m, 14 H), 3.49 (t, J = 6.0 Hz, 1 H), 3.40−3.28 (m, 6 H), 3.24−3.18 (m, 1 H), 2.96−2.90 (m, 1 H), 2.74−2.68 (m, 1 H), 2.46 (m, J = 6.0 Hz, 1 H), 2.22 (m, J = 7.2 Hz, 1 H), 1.80−1.52 (m, 8 H), 1.50−1.26 (m, 6H). EI-MS: m/z 609.4 [M+1]+; calc 608.3.
2: To a solution of 9 (78 mg, 0.10 mmol) in 1.5 mL of anhydrous CH2Cl2 was added piperidine (300 μL) at room temperature. After stirring for 1h, the solvent was removed under reduced pressure and the residue was dried in vacuum overnight. The resultant amine was dissolved in DMF. To this solution was added DIPEA (100 μL) and Biotin-NHS (50 mg, 0.15 mmol) at room temperature. The reaction mixture was diluted with EtOAc, washed with brine, dried over Na2SO4 and evaporated. The residue was purified by flash column on silica gel to get 21 mg (27%) of 2. 1HNMR: (400 MHz, CD3OD) δ 4.51−4.46 (m, 1 H), 4.32− 4.28 ( m, 1 H), 3.72 (t, J = 6.4 Hz, 1 H), 3.66−3.52 (m, 32 H), 3.49 (t, J = 6.4 Hz, 1 H), 3.38−3.34 (m, 4 H), 3.32−3.29 (m, 2 H), 3.24−3.18 (m, 1 H), 2.96−2.90 (m, 1 H), 2.71 (d, J = 12.8 Hz, 1 H), 2.45 (t, J = 6.4 Hz, 2 H), 2.22 (t, J = 7.2 Hz, 2 H), 1.80−1.54 (m, 8 H), 1.52−1.36 (m, 6H). EI-MS: m/z 785.4 [M+1]+; calc 784.4.
Plasmid constructs
All mammalian expression vectors were constructed by standard cloning procedures. PCR amplification was done using Pfu ultra high-fidelity DNA polymerase (Stratagene) to avoid any undesired mutations. The gene encoded for the HaloTag protein without the stop codon was obtained by PCR from the HaloTag pHT2 vector (Promega) with a BglII site straddling the initial methionine codon and a PstI site attached to the 3' end. The PCR product was digested and ligated with a BglII/PstI digested pDisplay plasmid (Invitrogen, Carlsbad, CA) to afford the plasmid pmHT. that is included an N-terminal signal peptide, a c-terminal PDGFR transmembrane domain and a stop codon. The CMV-null plasmid was made from the pDsRed2-N1 vector (Clontech) after removal of the DsRed cDNA as a control vector. The pEGFP-C1 plasmid (Clontech) was used as the transfection marker.
Cell lines, cell culture, and transfection protocols
COS7 cells (monkey kidney cell line) were grown in Dulbecco’s Modified Eagle medium supplemented with 10% fetal bovine serum at 37°C and 5% CO2. Cells were transfected with Lipofectamine 2000 (Invitrogen) according to the manufacturer's protocol.
Two-step labeling of living cell
COS7 cells were transfected with 0.6 μg of the pmHT or cmv-null plasmid along with 0.2 μg of pEGFP-C1 plasmid by lipofectamine 2000 (Invitrogen). 24 h after transfection, cells were reseeded into a 35-mm glass bottom culture dish (MatTek, Ashland, MA). 24 h after reseeding cells were rinsed twice with Hanks' balanced salt solution (HBSS, Gibco). Cells were incubated with 50 μM of the biotinylated HaloTag ligand for 30 min at 37 °C, 5% CO2, and then labeled with the 5 nM of streptavidin-QD655 conjugate (Invitrogen) in HBSS for 30 min at room temperature. The cells were washed 5 times with HBSS before imaging on an Axiovert 200M fluorescence microscope (Zeiss) using a 40x oil-immersion lens. QD655 (420/440 excitation, 660/40 emission, 470dcxr), and EGFP (480/30 excitation, 535/40 emission, 505dclp) images were collected and analyzed using MetaMorph Image analysis software version 5.0 (Molecular Devices).
Direct labeling of living cell with QDs
The biotinylated HaloTag ligand was mixed with the streptavidin coated QDs (sQD) at a ratio of 50:1 in 10 mM phosphate buffer (pH=7.4) for 30 min in room temperature, and free ligand was removed with three washes using 10K NanoSep filter (Pall) by centrifugation at 7000 rpm for 3 min at 4 °C. Final QD complex was collected with HBSS buffer (pH=7.4) for the determination of the concentration. Cells were prepared using previous protocol for labeling. After rinsing twice with HBSS, transfected cells were incubated with 20 nM of QD/HaloTag ligand conjugates for 30 minutes in 37°C, 5% CO2. The incubation medium was removed and the cells were rinsed 5 times with HBSS before imaging.
Results and discussion
We first cloned the HaloTag protein into a mammalian expression vector pDisplay that contains the platelet derived growth factor receptor (PDGFR) transmembrane domain at the C-terminus to anchor the HTP on the cell membrane. A signal peptide from murine Ig κ-chain was added to the N-terminus of the HTP to ensure that it is presented on the extracellular side of the cell membrane for labeling. The biotinylated HaloTag ligand 1 was prepared according to Scheme 2, and used for the cell labeling study.
COS7 cells were cotransfected with the membrane HTP expression construct (mHTP) and an EGFP plasmid. As a transfection marker, EGFP fluorescence verified the successful transfection of mHTP. We first performed a two-step labeling procedure, in which cells were labeled first with the biotinylated HaloTag ligand, followed by the binding to the streptavidin coated QD655 (sQD655). Unbound HaloTag ligand and QDs were washed out at each step. As expected, cells transfected with both mHTP and GFP displayed the red fluorescence from the sQD655 on the membrane and green fluorescence in the cytosol (Figure 1A). Confocal imaging confirmed that the QDs were present on the cell membrane (Supporting Figure S1). As a control, when the biotinylated HaloTag ligand 1 was not present in the first labeling step, cells only displayed the green fluorescence from EGFP (Figure 1B), suggesting that sQD655 did not bind to the transfected cells non-specifically. When COS7 cells were transfected only EGFP, the two-step labeling resulted in little labeling by the QDs (Figure 1C), further supporting the HaloTag protein mediated cell labeling is specific.
Figure 1.
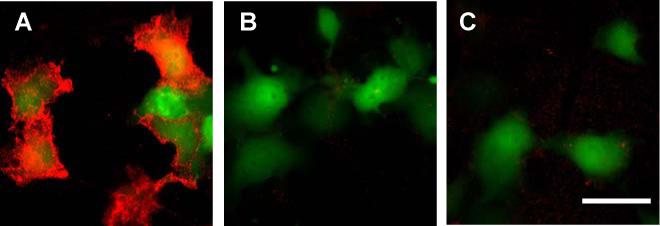
A two-step labeling of a cell surface HaloTag protein in living cells with QDs. COS7 cells expressing membrane HaloTag protein (mHTP) and EGFP as a transfection marker are incubated with (A) or without (B) HaloTag ligand 1 for 30 min in 37 °C; (C) COS7 cell expressing only EGFP are incubated with HaloTag ligand 1 for 30 min in 37 °C. After washing, these cells are then labeled with 5 nM of sQD for 30 min in room temperature before imaging. QD signal is acquired with 100 ms exposure. Shown images are overlaid frames of QD (red) and EGFP (green) fluorescence of the same region. Scale bar, 50 μm.
This label was stable and allowed long-term imaging of labeled cells. We followed the labeled cells with fluorescence microscopic imaging at room temperature over 4 hours and the signals remained essentially intact (Supporting Figure S2A). When the temperature was increased to 37 °C, endocytosis began to occur as seen from the punctuate QD fluorescence pattern inside cells (Supporting Figure S2B).
We next attempted a direct one-step labeling by first mixing sQD655 with the HaloTag ligand 1 to make the HaloTag ligand presenting QDs. The resulting QD conjugates tended to aggregate at the cell surface during the incubation. We thus synthesized the HaloTag ligand 2 with three more ethylene glycol units (Scheme 2), which was more water soluble than ligand 1. At the same concentration (50 μM) in the two-step labeling procedure, ligand 2 resulted in a better labeling efficiency and higher QD fluorescence.
The biotinylated HaloTag ligand 2 was mixed with sQD655 at a ratio of 0:1, 5:1, 10:1 and 50:1 to make QD conjugates with a different density of HaloTag ligands. These conjugates were incubated with COS7 cells expressed mHTP and GFP. The QD conjugate with a high ligand density (50:1) showed successful specific labeling of membrane HTP, and the QD fluorescence correlated well with the GFP signal in transfected cells (Figure 2A). The QD conjugate with a low ligand density (5:1) displayed little detected QD fluorescence in comparison with the control without the HaloTag ligand (Figure 2B). The QD conjugate with a medium ligand density (10:1) showed detectable QD fluorescence but lower than that from the high ligand density construct. This result demonstrates the feasibility of one step direct labeling of HTP proteins in living cells, and also indicates the importance of the ligand density on the labeling efficiency. The similar density-dependent activity has also been observed with other QD nanoprobes [28].
Figure 2.
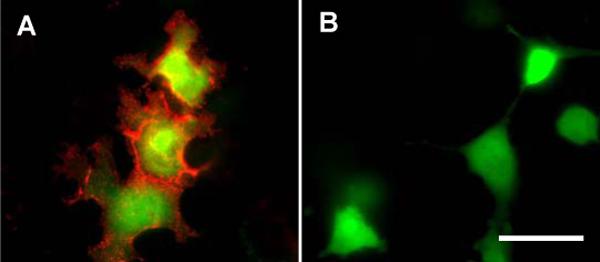
Direct labeling of a cell surface halo tag protein in living cells. COS7 cells expressing mHTP and EGFP as transfection marker are labeled with (A) or without (B) 20 nM of streptavidin coated QD conjugates with the HaloTag ligand 2 for 30 min in 37 °C. QD signal is acquired with 500 ms exposure. Shown images are overlaid frames of QD (red) and EGFP (green) fluorescence of the same region. Scale bar, 50 μm.
In summary, this communication presents a method for specific labeling of live cells using quantum dots. The labeling is mediated by the HaloTag protein expressed at the cell surface which forms a stable covalent adduct with its ligand (HaloTag ligand). We have demonstrated that the labeling can be performed in one single step with quantum dot conjugates presented with the HaloTag ligand. The density of the ligand on the conjugate has been found to be important to the labeling efficiency. This labeling can also proceed in two steps with an incubation of the biotinylated HaloTag ligand, followed by the binding of streptavidin coated quantum dots. In each case, fluorescence imaging indicates that the labeling is specific and takes place at the cell surface. This HaloTag protein-mediated cell labeling method should facilitate the application of quantum dots for live cell imaging.
Supplementary Material
Acknowledgements
This work was supported by the Burroughs Wellcome Fund, and the National Cancer Institute Centers of Cancer Nanotechnology Excellence (CCNE) 1U54CA119367-01.
Footnotes
Publisher's Disclaimer: This is a PDF file of an unedited manuscript that has been accepted for publication. As a service to our customers we are providing this early version of the manuscript. The manuscript will undergo copyediting, typesetting, and review of the resulting proof before it is published in its final citable form. Please note that during the production process errors may be discovered which could affect the content, and all legal disclaimers that apply to the journal pertain.
References
- 1.Giepmans BNG, Adams SR, Ellisman MH, Tsien RY. The fluorescent toolbox for assessing protein location and function. Science. 2006;312:217–224. doi: 10.1126/science.1124618. [DOI] [PubMed] [Google Scholar]
- 2.Marks KM, Nolan GP. Chemical labeling strategies for cell biology. Nat. Methods. 2006;3:591–596. doi: 10.1038/nmeth906. [DOI] [PubMed] [Google Scholar]
- 3.Foley TL, Burkart MD. Site-specific protein modification: advances and applications. Curr. Opin. Chem. Biol. 2007;11:12–19. doi: 10.1016/j.cbpa.2006.11.036. [DOI] [PubMed] [Google Scholar]
- 4.Johnsson N, Johnsson K. Chemical tools for biomolecular imaging. ACS Chem. Biol. 2007;2:31–38. doi: 10.1021/cb6003977. [DOI] [PubMed] [Google Scholar]
- 5.Chen I, Ting AY. Site-specific labeling of proteins with small molecules in live cells. Curr. Opin. Biotechnol. 2005;16:35–40. doi: 10.1016/j.copbio.2004.12.003. [DOI] [PubMed] [Google Scholar]
- 6.Miller LW, Cormish VW. Selective chemical labeling of proteins in living cells. Curr. Opin. Chem. Biol. 2005;9:1–6. doi: 10.1016/j.cbpa.2004.12.007. [DOI] [PubMed] [Google Scholar]
- 7.Dragulescu-Andrasi A, Rao J. Chemical labeling of protein in living cells. ChemBioChem. 2007;8:1099–1101. doi: 10.1002/cbic.200700158. [DOI] [PubMed] [Google Scholar]
- 8.Chapman S, Oparka KJ, Roberts AG. New tools for in vivo fluorescence tagging. Curr. Opin. Plant Biol. 2005;8:565–573. doi: 10.1016/j.pbi.2005.09.011. [DOI] [PubMed] [Google Scholar]
- 9.Murray CB, Norris DJ, Bawendi MG. Synthesis and characterization of nearly monodisperse CDE (E=S,Se,Te) semiconductor nanocrystallites. J. Am. Chem. Soc. 1993;115:8706–8715. [Google Scholar]
- 10.Dabbousi BO, RodriguezViejo J, Mikulec FV, Heine JR, Mattoussi H, Ober R, Jensen KF, Bawendi MG. (CdSe)ZnS core-shell quantum dots: synthesis and characterization of size series of highly luminescent nanocrystallites. J. Phys. Chem. B. 1997;101:9463–9475. [Google Scholar]
- 11.Alivisatos AP. The use of nanocrystals in biological detection. Nat. Biotechnol. 2004;22:47–52. doi: 10.1038/nbt927. [DOI] [PubMed] [Google Scholar]
- 12.Medintz IL, Uyeda HT, Goldman ER, Mattoussi H. Quantum dot bioconjugates for imaging, labeling and sensing. Nat. Mater. 2005;4:435–446. doi: 10.1038/nmat1390. [DOI] [PubMed] [Google Scholar]
- 13.Michalet X, Pinaud FF, Bentolila LA, Tsay JM, Doose S, Li JJ, Sundaresan G, Wu AM, Gambhir SS, Weiss S. Quantum dots for live cells, in vivo imaging, and diagnostics. Science. 2005;307:538–544. doi: 10.1126/science.1104274. [DOI] [PMC free article] [PubMed] [Google Scholar]
- 14.Gao X, Yang L, Petros JA, Marshall FF, Simons JW, Nie S. In vivo molecular and cellular imaging with quantum dots. Curr. Opin. Biotechnol. 2005;16:63–72. doi: 10.1016/j.copbio.2004.11.003. [DOI] [PubMed] [Google Scholar]
- 15.Pinaud F, Michalet X, Bentolila LA, Tsay JM, Doose S, Li JJ, Iyer G, Weiss S. Advances in fluorescence imaging with quantum dot bio-probes. Biomaterials. 2006;27:1679–1687. doi: 10.1016/j.biomaterials.2005.11.018. [DOI] [PMC free article] [PubMed] [Google Scholar]
- 16.Alivisatos AP, Gu W, Larabell C. Quantum dots as cellular probes. Annu. Rev. Biomed. Eng. 2005;7:55–76. doi: 10.1146/annurev.bioeng.7.060804.100432. [DOI] [PubMed] [Google Scholar]
- 17.Dubertret B, Skourides P, Norris DJ, Noireaux V, Brivanlou AH, Libchaber A. In vivo imaging of quantum dots encapsulated in phospholipid micelles. Science. 2002;298:1759–1762. doi: 10.1126/science.1077194. [DOI] [PubMed] [Google Scholar]
- 18.Gao X, Cui YY, Levenson RM, Chung LWK, Nie S. In vivo cancer targeting and imaging with semiconductor quantum dots. Nat. Biotechnol. 2004;22:969–976. doi: 10.1038/nbt994. [DOI] [PubMed] [Google Scholar]
- 19.Pinaud F, King D, Moore H-P, Weiss S. Bioactivation and cell targeting of semiconductor CdSe/ZnS nanocrystals with phytochelatin-related peptides. J. Am. Chem. Soc. 2004;126:6115–6123. doi: 10.1021/ja031691c. [DOI] [PMC free article] [PubMed] [Google Scholar]
- 20.Akerman ME, Chan WCW, Laakkonen P, Bhatia SN, Ruoslahti E. Nanocrystal targeting in vivo. Proc. Natl. Acd. Sci. USA. 2002;99:12617–12621. doi: 10.1073/pnas.152463399. [DOI] [PMC free article] [PubMed] [Google Scholar]
- 21.Charkrabarti R, Klibanov AM. Nanocrystals modified with peptide nucleic acids (PNAs) for selective self-assembly and DNA detection. J. Am. Chem. Soc. 2003;125:12531–12540. doi: 10.1021/ja035399g. [DOI] [PubMed] [Google Scholar]
- 22.Wu XY, Liu HJ, Liu JQ, Haley KN, Treadway JA, Larson JP, Ge NF, Peale F, Bruchez MP. Immunofluorescent labeling of cancer marker Her2 and other cellular targets with semiconductor quantum dots. Nat. Biotechnol. 2003;21:41–46. doi: 10.1038/nbt764. [DOI] [PubMed] [Google Scholar]
- 23.Dahan M, Levi S, Luccardini C, Rostaing P, Riveau B, Triller A. Diffusion dynamics of glycine receptors revealed by single-quantum dot tracking. Science. 2003;302:442–445. doi: 10.1126/science.1088525. [DOI] [PubMed] [Google Scholar]
- 24.So M-K, Xu C, Loening AM, Gambhir SS, Rao J. Self-illuminating quantum dot conjugates for in vivo imaging. Nat. Biotechnol. 2006;24:339–343. doi: 10.1038/nbt1188. [DOI] [PubMed] [Google Scholar]
- 25.Los G, Anson B, Zimprich C, Karassina N, January C, Buleit RF. FENS Forum. Federation of European Neuroscience Societies (FENS); Berlin: 2004. The HaloTag: a novel technology for protein labeling in living cells: effect of the HaloTag™ system on hERG channel activity; p. 196. [Google Scholar]
- 26.Janssen DB. Evolving haloalkane dehalogenase. Curr. Opin. Chem. Biol. 2004;8:150–159. doi: 10.1016/j.cbpa.2004.02.012. [DOI] [PubMed] [Google Scholar]
- 27.Zhang Y, So MK, Loening AM, Yao H, Gambhir SS, Rao J. HaloTag protein-mediated site-specific conjugation of bioluminescent proteins to quantum dots. Angew. Chem. Int. Ed. Engl. 2006;45:4936–4940. doi: 10.1002/anie.200601197. [DOI] [PubMed] [Google Scholar]
- 28.Xu C, Xing B, Rao J. A self-assembled quantum dot probe for detecting β-lactamase activity. Biochem. Biophys. Res. Commun. 2006;344:931–935. doi: 10.1016/j.bbrc.2006.03.225. [DOI] [PubMed] [Google Scholar]
Associated Data
This section collects any data citations, data availability statements, or supplementary materials included in this article.