

Abstract
Neuregulins (NRGs) are growth factors which bind to Erb receptor tyrosine kinases that localize to Schwann cells (SCs). Although NRGs can promote cell survival, mitogenesis, and myelination in undifferentiated SCs, they also induce demyelination of myelinated co-cultures of SCs and dorsal root ganglion (DRG) neurons. We have shown previously that Erb B2 activity increased in premyelinating SCs in response to hyperglycemia, and that this correlated with the downregulation of the protein caveolin-1 (Cav-1). As myelinated SCs undergo substantial degeneration in diabetic neuropathy, we used myelinated SC/DRG neuron co-cultures to determine if hyperglycemia and changes in Cav-1 expression could enhance NRG-induced demyelination. In basal glucose, NRG1 caused a 2.4-fold increase in the number of damaged myelin segments. This damage reached 3.8-fold under hyperglycemic conditions, and was also associated with a robust decrease in the expression of Cav-1 and compact myelin proteins. The loss of Cav-1 and compact myelin proteins following hyperglycemia and NRG treatment was not due to neuronal loss, since the axons remained intact and there was no loss of PGP 9.5, an axonal marker protein. To examine if changes in Cav-1 were sufficient to alter the extent of NRG-induced demyelination, SC/DRG neurons co-cultures were infected with antisense or dominant-negative Cav-1(P132L) adenoviruses. Either antisense-mediated downregulation or mis-localization of endogenous Cav-1 by Cav-1(P132L) resulted in a 1.5- to 2.4-fold increase in NRG-induced degeneration compared to that present in control cultures. These data support that hyperglycemia and changes in Cav-1 are sufficient to sensitize myelinated SC/DRG co-cultures to NRG-induced demyelination.
Keywords: Erb B2, myelination, myelin basic protein, neuregulins, Schwann cells
INTRODUCTION
One contributing factor in diabetic peripheral neuropathy (DPN) is an altered neurotrophism that results from a change in response to neurotrophic factors (Leinninger et al., 2004b). Axonal degeneration is clearly a hallmark of DPN in humans and animal models (Said, 2007), and considerable attention has focused on altered growth factor signaling in the degeneration of sensory neurons in diabetes. However, SCs also undergo substantial degenerative changes in DPN (Eckersley, 2002). SCs are critical in regulating and maintaining myelin thickness through axon-derived signals (Michailov et al., 2004), but axonal degeneration is not a necessary prerequisite for SC dysfunction that may contribute to extensive myelin splitting and segmental demyelination in diabetic humans and felines (Mizisin et al., 1998). Given the critical role of SCs in myelin maintenance and re-establishing axo-glial interactions necessary for nerve regeneration, it is important to identify the acute or chronic consequences of hyperglycemia on growth factor signaling in SCs.
NRGs are a family of growth factors that bind specifically to receptor tyrosine kinases of the Erb B family, which localize to SCs (Adlkofer and Lai, 2000). The cell biology of NRGs in SC function is complex, but directly relates to the regulation of cell proliferation (Morrissey et al., 1995), survival (Syroid et al., 1996), and differentiation (Michailov et al., 2004). The Erb B2-B3 heterodimer is highly expressed in neonatal SCs and is primarily responsible for NRG-induced receptor activation. Although precursor SCs are dependent upon NRG1 and Erb B2/B3 for maturation, proliferation, and survival (Dong et al., 1995; Garratt et al., 2000), NRGs also promote cholesterol synthesis (Pertusa et al., 2007) and the early events of myelination (Chen et al., 2006; Garratt et al., 2000) in SCs. Indeed, recent genetic studies provide strong evidence that axonally derived NRG1-Type III is critical to regulating myelin sheath thickness (Michailov et al., 2004; Taveggia et al., 2005). On the other hand, Erb B2 undergoes a rapid and transient increase in activity that is sufficient to initiate SC demyelination following axotomy in adult mice (Guertin et al., 2005). This degeneration may be mediated by NRG1-Type II (also called glial growth factor), since it induced demyelination in myelinated SC/sensory neuron co-cultures (Harrisingh et al., 2004; Zanazzi et al., 2001) and its genetic over-expression in SCs led to a demyelinating hypertrophic neuropathy (Huijbregts et al., 2003). These data provide compelling support that altering the expression/activity of the NRG/Erb B ligand-receptor pair is sufficient to induce demyelination. Hence, changes in the expression of proteins that affect Erb B2 activity may have an important impact in promoting SC degeneration.
Caveolin-1 (Cav-1) is a primary protein component of caveolae (Dobrowsky, 2000) and is particularly enriched in mature, myelinated SCs (Mikol et al., 1999). The interaction of Cav-1 with Erb B2 can inhibit its intrinsic tyrosine kinase activity (Engelman et al., 1998), and downregulation of Cav-1 in primary SCs can increase Erb B2 activity (Tan et al., 2003). In this study, we sought to determine if hyperglycemia and changes in Cav-1 expression were sufficient to alter the extent of NRG-induced demyelination of myelinated SC/DRG co-cultures. Hyperglycemic stress resulted in a decrease in the expression of Cav-1 and enhanced the magnitude of NRG-induced demyelination and loss of myelin proteins. This effect was not due to osmotic stress as it could not be recapitulated by incubation of the cultures with mannitol. Antisense-mediated downregulation of Cav-1 or mis-localization of endogenous Cav-1 following expression of a dominant-negative Cav1(P132L) mutant in the myelinated co-cultures was sufficient to enhance the magnitude of Erb B2 degeneration. Together, these results provide the first molecular characterization that hyperglycemia and decreased expression of Cav-1 are sufficient to enhance NRG-induced degeneration of myelinated axons.
MATERIALS AND METHODS
Preparation of SCs and Myelinated SC/DRG Co-Cultures
SCs were isolated from postnatal Day 2 or Day 3 rat pups as described (Tan et al., 2003). DRG neurons were dissected from embryonic Day 15 rat pups (Zanazzi et al., 2001), ganglia were collected into L15 medium and sedimented at 1,000g for 5 min. After tissue dissociation with 0.25% trypsin at 37°C for 30 min, the cells were resuspended in DMEM containing 25 mM glucose, 10% fetal calf serum (FCS, Atlas Biologicals, Fort Collins, CO) and triturated with a fire-polished glass pipette. The cells were counted and plated in maintenance medium (DMEM containing 25 mM glucose, 10% FCS, 100 U/mL penicillin, 100 μg/mL streptomycin, 50 μg/mL gentamicin, and 50 ng/mL NGF (Harlan Biosciences, Indianapolis, IN) in the center of collagen-coated (0.1 mg/mL collagen overnight followed by crosslinking with conc. ammonium hydroxide for 15 min) glass coverslips or 35 mm culture dishes. The cells were seeded at a density of 6-7 × 10⁴ per coverslip and 2-3 × 10⁵ per 35-mm dish. To remove proliferating cells, the neurons were treated with 10 μM each of fluorodeoxyuridine and cytosine β-D-arabi-noside for 2 days. Fresh maintenance medium without the anti-mitotics was added, and the neurons were maintained for 2 days. This cycle was repeated twice more, and the neurons were kept in maintenance media for 14 days until the addition of purified SCs. Between 5-10 × 104 purified SCs cells per coverslip were seeded onto the DRG neuron cultures depending upon neuronal density, and about 4 × 10⁵ purified SCs were added per 35-mm dish of DRG neurons. The next day, the cultures were switched to serum-free DMEM with 50 ng/mL NGF for 3 days to allow the SCs to populate the neurites. To initiate myelination, the co-cultures were placed in maintenance medium supplemented with 50 μg/mL ascorbic acid. The cells were maintained for 15-18 days with medium replenishment every 2-3 days.
Glucose Treatments and Biochemical Analyses
The co-cultures were exposed to the glucose concentrations described in the text for 5-7 days in the absence or presence of human recombinant NRG-1-β1 epidermal growth factor domain (aa 176-246) (NRG1, R&D Systems, Minneapolis, MN). For immunoblot analysis, the cells were scraped into lysis buffer (50 mM Tris-HCl, pH 7.4, 150 mM NaCl, 1 mM EDTA, 1% NP-40, 1% deoxy-cholate, 0.1% SDS, 0.5 mM sodium orthovandate, 40 mM NaF, 10 mM β-glycerophosphate, and 1× Complete® Protease Inhibitors, Roche Diagnostics), sonicated and the lysate centrifuged at 10,000g for 10 min at 4°C. The protein concentration of the supernatant was measured using the Bio-Rad reagent and the proteins were separated by SDS-PAGE. After transfer to nitrocellulose, the blots were probed with the antibodies against the myelin-associated enzyme 2′,3′ cyclic nucleotide phosphodiesterase (CNPase, SMI-91R, Sternberger Monoclonals, Lutherville, MD), compact myelin protein zero (P0), ubiquitin C-terminal hydrolase (PGP 9.5) (both from Chemicon, Temecula, CA), N20 Cav-1 or β-actin (both from Santa Cruz Biotechnology, Santa Cruz, CA). Antibodies against Akt and phospho-Akt were from Cell Signaling Technology (Beverly, MA).
Immunofluorescence Analysis
For immunofluorescence analysis of myelination, the co-cultures were washed, fixed with 4% paraformaldehyde for 20 min at room temperature, and permeabilized with -20°C methanol for 15 min. The cells were blocked with 10% normal goat serum containing 0.3% Triton X-100 for 15 min at room temperature and incubated overnight in a humidified chamber with a 1:500 dilution of anti-myelin basic protein (MBP) SMI-94R (Sternberger Monoclonals) or PGP 9.5 in 10% normal goat serum. After the primary antibody incubations, a 1:400 dilution of Alexa Fluor 568 or Alexa Fluor 488-conjugated secondary antibodies were added for 2 h at room temperature. After washing, the nuclei were stained with DAPI for 5 min, the coverslips washed again, and mounted on slides using Permount. Images were captured on a Zeiss LSM 510 Meta Confocal microscope. To quantify NRG1-induced demyelination, the number of myelin segments from six random fields per treatment were counted and expressed as a percent of the total number of segments. At least 300 segments per treatment were counted by an investigator blinded to treatment.
Adenoviral Infections
Preparation of recombinant adenoviruses co-expressing the green fluorescent protein were as previously described (Li et al., 2003). Fully myelinated SC/DRG co-cultures were infected with blank, antisense Cav-1 (Tan et al., 2003) or Cav-1(P132L) adenoviruses for 48 h at 252100 pfu/cell. The later virus was prepared by site-directed mutagenesis of Cav-1 cDNA using the Quick Change II site-directed mutagenesis kit (Stratagene, LaJolla, CA) prior to being subcloned into the pAdTrack shuttle vector. After infection, the medium was removed and the cells were placed in fresh maintenance medium prior to being treated with NRG1 for 48 h. The cells were washed with phosphate buffered saline and scraped into ice-cold lysis buffer for immunoblot analysis, or prepared for immunofluorescent analysis as described above.
Statistical Analysis
For data sets subjected to statistical analysis, equality of variance was verified prior to using a one-way analysis of variance and Tukey’s post hoc test.
RESULTS
Myelinated SC/DRG Neuron Co-Cultures As a Relevant Model to Examine the Role of Hyperglycemia and Cav-1 in NRG Signaling
To examine if hyperglycemia and changes in Cav-1 expression are sufficient to enhance NRG-induced demyelination, we used myelinated co-cultures of SC/DRG neurons as a relevant and well-documented cell model of myelinated nerve. As expected, ascorbic acid treatment of the SC/DRG neuron co-cultures increased the expression of the myelin-associated protein CNPase and Cav-1 (Fig. 1A). Since Cav-1 expression increases with ongoing myelination in developing nerve (Mikol et al., 2002), the co-culture system clearly mimics this developmental expression. Importantly, the increase in Cav-1 is not solely due to SC proliferation since premyelinating co-cultures maintained in the absence of ascorbate for 21 days did not show the same increase in Cav-1 expression as compared to the ascorbate-treated co-cultures.
Fig. 1.
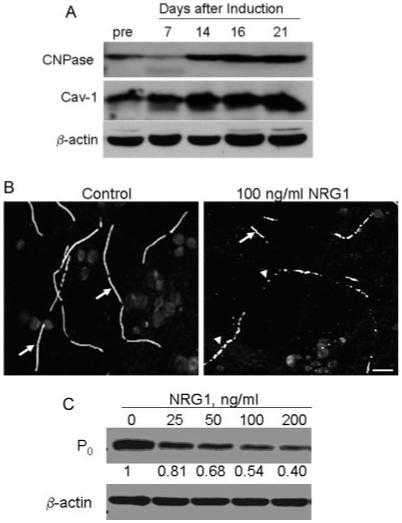
Cav-1 expression and NRG-induced degeneration in SC/DRG neuron co-cultures. (A) Co-cultures were induced to myelinate and the expression of Cav-1, CNPase, and β-actin were determined by immunoblot analysis. pre, premyelinating co-culture. (B) Myelinated SC/DRG neuron co-cultures were treated with buffer or 100 ng/mL NRG1 for 48 h and myelin segments were visualized by immunostaining for MBP. Arrows indicate intact internodes in control panel. Cells treated with NRG1 show shorter internode and extensive vesiculation (arrowheads). Scale bar, 25 lm. (C) Co-cultures were treated with the indicated concentration of NRG1 for 48 h. P0 and β-actin were detected by immunoblot analysis. Fold change relative to the control is indicated. All data are results from one experiment repeated at least twice with similar outcomes.
Consistent with previous results (Harrisingh et al., 2004; Zanazzi et al., 2001), treatment of the myelinated SC/DRG neuron co-cultures with 100 ng/mL NRG for 48 h led to a robust loss of myelin membrane integrity as visualized by a decrease in the immunoreactivity for MBP, and an increase in the number of vesiculated or crenated myelin sheaths (arrowheads, Fig. 1B). This degeneration was also accompanied by a 50% decrease in the expression of another compact myelin protein, P0 (Fig. 1C). However, 25 ng/mL of NRG1 (∼3 nM) only caused about a 20% loss of P0 expression. Since this concentration of ligand induced a modest degree of degeneration, it was used in all subsequent studies to elucidate any enhancing effects of hyperglycemia on NRG1 signaling.
Hyperglycemia Sensitizes Myelinated SC/DRG Co-Cultures to NRG1-Induced Demyelination
To examine the effect of hyperglycemia on NRG1-induced degeneration, myelinated SC/DRG neuron co-cultures were incubated in standard maintenance medium containing 25 mM glucose, or medium that was supplemented with 30 mM glucose to yield a final glucose concentration of 55 mM. As discussed below, this in vitro system does not reproduce hyperglycemia as seen in vivo but reflects standard culture conditions that have been developed to maintain neuronal viability and maximum myelination (Einheber et al., 1993). The cultures were maintained in the basal or high glucose medium for 4-7 days (medium replenished every 2 days) prior to receiving buffer or 25 ng/mL NRG1 for the final 48 h.
Co-cultures maintained in medium containing 25 mM glucose had a basal level of damaged myelin segments of about 13.5% of the total number of segments counted (Figs. 2A,C). Notably, despite a glucose concentration of 55 mM glucose, hyperglycemia alone did not significantly increase the number of damaged myelin segments or decrease the total number of myelinated segments in the cultures (basal glucose—386 segments; hyperglycemia—353 segments). Moreover, substitution of 30 mM mannitol for the excess glucose also had no effect on altering internode morphology or increasing the basal level of damaged myelin segments (Figs. 2B,C). These data indicate that neither hyperglycemia nor enhanced osmolarity is sufficient to alter the integrity of the myelin segments in the absence of NRG1.
Fig. 2.
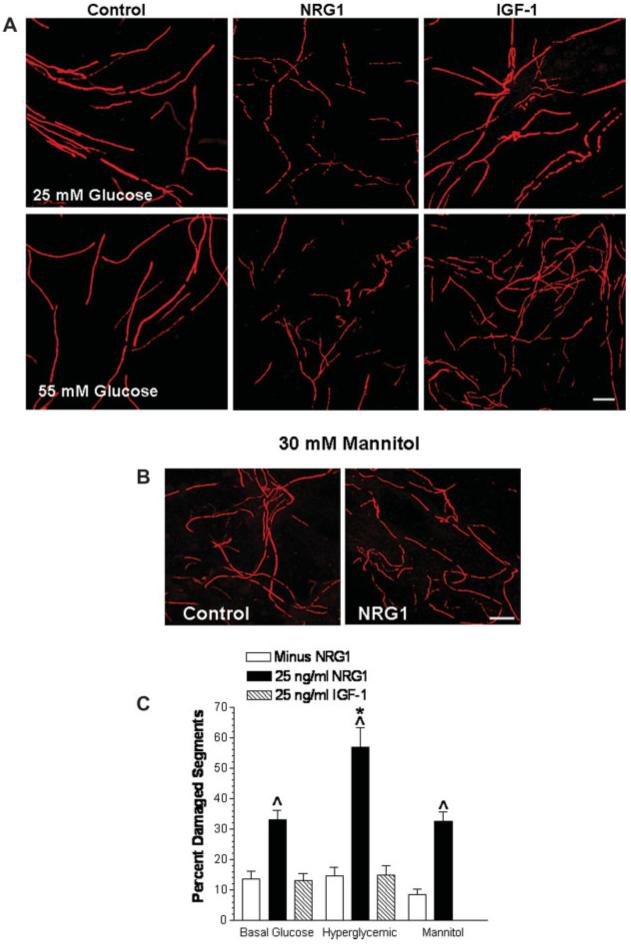
Hyperglycemia enhances NRG1-induced degeneration. (A) Fully myelinated co-cultures were incubated in 25 or 55 mM glucose for 7 days and treated with buffer, 25 ng/mL NRG1, or 25 ng/mL IGF-1 for the final 2 days. Myelin segments were visualized by immunostaining for MBP and imaged by confocal microscopy. (B) Cells were incubated in 25 mM glucose supplemented with 30 mM mannitol for 7 days and treated with 25 ng/mL NRG1 for the final 2 days. Myelin segments were visualized by immunostaining for MBP. (C) Quantification of damaged myelin segments. Data are mean ± SEM of six random fields per treatment from two separate experiments. Carats, P < 0.001 versus the absence of NRG1. Asterisk, P < 0.001 versus 25 mM glucose + NRG1. Scale bar, 25 μm.
When the myelinated co-cultures were incubated in 25 mM glucose for 7 days, the addition of 25 ng/mL NRG1 for the final 48 h resulted in a 2.4-fold increase in the number of damaged myelin segments. However, NRG1 induced a 3.9-fold increase in the number of damaged segments when the co-cultures were maintained in medium containing 30 mM excess glucose for 7 days prior to the addition of 25 ng/mL NRG1 for the final 48 h. Importantly, the extent of the NRG1-induced damage observed under hyperglycemic conditions (55 mM glucose) was significantly greater than that observed in NRG1-treated cultures maintained in 25 mM glucose (Fig. 2B, solid bars). These data support that hyperglycemia sensitized the cells to the degenerating effects of NRG1.
Similar to NRG1, insulin-like growth factor 1 (IGF-1) can also increase myelination and activate most of the same downstream signaling pathways (Ogata et al., 2004). However, IGF-1 had no substantial effect on increasing the number of damaged myelin segments under either basal or hyperglycemic conditions (Figs. 2A,C). Indeed, incubation of the co-cultures in medium with 25 ng/mL IGF-1 actually increased the number of myelin segments, consistent with its effect on increasing myelin protein expression (Ogata et al., 2004). These data clearly support that IGF-1 cannot induce demyelination and that hyperglycemia is not nonspecifically altering growth factor signaling to increase the extent of demyelination by NRG1.
It is important to note that the loss of compact myelin proteins was not restricted to MBP. For example, incubation of the co-cultures with 45 mM glucose for 7 days also increased the loss of P0 induced by NRG1 treatment for 2 days (Fig. 3A). Similarly, NRG1 did not markedly decrease the expression of the myelin-associated protein, CNPase, when the cultures were maintained in 25 mM glucose for 7 days (Fig. 3B). However, 25 ng/mL NRG1 induced a greater loss of CNPase expression in co-cultures maintained in the presence of 55 mM glucose for 7 days (final 2 days with NRG1). Additionally, 55 mM glucose alone induced a progressive decrease in Cav-1 expression over 7 days in the co-cultures and not surprisingly, this loss was accentuated by NRG1. These results recapitulate the loss of Cav-1 observed in diabetic nerve (Tan et al., 2003) and highlight the value of the SC/DRG neuron co-cultures for assessing mechanisms underlying glucose-induced damage to myelinated axons via NRGs.
Fig. 3.

Hyperglycemia enhances the loss of myelin proteins by NRG1. (A) Fully myelinated co-cultures were incubated in medium with 25, 45, or 55 mM glucose for 7 days and treated with buffer or 25 ng/mL NRG1 for the final 48 h. Immunoblot analysis for P0 and β-actin was performed. (B) Fully myelinated co-cultures were maintained for 4 or 7 days in 25 or 55 mM glucose and treated for the final 2 days with NRG1. The expression of CNPase, Cav-1, and β-actin was determined by immunoblot analysis. Results are from one experiment repeated three times with similar outcomes.
NRG-Induced Demyelination Is a Consequence of the Relative Increase in Glucose and Is Not Associated with Axon Loss
One contentious issue in using the myelinated SC/DRG neuron co-culture system in diabetes research relates to the basal glucose concentration in the culture medium. Embryonic SC/DRG neuron co-cultures are typically maintained in medium containing 25 mM basal glucose, which facilitates early survival and robust myelination. This equates to a baseline glucose concentration of ∼450 mg/dL, which arguably already mimics a severe in vivo diabetic state. Addition of 20-30 mM glucose above this level clearly gives absolute glucose concentrations that are supra-physiologic (∼800-990 mg/dL). Nevertheless, justifiable arguments have been put forth that the addition of 20-30 mM excess glucose to the cultured embryonic DRG neurons is reflective of the relative increase in glucose concentrations that occurs in diabetic individuals, and that this increase in glucose is similar to that used in other cell models of hyperglycemia (Leinninger et al., 2004a). Therefore, we examined whether the increased in NRG1-induced degeneration was an artifact of the supra-physiologic glucose concentration.
To address this issue, we developed an alternative paradigm for examining the effect of hyperglycemia on NRG-induced degeneration. Adult DRG neurons have a lower requirement for glucose and fair quite well in 5.5 mM glucose (Huang et al., 2003). Since the mature, myelinated SC/DRG neuron co-cultures are extensively differentiated, we examined if they would mimic adult DRG neurons and remain viable in culture medium containing 5.5 mM glucose. The co-cultures were myelinated in maintenance medium containing 25 mM glucose and ascorbic acid as described in the Methods section and then switched to maintenance medium containing either 25 or 5.5 mM glucose for 5 days. During this period, the co-cultures exhibited no signs of cell death and were indistinguishable from cultures maintained in 25 mM glucose for the entire duration (Fig. 4A). After this re-equilibration period, hyperglycemia was induced by the addition of glucose to a final concentration of 10-30 mM, and the cells were incubated for 7 days. NRG1 or buffer was added for the final 2 days and the cells were prepared for immunoblot or immunofluorescence analysis. Similar to the NRG-treated cultures incubated in the presence of 55 mM glucose (Fig. 3A), 30 mM glucose still significantly increased the loss of P0 expression (Fig. 4B). Although 10 and 20 mM glucose also increasedthe loss of P0 by NRG1 treatment, this did not quite reach the level of statistical significance. Nonetheless, these data support that glucose enhances NRG1-induced demyelination at concentrations that avoid issues of physiological relevance.
Fig. 4.
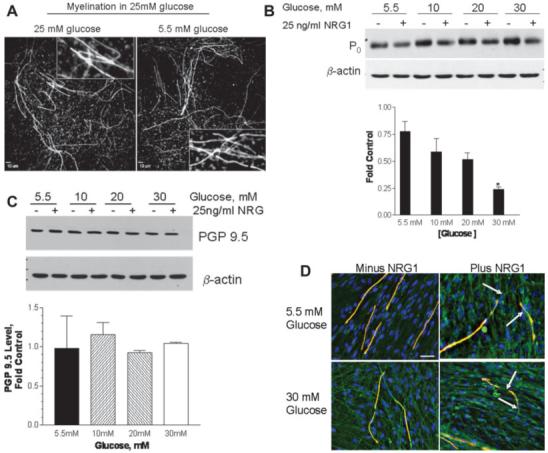
NRG-induced demyelination is not associated with axonal loss. (A) SC-DRG neuron co-cultures were myelinated in medium with 25 mM glucose and the cultures switched to fresh medium containing basal glucose concentrations of 25 or 5.5 mM for 5 days. The cells were stained with the anti-MBP antibody and nuclei were visualized with DAPI. Inset shows zoomed images of myelin segments and indicate that incubation in 5.5 mM glucose had no effect on segment morphology. Scale bar, 10 μm. (B, C) Fully myelinated co-cultures were maintained for 5 days in 5.5 mM glucose and the glucose concentration was raised to 10-30 mM. The cells were incubated for 7 days and treated with 25 ng/mL NRG1 for the final 2 days. Upper panels show representative immunoblots for the expression of P0 (B) and PGP 9.5 (C). Equivalent protein loading was demonstrated using β-actin. The intensity of the P0 and PGP 9.5 bands were normalized to β-actin and the data is expressed as a fold of the untreated (minus NRG1) control at each glucose concentration. Lower panels show densitometric quantitation of immunoblot results obtained from four experiments. Results are mean ± SEM and the asterisk indicates P < 0.01 versus control. (D) The co-cultures were treated as indicated and stained for MBP (red), PGP 9.5 (green), and DAPI (blue). The images were merged and areas of myelin loss with maintenance of axonal integrity are indicated by the arrows. Scale bar, 25 μm.
Finally, to determine if the overall demyelination may relate to an axonal loss, we assessed the effect of hyperglycemia and NRG1 treatment on the expression of the axonal marker PGP 9.5 (Christianson et al., 2003). In contrast to the robust decrease in P0 expression induced by NRG1 in the presence of 30 mM glucose, no change in the expression of PGP 9.5 was noted (Fig. 4C). Indeed, although NRG1 induced myelin damage under both normo- and hyperglycemic conditions, the axons remained intact (Fig. 4D). It is notable that glucose concentrations of 40-50 mM can induce death in immature neurons (Vincent et al., 2005), whereas adult sensory neurons are refractory to glucose-induced apoptosis (Huang et al., 2003; Purves et al., 2001). Since hyperglycemia enhances the demyelinating effects of NRG1 without impacting on neuronal loss, our data would be consistent with the myelinated co-cultures serving as a reasonable model of adult sensory neurons.
Forced Alteration of Cav-1 Expression in SCs Is Sufficient to Alter Erb B2 Activation and Enhance NRG1-Induced Demyelination
Since Cav-1 is a negative regulator of Erb B2 (Engelman et al., 1998), we hypothesized that changes in Cav-1 expression may directly increase the degenerative effect of Erb B2 activation in myelinated SC/DRG neuron co-cultures. To alter Cav-1 expression, we generated antisense and Cav-1(P132L) adenoviruses and documented their functionality in promyelinating SCs. Following stimulation with 50 ng/mL NRG1, SCs infected with a blank adenovirus exhibited a rapid activation of Erb B2 that declined quite substantially within 60 min (Fig. 5A). Erb B2 activation also correlated with an increase in Akt phosphorylation, a known target of Erb B2 (Esper et al., 2006). Following forced downregulation of Cav-1, 50 ng/mL NRG1 resulted in a more prolonged activation of Erb B2 over 60-120 min, and this was associated with a more prolonged phosphorylation of Akt (Fig. 5B). Since the interaction of Cav-1 with Erb B2 should occur within plasma membrane lipid rafts, we also blocked transport of endogenous Cav-1 from the golgi to the plasma membrane by expressing the Cav-1 (P132L) mutation (Lee et al., 2002). To document the effectiveness of Cav-1(P132L), SCs were infected for 2 days with the Cav-1(P132L) adenovirus and membrane rafts were isolated by isopycnic sucrose density gradient centrifugation following solubilization of the cells in ice-cold 1% Triton X-100 (Bilderback et al., 1999). As expected, expression of Cav-1(P132L) effectively shifted the pool of endogenous Cav-1 present in a detergent-insoluble, low buoyant density membrane fraction to regions of higher density (Fig. 5C), and also modestly prolonged the activation of Erb B2 by NRG1 in primary SCs (Fig. 5D).
Fig. 5.
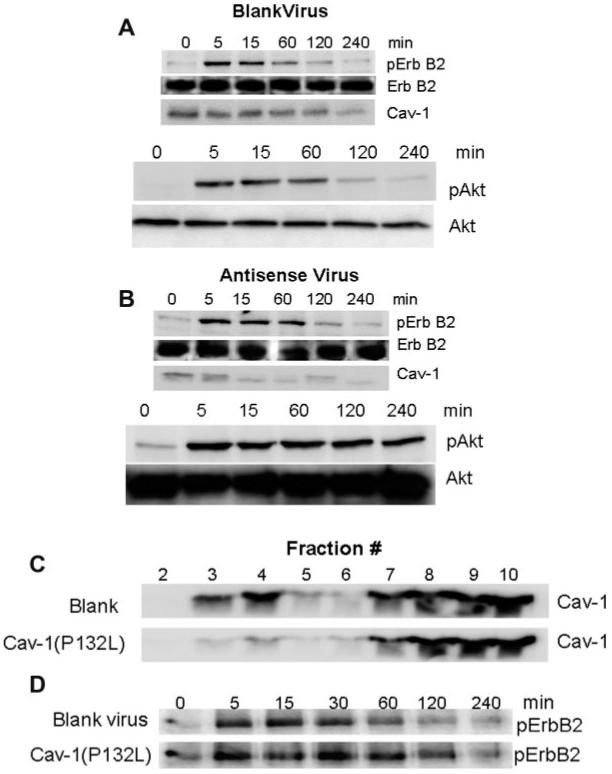
Changing the expression or localization of Cav-1 is sufficient to alter Erb B2 activation. SCs were infected with blank (A) or antisense Cav-1 (B) recombinant adenoviruses for 48 h and stimulated with 50 ng/mL NRG1 for the indicated time. The expression of pErb B2, total Erb B2, Cav-1, pAkt, and total Akt were determined by immunoblot analysis. (C) SCs were infected with a blank or Cav-1(P132L) recombinant adenovirus for 48 h and lipid raft membranes were prepared. The expression of Cav-1 was determined in each gradient fraction by immunoblot analysis. (D) SCs were infected with a blank or Cav-1(P132L) adenovirus for 48 h and then stimulated with 50 ng/mL NRG1 for the indicated time. The expression of pErb B2 from whole cell lysates was determined by immunoblot analysis. All data are from one experiment repeated 2-3 times with similar outcomes.
To assess the effect of altering Cav-1 expression on NRG1-induced demyelination, fully myelinated SC/DRG neuron co-cultures were infected with each of the adeno-viruses for 2 days followed by treatment with buffer or 25 ng/mL NRG1 for 48 h. Since Cav-1 is upregulated during myelinogenesis in the co-cultures (Fig. 1A), we chose this route to avoid any potentially confounding effects of altering Cav-1 expression in regulating myelination. No difference was evident in the basal level (minus NRG1) of damaged myelin segments in cultures infected with the various adenoviruses (Figs. 6A,B, open bars). Of note, the level of basal damage was very similar to uninfected SC/DRG neuron co-cultures (Fig. 2C). Similar to the uninfected cultures as well, NRG1 treatment increased the number of damaged myelin segments about 3-fold in co-cultures infected with the blank adenovirus (Figs. 6A,B). Thus, infection of the cultures with the blank adenovirus had no effect on changing the response to NRG1. In contrast, downregulating Cav-1 increased the magnitude of NRG1-induced degeneration about 6-fold above control levels, while mis-localization of Cav-1 led to a 8.9-fold increase in the number of damaged segments compared to its respective control. Importantly, the magnitude of this damage was significantly different from co-cultures infected with the blank virus and treated with NRG1 (Fig. 6B, compare solid bars). CNPase expression was also more substantially decreased in cultures infected with the antisense or Cav-1(P132L) adenoviruses as well (Fig. 6C). These results support that either decreasing overall Cav-1 levels or altering its localization from lipid raft membranes is sufficient to sensitize the co-cultures to the degenerative effect of Erb B2 activation.
Fig. 6.
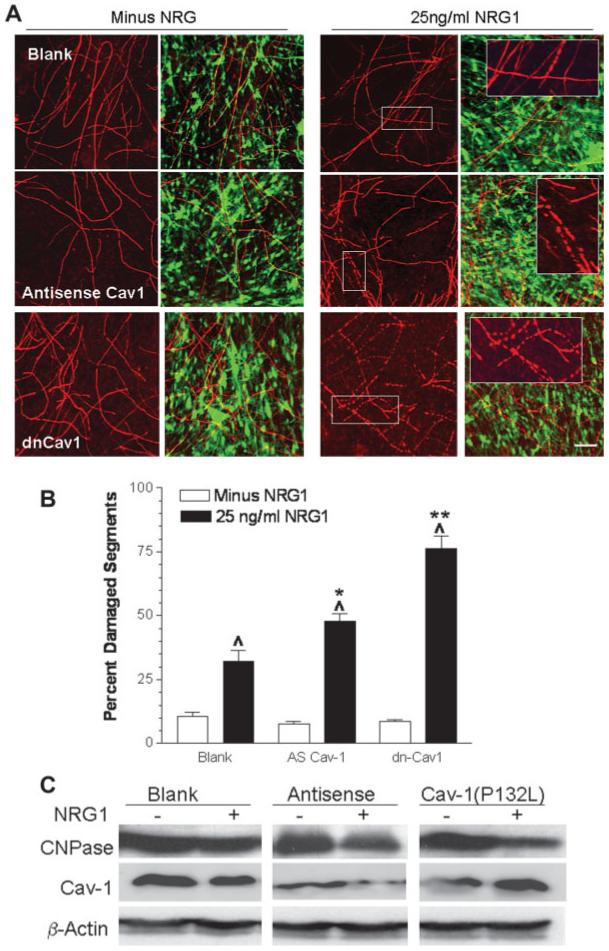
NRG1-induced degeneration is enhanced by altering Cav-1 expression. (A) Fully myelinated co-cultures were infected with blank, antisense or Cav-1(P132L) recombinant adenoviruses for 48 h then treated with buffer or 25 ng/mL NRG1 for an additional 48 h. Myelin segments (left panels) were visualized by immunostaining for MBP. Right panels show the merged images for MBP-positive myelin segments and GFP infected cells. Insets show zoomed images of the boxed regions. Scale bar, 25 lm. (B) Quantification of damaged myelin segments. Data are the mean ± SEM from two experiments. Carats, P < 0.001 versus minus NRG1. Single and double asterisks, P < 0.05 and P < 0.001 versus blank virus plus NRG1, respectively. (C) Fully myelinated co-cultures were infected with the various adenoviruses and treated with 25 ng/mL NRG1 as described above. Whole cell lysates were prepared and immunoblot analysis for CNPase, Cav-1, and β-actin was performed.
DISCUSSION
Myelinated co-cultures of SCs and sensory neurons have found wide application as an in vitro model of peripheral nerve. Although the myelin segments produced in these co-cultures mimic many of the structural and biochemical properties of peripheral nerve (Maurel and Salzer, 2000; Taveggia et al., 2005; Zanazzi et al., 2001), this system has received scant attention as a relevant model for examining the response of myelinated nerves to diabetes. Similarly, little attention has been given to determining the effect of diabetes on NRG levels in vivo or ascertaining if hyperglycemia may alter NRG/Erb B2 signaling, despite the dynamic role of NRGs in regulating the SC phenotype.
Our data provide initial evidence which supports that hyperglycemia is sufficient to increase the demyelinating effect of NRG1 in a cell model of peripheral nerve. It is noteworthy that hyperglycemia was not sufficient to induce significant myelin damage or reduce the total number of myelin segments. This was evident regardless of an absolute glucose concentration of 30-55 mM. Importantly, although NRG-induced demyelination was increased at an absolute glucose concentration of 55 mM, this effect was still observed when we used an alternative culture condition that equilibrated the myelinated cultures in 5.5 mM glucose prior to the induction of hyperglycemia with 30 mM glucose. The switch to 5.5 mM glucose had no effect on the viability of the cultures, and permitted us to induce hyperglycemia at glucose concentrations that more closely mimic those obtained in diabetic animal models and poorly controlled diabetes in humans.
It is important to note that the metabolic needs of immature DRG neurons are more readily sustained using a medium containing 25 mM basal glucose. Indeed, although we observed that the young DRG neurons could survive in medium with 5.5 mM glucose, myelination was not robust (data not shown). As young (3 days in vitro) DRG neurons readily undergo apoptosis in the presence of 45-55 mM glucose, much debate has centered on the physiological relevance of these hexose concentrations to the diabetic state. Additionally, debate has centered upon whether immature and undifferentiated neurons represent a viable model of the mature and highly differentiated neurons that are subjected to diabetic stress in vivo. It has been reasonably argued that the relative increase in glucose in the neuronal cultures is reflective of that seen in diabetic animals and humans (Leinninger et al., 2004a), regardless of the absolute glucose concentration. Our results would suggest that this argument has merit, since once the cultures were re-equilibrated in medium containing 5.5 mM glucose, induction of hyperglycemia with 30 mM glucose still enhanced NRG1-induced demyelination. However, demyelination was not a consequence of neuronal loss as the expression of the axonal marker PGP 9.5 did not change after 7 days in 10-30 mM glucose. Since all the neurons in the co-cultures do not become myelinated, these results suggest that the fully differentiated sensory neurons in the co-culture system display at least acute resistance (7 days) to glucose-induced death and do not undergo rapid cell death similar to younger neurons. In this regard, the differentiated embryonic neurons are similar to sensory neurons isolated from adult animals (Fernyhough et al., 2003), and we propose that the myelinated SC/DRG neuron co-cultures represent a viable paradigm for mechanistic investigations of the effect of hyperglycemia on myelinated peripheral nerve.
We have previously shown that diabetes induced a progressive decrease in the expression of Cav-1 in SCs of sciatic nerve (Tan et al., 2003). This relationship was recapitulated in the myelinated SC/DRG neuron co-cultures, since Cav-1 expression was also decreased after 4-7 days of hyperglycemia. Moreover, either downregulating overall Cav-1 levels or mis-localizing Cav-1 from plasma membrane lipid rafts by expression of the Cav1(P132L) mutation, prolonged the kinetics of Erb B2 activation in primary SCs, and sensitized the myelinated co-cultures to NRG1-induced demyelination. However, downregulating Cav-1 was not sufficient to increase the basal level of degeneration, suggesting that its absence was not leading to spontaneous activation of Erb B2. These in vitro data suggest that the interaction of Erb B2 and Cav-1 may contribute to regulating Erb B2 activity in SCs. Whether Cav-1 may function similarly in vivo and have a broader function in regulating nerve metabolism is currently being investigated using the Cav-1 knockout mice. Indeed, Cav-1 is emerging as a potentially important target in diabetic tissue. Komers et al. recently showed that Cav-1 decreased in the renal cortex of moderately diabetic rats and implicated the loss of Cav-1 in contributing to the dysregulation of endothelial nitric oxide synthase (Komers et al., 2006). With the emerging evidence that controlling the extent of protein nitration in diabetic nerve can attenuate multiple measures of neuropathy (Drel et al., 2006; Obrosova et al., 2005), decreased Cav-1 expression may also provide a mechanism for dysregulation of nitric oxide synthase in SCs.
Our data support that hyperglycemia and changes in Cav-1 are sufficient to enhance the degenerative effect of NRG1 on internode integrity and decrease the expression of compact myelin proteins in myelinated SC/DRG neuron co-cultures. These data raise the possibility that NRG-induced demyelination may contribute, in part, to segmental demyelination characteristic of DPN. Alternatively, altered NRG1 signaling may be insufficient to induce an overt demyelination in vivo, but contribute to the functional deficits in myelinated nerve. Indeed, demyelination of sciatic nerve is a not phenotypic hallmark of disease progression in rat models of DPN, although some myelin thinning does occur in sural and tibial nerves of long-term diabetic mice (Kennedy and Zochodne, 2005; Toth et al., 2007). In axotomized nerve, Erb B2 activation localizes to the nodal/paranodal region (Guertin et al., 2005) and Cav-1 also localizes to this region (Mikol et al., 1999). At the paranode, specialized axoglial interactions occur that help tether the SC to the nodal axolemma (Scherer and Arroyo, 2002). Thus, it is possible that Erb B2 activation may contribute to early changes in conduction velocity of myelinated nerve that are hallmarks of neuropathy in rodents. However, as sensory neurons responsible for thermal sensation tend to be thinly myelinated or unmyelinated, we would anticipate that changes in Erb B2 signaling would have less effect on these neurons.
DPN is characterized by a highly dynamic and progressive dying-back axonopathy that does not occur in a temporally simultaneous fashion (Apfel, 1999). However, as axonal damage is not a definitive prerequisite for SC dysfunction in DPN, SC injury may directly contribute to DPN even in the absence of extensive axonopathy (Mizisin et al., 1998). For example, the segmental demyelination that is a characteristic of DPN in humans maintains axonal integrity, but requires SC dysfunction. This facet of the degeneration was recapitulated, in part, by the axo-glial interactions in the co-culture system, since regions of myelin loss clearly surrounded an intact axon. Although it is unknown whether this focal demyelination in humans arises from a single initiating signal or is a consequence of multiple metabolic insults arising from glucose neurotoxicity (Tomlinson and Gardiner, 2008), our data would suggest that NRG1 signaling is at least sufficient to contribute to this pathology. However, additional work is required to determine if NRG isoforms contribute to neural and glial dysfunction in either diabetic humans or rodents.
To conclude, we propose that the myelinated SC/DRG neuron co-cultures provide a physiologically relevant model for potentially recapitulating molecular events that underlie the dysfunction of glycemically stressed myelinated nerves in vivo. The ability of NRGs to affect SC regeneration/degeneration necessitates an identification of how changes in the SC proteome may facilitate or antagonize Erb B2 activation during the progression of DPN. Elucidating the dynamic role of NRGs in diabetic nerve may provide for novel therapeutic approaches in treating DPN.
Acknowledgments
Grant sponsor: NIDDK; Grant number: DK073594; Grant sponsor: American Diabetes Foundation.
Abbreviations
- Cav-1
Caveolin-1
- CNPase
2′,3′ Cyclic nucleotide phosphodiesterase
- DPN
Diabetic peripheral neuropathy
- DRG
Dorsal root ganglion
- FCS
Fetal calf serum
- GFP
Green fluorescent protein
- MBP
Myelin basic protein
- NRG1
Human recombinant neuregulin1-β1 epidermal growth factor domain
- P0
Protein zero
- PGP 9.5
Protein gene product 9.5
- SCs
Schwann cells
REFERENCES
- Adlkofer K, Lai C. Role of neuregulins in glial cell development. Glia. 2000;29:104–111. doi: 10.1002/(sici)1098-1136(20000115)29:2<104::aid-glia2>3.0.co;2-2. [DOI] [PubMed] [Google Scholar]
- Apfel SC. Nerve regeneration in diabetic neuropathy. Diabetes Obes Metab. 1999;1:3–11. doi: 10.1046/j.1463-1326.1999.00006.x. [DOI] [PubMed] [Google Scholar]
- Bilderback TR, Lisanti MP, Dobrowsky RT. Caveolin interacts with Trk A, p75 NTR and regulates neurotrophin signaling pathways. J Biol Chem. 1999;274:257–263. doi: 10.1074/jbc.274.1.257. [DOI] [PubMed] [Google Scholar]
- Chen S, Velardez MO, Warot X, Yu Z-X, Miller SJ, Cros D, Corfas G. Neuregulin 1-erbB signaling is necessary for normal myelination and sensory function. J Neurosci. 2006;26:3079–3086. doi: 10.1523/JNEUROSCI.3785-05.2006. [DOI] [PMC free article] [PubMed] [Google Scholar]
- Christianson JA, Riekhof JT, Wright DE. Restorative effects of neurotrophin treatment on diabetes-induced cutaneous axon loss in mice. Exp Neurol. 2003;179:188–199. doi: 10.1016/s0014-4886(02)00017-1. [DOI] [PubMed] [Google Scholar]
- Dobrowsky RT. Sphingolipid signaling domains: Floating on rafts or buried in caves? Cell Signal. 2000;12:71–80. doi: 10.1016/s0898-6568(99)00072-8. [DOI] [PubMed] [Google Scholar]
- Dong Z, Brennan A, Liu N, Yarden Y, Lefkowitz G, Mirsky R, Jessen KR. Neu differentiation factor is a neuron-glia signal and regulates survival, proliferation, and maturation of rat Schwann cell precursors. Neuron. 1995;15:585–596. doi: 10.1016/0896-6273(95)90147-7. [DOI] [PubMed] [Google Scholar]
- Drel VR, Pacher P, Stevens MJ, Obrosova IG. Aldose reductase inhibition counteracts nitrosative stress and poly(ADP-ribose) polymerase activation in diabetic rat kidney and high-glucose-exposed human mesangial cells. Free Radic Biol Med. 2006;40:1454–1465. doi: 10.1016/j.freeradbiomed.2005.12.034. [DOI] [PMC free article] [PubMed] [Google Scholar]
- Eckersley L. Role of the Schwann cell in diabetic neuropathy. Int Rev Neurobiol. 2002;50:293–321. doi: 10.1016/s0074-7742(02)50081-7. [DOI] [PubMed] [Google Scholar]
- Einheber S, Milner TA, Giancotti F, Salzer JL. Axonal regulation of Schwann cell integrin expression suggests a role for α6β4 in myelination. J Cell Biol. 1993;123:1223–1236. doi: 10.1083/jcb.123.5.1223. [DOI] [PMC free article] [PubMed] [Google Scholar]
- Engelman JA, Lee RJ, Karnezis A, Bearss DJ, Webster M, Siegel P, Muller WJ, Windle JJ, Pestell RG, Lisanti MP. Reciprocal regulation of neu tyrosine kinase activity and caveolin-1 protein expression in vitro and in vivo. Implications for human breast cancer. J Biol Chem. 1998;273:20448–20455. doi: 10.1074/jbc.273.32.20448. [DOI] [PubMed] [Google Scholar]
- Esper RM, Pankonin MS, Loeb JA. Neuregulins: Versatile growth and differentiation factors in nervous system development and human disease. Brain Res Brain Res Rev. 2006;51:161–175. doi: 10.1016/j.brainresrev.2005.11.006. [DOI] [PubMed] [Google Scholar]
- Fernyhough P, Huang TJ, Verkhratsky A. Mechanism of mitochondrial dysfunction in diabetic sensory neuropathy. J Peripher Nerv Syst. 2003;8:227–235. doi: 10.1111/j.1085-9489.2003.03028.x. [DOI] [PubMed] [Google Scholar]
- Garratt AN, Voiculescu O, Topilko P, Charnay P, Birchmeier C. A dual role of erbB2 in myelination and in expansion of the Schwann cell precursor pool. J Cell Biol. 2000;148:1035–1046. doi: 10.1083/jcb.148.5.1035. [DOI] [PMC free article] [PubMed] [Google Scholar]
- Guertin AD, Zhang DP, Mak KS, Alberta JA, Kim HA. Microanatomy of axon/glial signaling during Wallerian degeneration. J Neurosci. 2005;25:3478–3487. doi: 10.1523/JNEUROSCI.3766-04.2005. [DOI] [PMC free article] [PubMed] [Google Scholar]
- Harrisingh MC, Perez-Nadales E, Parkinson DB, Malcolm DS, Mudge AW, Lloyd AC. The Ras/Raf/ERK signalling pathway drives Schwann cell dedifferentiation. EMBO J. 2004;23:3061–3071. doi: 10.1038/sj.emboj.7600309. [DOI] [PMC free article] [PubMed] [Google Scholar]
- Huang TJ, Price SA, Chilton L, Calcutt NA, Tomlinson DR, Verkhratsky A, Fernyhough P. Insulin prevents depolarization of the mitochondrial inner membrane in sensory neurons of type 1 diabetic rats in the presence of sustained hyperglycemia. Diabetes. 2003;52:2129–2136. doi: 10.2337/diabetes.52.8.2129. [DOI] [PubMed] [Google Scholar]
- Huijbregts RPH, Roth KA, Schmidt RE, Carroll SL. Hypertrophic neuropathies and malignant peripheral nerve sheath tumors in transgenic mice overexpressing glial growth factor b3 in myelinating Schwann cells. J Neurosci. 2003;23:7269–7280. doi: 10.1523/JNEUROSCI.23-19-07269.2003. [DOI] [PMC free article] [PubMed] [Google Scholar]
- Kennedy JM, Zochodne DW. Experimental diabetic neuropathy with spontaneous recovery: Is there irreparable damage? Diabetes. 2005;54:830–837. doi: 10.2337/diabetes.54.3.830. [DOI] [PubMed] [Google Scholar]
- Komers R, Schutzer WE, Reed JF, Lindsley JN, Oyama TT, Buck DC, Mader SL, Anderson S. Altered endothelial nitric oxide synthase targeting and conformation and caveolin-1 expression in the diabetic kidney. Diabetes. 2006;55:1651–1659. doi: 10.2337/db05-1595. [DOI] [PubMed] [Google Scholar]
- Lee H, Park DS, Razani B, Russell RG, Pestell RG, Lisanti MP. Caveolin-1 mutations (P132L and null) and the pathogenesis of breast cancer: Caveolin-1 (P132L) behaves in a dominant-negative manner and caveolin-1 (-/-) null mice show mammary epithelial cell hyperplasia. Am J Pathol. 2002;161:1357–1369. doi: 10.1016/S0002-9440(10)64412-4. [DOI] [PMC free article] [PubMed] [Google Scholar]
- Leinninger GM, Backus C, Uhler MD, Lentz SI, Feldman EL. Phosphatidylinositol 3-kinase and Akt effectors mediate insulin-like growth factor-I neuroprotection in dorsal root ganglia neurons. FASEB J. 2004a;18:1544–1546. doi: 10.1096/fj.04-1581fje. [DOI] [PubMed] [Google Scholar]
- Leinninger GM, Vincent AM, Feldman EL. The role of growth factors in diabetic peripheral neuropathy. J Periph Nerv Sys. 2004b;9:26–53. doi: 10.1111/j.1085-9489.2004.09105.x. [DOI] [PubMed] [Google Scholar]
- Li G, Faibushevich A, Turunen BJ, Yoon SO, Georg G, Michaelis ML, Dobrowsky RT. Stabilization of the cyclin-dependent kinase 5 activator, p35, by paclitaxel decreases á-amyloid toxicity in cortical neurons. J Neurochem. 2003;84:347–362. doi: 10.1046/j.1471-4159.2003.01526.x. [DOI] [PubMed] [Google Scholar]
- Maurel P, Salzer JL. Axonal regulation of Schwann cell proliferation and survival and the initial events of myelination requires PI 3-kinase activity. J Neurosci. 2000;20:4635–4645. doi: 10.1523/JNEUROSCI.20-12-04635.2000. [DOI] [PMC free article] [PubMed] [Google Scholar]
- Michailov GV, Sereda MW, Brinkmann BG, Fischer TM, Haug B, Birchmeier C, Role L, Lai C, Schwab MH, Nave KA. Axonal neuregulin-1 regulates myelin sheath thickness. Science. 2004;304:700–703. doi: 10.1126/science.1095862. [DOI] [PubMed] [Google Scholar]
- Mikol DD, Hong HL, Cheng HL, Feldman EL. Caveolin-1 expression in Schwann cells. Glia. 1999;27:39–52. [PubMed] [Google Scholar]
- Mikol DD, Scherer SS, Duckett SJ, Hong HL, Feldman EL. Schwann cell caveolin-1 expression increases during myelination and decreases after axotomy. Glia. 2002;38:191–199. doi: 10.1002/glia.10063. [DOI] [PubMed] [Google Scholar]
- Mizisin AP, Shelton DG, Wagner S, Rusbridge C, Powell HC. Myelin splitting, Schwann cell injury and demyelination in feline diabetic neuropathy. Acta Neuropathol (Berl) 1998;95:171–174. doi: 10.1007/s004010050783. [DOI] [PubMed] [Google Scholar]
- Morrissey TK, Levi AD, Nuijens A, Sliwkowski MX, Bunge RP. Axon-induced mitogenesis of human Schwann cells involves heregulin and p185erbB2. Proc Natl Acad Sci USA. 1995;92:1431–1435. doi: 10.1073/pnas.92.5.1431. [DOI] [PMC free article] [PubMed] [Google Scholar]
- Obrosova IG, Drel VR, Pacher P, Ilnytska O, Wang ZQ, Stevens MJ, Yorek MA. Oxidative-nitrosative stress and poly(ADP-ribose) polymerase (PARP) activation in experimental diabetic neuropathy: The relation is revisited. Diabetes. 2005;54:3435–3441. doi: 10.2337/diabetes.54.12.3435. [DOI] [PMC free article] [PubMed] [Google Scholar]
- Ogata T, Iijima S, Hoshikawa S, Miura T, Yamamoto S, Oda H, Nakamura K, Tanaka S. Opposing extracellular signal-regulated kinase and Akt pathways control Schwann cell myelination. J Neurosci. 2004;24:6724–6732. doi: 10.1523/JNEUROSCI.5520-03.2004. [DOI] [PMC free article] [PubMed] [Google Scholar]
- Pertusa M, Morenilla-Palao C, Carteron C, Viana F, Cabedo H. Transcriptional control of cholesterol biosynthesis in Schwann cells by axonal neuregulin 1. J Biol Chem. 2007;282:28768–28778. doi: 10.1074/jbc.M701878200. [DOI] [PubMed] [Google Scholar]
- Purves TD, Middlemas A, Agthong SI, Jude EB, Boulton AJM, Fernyhough P, Tomlinson DR. A role for mitogen-activated protein kinases in the etiology of diabetic neuropathy. FASEB J. 2001;15:2508–2514. doi: 10.1096/fj.01-0253hyp. [DOI] [PubMed] [Google Scholar]
- Said G. Diabetic neuropathy—A review. Nat Clin Pract Neurol. 2007;3:331–340. doi: 10.1038/ncpneuro0504. [DOI] [PubMed] [Google Scholar]
- Scherer SS, Arroyo EJ. Recent progress on the molecular organization of myelinated axons. J Periph Nerv Syst. 2002;7:1–12. doi: 10.1046/j.1529-8027.2002.02001.x. [DOI] [PubMed] [Google Scholar]
- Syroid DE, Maycox PR, Burrola PG, Liu N, Wen D, Lee KF, Lemke G, Kilpatrick TJ. Cell death in the Schwann cell lineage and its regulation by neuregulin. Proc Natl Acad Sci USA. 1996;93:9229–9234. doi: 10.1073/pnas.93.17.9229. [DOI] [PMC free article] [PubMed] [Google Scholar]
- Tan W, Rouen S, Barkus KM, Dremina YS, Hui D, Christianson JA, Wright DE, Yoon SO, Dobrowsky RT. Nerve growth factor blocks the glucose-induced down-regulation of caveolin-1 expression in Schwann cells via p75 neurotrophin receptor signaling. J Biol Chem. 2003;278:23151–23162. doi: 10.1074/jbc.M212986200. [DOI] [PubMed] [Google Scholar]
- Taveggia C, Zanazzi G, Petrylak A, Yano H, Rosenbluth J, Einheber S, Xu X, Esper RM, Loeb JA, Shrager P, Chao MV, Falls DL, Role L, Salzer JL. Neuregulin-1 type III determines the ensheathment fate of axons. Neuron. 2005;47:681–694. doi: 10.1016/j.neuron.2005.08.017. [DOI] [PMC free article] [PubMed] [Google Scholar]
- Tomlinson DR, Gardiner NJ. Glucose neurotoxicity. Nat Rev Neurosci. 2008;9:36–45. doi: 10.1038/nrn2294. [DOI] [PubMed] [Google Scholar]
- Toth C, Rong LL, Yang C, Martinez J, Song F, Ramji N, Brussee V, Liu W, Durand J, Nguyen MD, Schmidt AM, Zochodne DW. RAGE and experimental diabetic neuropathy. Diabetes. 2007 doi: 10.2337/db07-0339. in press. [DOI] [PubMed] [Google Scholar]
- Vincent AM, McLean LL, Backus C, Feldman EL. Short-term hyperglycemia produces oxidative damage and apoptosis in neurons. FASEB J. 2005;19:638–640. doi: 10.1096/fj.04-2513fje. [DOI] [PubMed] [Google Scholar]
- Zanazzi G, Einheber S, Westreich R, Hannocks MJ, Bedell-Hogan D, Marchionni MA, Salzer JL. Glial growth factor/neuregulin inhibits Schwann cell myelination and induces demyelination. J Cell Biol. 2001;152:1289–1299. doi: 10.1083/jcb.152.6.1289. [DOI] [PMC free article] [PubMed] [Google Scholar]