Abstract
People with autism are impaired in their social behavior, including their eye contact with others, but the processes that underlie this impairment remain elusive. We combined high-resolution eye tracking with computational modeling in a group of 10 high-functioning individuals with autism to address this issue. The group fixated the location of the mouth in facial expressions more than did matched controls, even when the mouth was not shown, even in faces that were inverted and most noticeably at latencies of 200–400 ms. Comparisons with a computational model of visual saliency argue that the abnormal bias for fixating the mouth in autism is not driven by an exaggerated sensitivity to the bottom-up saliency of the features, but rather by an abnormal top-down strategy for allocating visual attention.
Keywords: high-functioning autism, eye movements, saliency, attention
How do we normally look at other's faces, and what processes contribute to the abnormal social gaze seen in people with autism? Insights into this question depend on high-resolution measurements of face gaze as the primary source of data, but also require ways to dissociate the contributions that different processes make to our gaze. Models of visual attention incorporate two different sources for driving eye gaze: simple features such as high contrast or motion that influence eye movements in a bottom-up fashion and top-down signals that strategically explore the stimulus based on its meaning, learned associations and expectations. A good example of the former are the saccades viewers automatically make to unexpected visual motion in the periphery. A good example of the latter is the gaze pattern when we are looking for a distinct object in a familiar environment. To isolate the relative contributions made by bottom-up vs top-down attention, one can compare the viewer's fixations with computational models. One of the most widely used computational models of visual saliency provides a purely bottom-up model, as it is based solely on cues in the image, rather than any learned associations, explicit task strategy or knowledge of the meaning of the stimulus. The model can qualitatively predict human behavior in many visual search and pop-out experiments (Itti and Koch, 1998, 2001).
One of the diagnostic features of autism is impaired social communication (Hill and Frith, 2003; Kanner, 1943) (DSM-IV manual), an aspect that can be quantified in the abnormal eye contact that people with autism make with others. Yet the spatial and temporal characteristics of this impaired eye gaze have not been characterized in detail, and their psychological basis remains elusive. People with autism show a distinct gaze pattern when looking at faces. They spend more time at the mouth and often look less into the eyes (Pelphrey et al., 2002; Klin et al., 2002). Despite this impairment, high-functioning adults with autism can usually recognize people from their faces, and can identify basic emotional facial expressions (Adolphs et al., 2001). A normal face inversion effect and a whole-over-parts advantage suggest intact domain-specific processing of facial information (Joseph and Tanaka, 2002). However, people with autism are impaired on more complex tasks that require the understanding of social intentions and mental states based on the expression in the eyes (Baron-Cohen et al., 1997). Children with autism have deficits using eye gaze as a cue for visual attention, even though they can detect gaze direction normally (Baron-Cohen et al., 1999; Leekam et al., 1998).
The impairments in gaze behavior, together with the relatively intact ability to discriminate and recognize basic facial information, but not more complex social information, has led to several hypotheses. One possibility is that autistic people look less into the eyes because eye contact results in emotional distress (Kylliainen and Hietanen, 2006; Dalton et al., 2005). Another possibility is that they are abnormally attracted to the mouth because it offers salient features such as movement and voice emission. Yet a third possibility is that looking at the mouth is a compensatory strategy to extract social meaning from other parts of the face when the eyes are less informative to people with autism. It is difficult to distinguish between these hypotheses simply by comparing fixation patterns to whole faces, because such stimuli present all facial features for which attention could compete simultaneously. If looking at eyes is actively avoided, then the subjects will spend more time looking at other facial features. Similarly, if the mouth would be the most attractive feature, then there will be less time to look at the eyes.
To dissociate the above explanations we measured fixations to sparsely revealed faces in which only small portions of the face were shown (Gosselin and Schyns, 2001, 2002). We then analyzed how saccades to a particular facial feature were influenced by the local visual information available. To assay the contribution made by bottom-up visual attention (such as saccades to salient regions of high contrast that might be revealed) we used a computational model of bottom-up visual saliency. By analyzing luminance, contrast and other image statistics, the model computes how visually salient regions of an image are. By comparing the saliency values at the locations the subjects fixated, we estimated how bottom-up features influenced eye gaze. We then used the agreement between the bottom-up saliency model and the recorded gaze patterns to determine the relative contributions of bottom-up and top-down attentional processes.
METHOD
Participants
Ten high-functioning participants with autism were recruited through the Subject Registry of the UNC Neurodevelopmental Disorders Research Center. They met the DSM-IV/ICD-10, Autism Diagnostic Interview (ADI) and the Autism Diagnostic Observation Schedule (ADOS) diagnostic criteria and were compared with 10 healthy controls with no history of psychiatric or neurological disease and no family history of autism. The autism and control groups were matched on IQ (autism, 104 ± 5; controls, 106 ± 5; Wechsler Abbreviated Scale of Intelligence), age (23 ± 2, 28 ± 3, means and standard errors respectively), and all participants were male. The differences in age, verbal, performance or full-scale IQ were small and did not exceed our significance threshold (P > 0.1, Wilcoxon rank-sum test). All participants had normal or corrected-to-normal vision.
Apparatus and stimuli
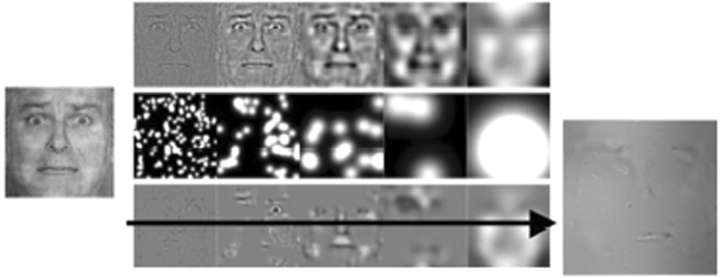
The stimuli and tasks followed one we have used previously (Adolphs et al., 2005). Facial expressions of emotion (Ekman and Friesen, 1976) were shown on a computer monitor and subjects were asked to push a button to classify the emotion. ‘Bubbles’ stimuli were obtained for four of the Ekman images (two fear, two happy; two male, two female). The images were sampled with Gaussian apertures at random locations and various spatial frequencies to generate sparsely revealed faces, as described in detail elsewhere (Gosselin and Schyns, 2001). Briefly, on each trial, one of the four base images was selected at random and decomposed into five levels of spatial frequency. At the highest spatial frequency level, fine details of the image such as local edges and outlines are revealed. Lower spatial frequency bands contain blurred versions of the images and thus more global information about the face. This search space was randomly sampled and filtered with Gaussian ‘bubbles’ whose centers were randomly distributed across image location and spatial frequency (Figure 1). This representation is similar to the one used in the early processing steps of the visual system. The images were presented on a compute monitor and subjects were asked to judge the emotion (happy or fearful) by pressing a button. The number of correct responses was held constant at about 80% by an automatic procedure that adjusts the number of revealed locations on a trial-by-trial basis. Eye movements were recorded with a head-mounted stereo camera system (EyeLink II, SR Research Ltd., Osgoode, ON, Canada) at 500 Hz. The equipment was calibrated at the beginning of each experiment and recalibrated every fifth trial to correct for linear drifts. The calibration error was typically smaller than 0.5° visual angle.
Fig. 1.
Construction of the ‘bubbles’ stimuli. An emotional facial expression (image at far left) with equal energy across all spatial frequencies (hence the somewhat grainy quality) was decomposed into five levels of spatial frequency (top row) that were randomly sampled (rows below) to generate a sparsely revealed face stimulus (image at far right).
Procedure
Subjects participated in two experiments: whole face classification and bubbled face classification. All 20 participants completed the bubbles conditions. Eleven subjects (seven with autism) participated in the whole face classification experiment.
Whole face classification
Forty six images of emotional facial expressions (happiness, surprise, fear, anger, disgust, sadness, and 10 neutral expressions; Ekman and Friesen, 1976) were shown in two blocks (in fixed order of the blocks and randomized presentation of faces): classifying the emotion in upright faces and when shown upside down. Subjects had to push a button to indicate which of the six emotion categories corresponded best to the face stimulus shown. Images were normalized for overall intensity. They were centrally displayed at an eye-to-screen distance of ∼79 cm subtending ∼11° horizontal visual angle, and were presented for 1 s.
Bubbled face classification
In a second session, 512 bubbles stimuli were shown that randomly revealed portions of the four base faces. Participants were asked to indicate whether the bubbled face they saw was afraid or happy by pressing a button. Stimuli were presented for as long as subjects took to push the button, up to a maximum of 10 s. All participants completed 512 trials. On every fifth trial, a circular annulus was centrally displayed and participants were given the opportunity to rest. When they decided to continue, they fixated the annulus and simultaneously pressed a key. This advanced the experiment to the next trial and allowed the system to correct for any drift in the eye gaze measurements. Participants were instructed to decide as quickly as possible and to always make a decision, even if it was a best guess.
Eye movement analysis
Eye movements were recorded with the head-mounted EyeLink II system. Eye position information was parsed online by the system into fixations, saccades and blink periods. The algorithm measures eye motion, velocity and acceleration and identifies saccades if either one of the measurements exceeds a threshold (motion: 0.10°, velocity: 30°/s, acceleration: 8000°/s2). The saccade ended when the velocity falls below 35°/s. Pupil size was continuously recorded and used by the system to detect blinks.
The periods of stable eye fixation were used to compute the fractional viewing time on a trial-by-trial basis. Facial regions of interest (nose, mouth, eye regions, other) were manually outlined for the whole faces, and for each of the four base faces used in the bubbles experiment. Custom software was used to compute the number of fixations, average viewing times, contrast and saliency values for fixations made to the different regions.
Each of the dependent measures was entered into a random effects analysis (linear mixed-effects model, Laird and Ware, 1982) with the between-subjects factors of group (autism, control), and the within-subjects measures of the target region (mouth, eye regions, etc.), and, if applicable, contrast and saliency information as random variables. When the main effects were significant, interaction terms with the autism diagnosis were added. Additionally, the trial number and the eye (left/right) were entered as potential covariates. Both variables were not significant and did not contribute to the model's prediction (according to the Akaiken information criterion). Parameters of interest (contrast, saliency) were modeled as random variables, i.e., on a subject-by-subject basis, to account for intersubject variance.
Since the sample size was relatively small, we performed a bootstrap analysis to estimate the bias caused by non-normality, and to obtain exact estimates of the confidence intervals. Throughout the paper, bias-corrected means and their bootstrap standard errors are reported.
Computational model
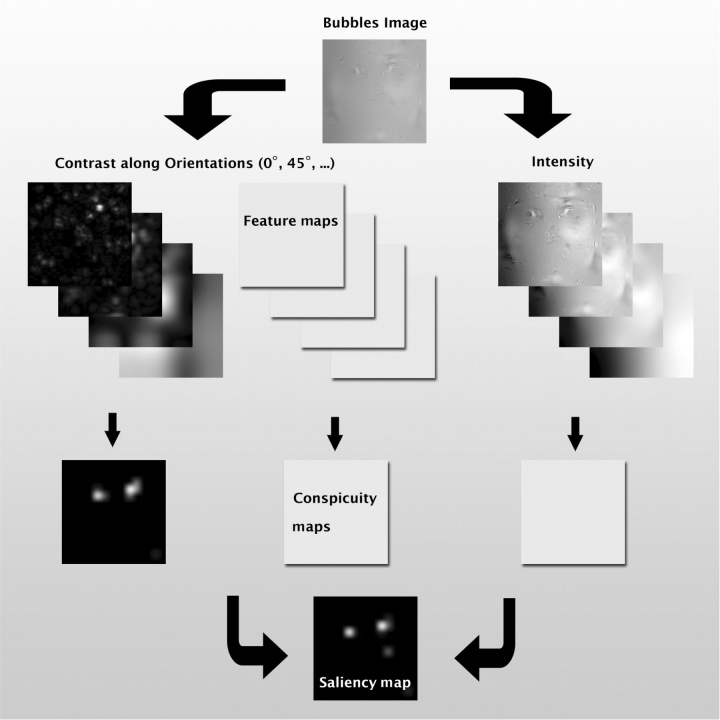
Regions that are visually interesting (visually salient) were determined by analyzing the same bubbles stimuli that the participants saw with a computational model of bottom-up attention (Itti and Koch, 2001). This model scored, for every pixel, how distinct that location on the image was along dimensions of luminance, contrast, orientation and spatial scale (Itti and Koch, 1998; Peters et al., 2005). The visual properties of the images are analyzed in analogy to the processing that is carried out by neurons in the early visual cortex. As a first step, the model calculates luminance and contrast maps (in the case of color images or videos, additional features such as color contrast and motion energy would be provided). The feature maps are computed for different orientations and spatial scales (Figure 2). This corresponds to the similar processing in retinal ganglion cells and in neurons in the primary visual cortex. In a second step, these luminance and contrast values are compared with the features in the local neighborhood around each pixel. An image location that is similar to its local surrounding is considered nonsalient, e.g. a white object in a bright background, and its activation is suppressed by subtracting the average local feature intensity (center–surround subtraction). The resulting conspicuity maps for the different features and scales are then linearly combined into the saliency map. This analysis results in a map showing image locations that stand out in terms of their low-level features from the background. By analyzing the activation peaks in the saliency maps, the model can predict eye movements and performance in many visual search and pop-out experiments.
Fig. 2.
Illustration of the saliency model. Images are filtered along multiple feature dimensions (luminance, and contrast in various directions). Center–surround differences at multiple spatial scales suppress responses from homogenous regions. The resulting conspicuity maps are then linearly combined into a common map that assigns every pixel of the image a saliency value.
For each fixation the participants made, the model provides a saliency value at the fixated location that depends on the value along the four aforementioned dimensions relative to those values in the surrounding pixels. Since the bubbles stimuli were unique on every trial, we obtained trial-unique saliency maps from the model. This allowed us correlate the model's prediction with the actual fixations to subjects made, and to estimate the contribution that bottom-up attention made to the gaze behavior.
To quantify the agreement between the saliency map and the subjects’ fixations, the saliency maps were normalized to have a mean of 0 and an s.d. of 1. The mean of saliency values at the fixated locations indicates how well the saliency maps predict eye gaze. Random fixations and random saliency maps will result in values close to zero. A good spatial agreement between the saliency maps and the fixations will result in positive, nonrandom values at the fixated locations. The sum of the saliency values at the fixated locations, or normalized scanpath saliency (NSS), summarizes the agreement and high values indicate a good prediction (Peters et al., 2005). Prior to computing the NSS values, a smoothing kernel (σ = 2.1° visual angle) was applied to the saliency maps to allow for small spatial incongruities and to obtain a scale-free version of the NSS.
Saliency-based eye movement predictions
The NSS values are a measure of the agreement of the fixation and saliency maps. To further quantify the agreement for different facial regions we used a statistical learning model (support vector machine) to predict eye movement from the saliency maps. For each subject, 200 trials (out of 512) were selected and set aside for validation. The remaining 312 trials and the corresponding saliency maps were given to the support vector machine to learn to predict, based on the saliency map, whether subjects made a saccade to either the mouth or the eyes within the first 1000 ms. To aid learning, the dimensionality of the saliency maps was reduced using principal component analysis (PCA) and the first three eigenvectors were entered into the analysis. This procedure was repeated 10 times for each subject.
For the test sets of 200 randomly selected trials, the receiver operating characteristic (ROC) was calculated and the area under the ROC curve was estimated. The ROC curve is a function describing the relationship between the hit rate (correctly predicted saccades) and the false-alarm rate (wrong predictions), and can be used to determine the optimal threshold for an algorithm (e.g. to keep the false alarm rate below a certain threshold). The area under the ROC curve is a nonparametric measure of predictability. If the predictions are random, then the hit rate will not exceed the false alarm rate, the ROC will be a diagonal line and the area under the curve will be 0.5. Values larger than 0.5 indicate predictions better than chance.
RESULTS
Whole faces
Autism subjects performed entirely normally in their ability to classify the emotion shown in whole faces (P > 0.1, t-tests, for every one of the emotions for accuracy). When we measured the fixations they made, we found the expected bias to look more at the mouth for inverted faces, but found an unexpected tendency to look at the eyes for upright faces (Figure 3 in main text, Table 1 in the Supplementary Online Information). This difference in fixation time in the upright condition is very small (24 and 43 ms for mouth and eyes, respectively) and indicate that upright whole faces, at least in our task, did not elicit abnormal eye fixations in subjects in this subject sample. However, this leaves open the possibility that abnormal fixations could be revealed using simpler stimuli, by a more demanding task, or in a different autism sample.
Fig. 3.
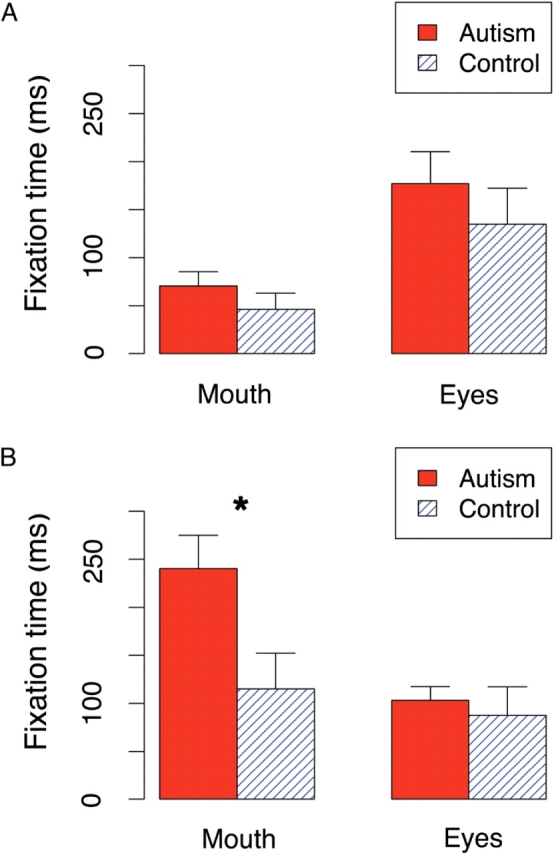
Time spent looking at mouth and eyes for the first second of stimulus presentation: (A) when the whole faces are shown upright, and (B) upside-down. Error bars indicate the bootstrap standard error. *P < 0.05.
Bubbled faces
To isolate the effects that individual features of faces might have on fixations, we next showed viewers randomly revealed small portions of faces, rather than full faces. First, as with the whole faces, subjects with autism performed completely normally when judging the emotions from the bubbled faces, both in terms of accuracy and reaction time (reaction time, 1.53 ± 0.64 s, 1.46 ± 0.53 s; accuracy, 82% ± 3%, 80% ± 5%; mean ± s.d.; autism and control group, respectively).
The accuracy of the subjects’ responses was kept constant around 80% by adjusting the number of bubbles on a trial-by-trial basis. The amount of face revealed in the two groups was equivalent across groups (bubbles, 62 ± 29, 52 ± 22; P > 0.1 for all comparisons, Wilcoxon rank-sum test).
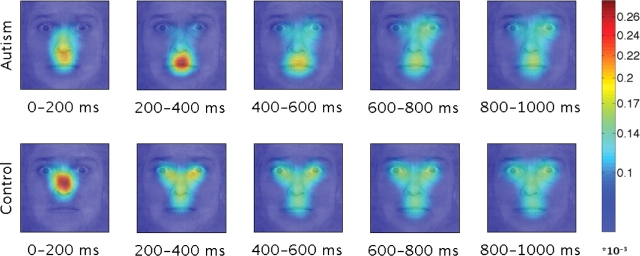
Although the autism group was normal in their ability to classify the emotion in the bubbled faces, we observed strong differences in gaze behavior. The autism group showed the expected bias to look at the mouth, whereas the control group spent more time looking at the eyes (Figure 4; Table 1 in the Supplementary Online Information). Controls fixated the eye region more than did people with autism (P < 0.0001, F = 364), and fixated the mouth region less (P < 0.0001, F = 641). Surprisingly, fixation times in the autism group for the bubbles stimuli resemble the upside-down whole face condition, whereas normals look at the bubbles stimuli and the upright whole faces in a similar way (Figures 3 and 4B).
Fig. 4.
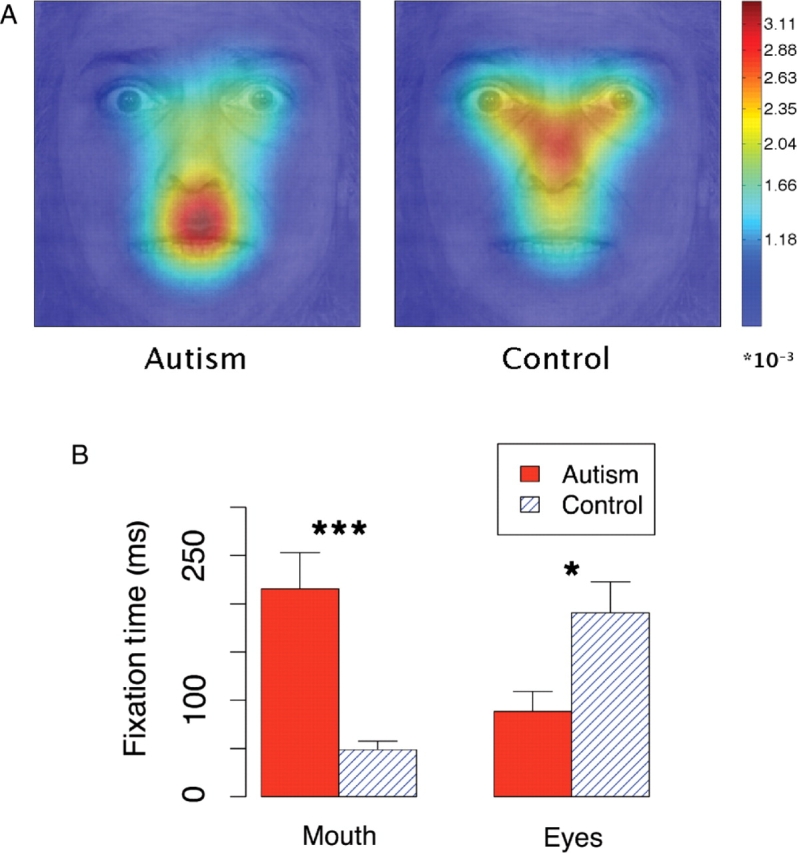
Fixations made during the first second of a bubbled face presentation. (A) Fixation density maps were calculated for fixations with an onset between 0 and 1000 ms for each individual using two-dimensional kernel-based smoothing (Venables and Ripley, 2002) and were subsequently averaged. (B) Average time spent viewing the mouth and the eyes. Error bars indicated bootstrap standard error. *P < 0.05, ***P < 0.001.
Fixation onsets
Next, we determined the points in time when the subjects looked at particular facial features. We divided the first second into 200 ms time bins and counted, for every pixel in the image, how often subjects made a saccade to that particular location. The resulting patterns of fixations showed clear differences between people with autism and the controls. The differences were most notable at specific, early latencies of 200–400 ms (Figure 5).
Fig. 5.
Fixation patterns for the bubbled faces. Density maps were calculated for fixations with onsets in five subsequent 200 ms time bins using kernel-based smoothing. The plot shows the average of the 10 individual maps for each group. *P < 0.05.
To compare the saccade onsets with the previous analyses of viewing time, we calculated the average fixation time for the mouth and the eyes region for consecutive 200 ms time bins. The autism group looked at the mouth very early on, for saccades with onsets between 0 and 200 ms after stimulus presentation, and preferred the mouth region most between 400 and 600 ms (Figure 6). We did not find this very early difference for fixations made to the eyes. The control subjects diverged from the autism group for saccades towards the eyes after 200–400 ms, presumably, when information from the image can be used for the saccade programming.
Fig. 6.
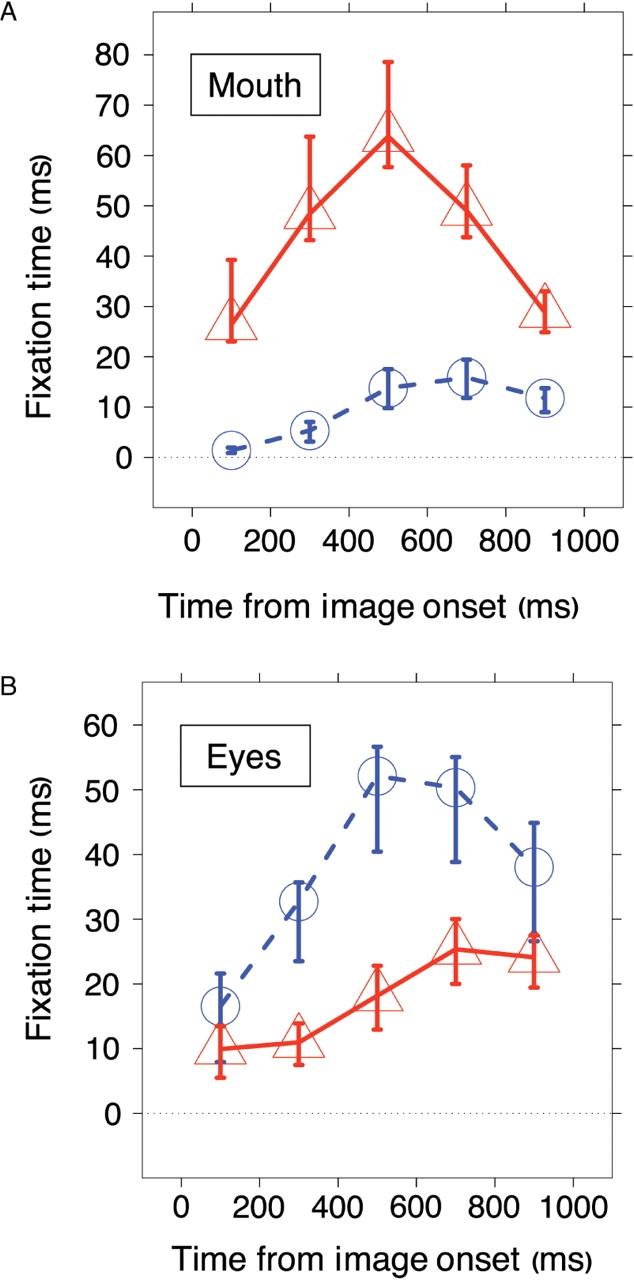
Fixation times for (A) the mouth and (B) the eyes. Viewing times of the autism group is shown in red, and of the control group in blue. Error bars indicate the bootstrap standard error.
Contrast sensitivity
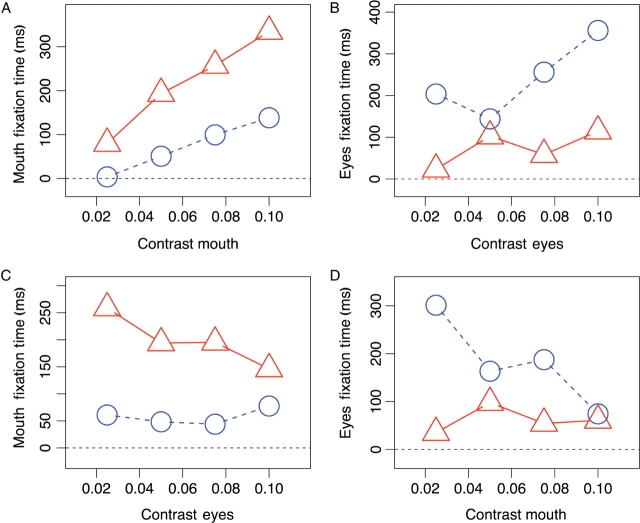
Saccadic onsets and directions are very sensitive to changes in visual saliency, and particularly to the image contrast. We hence wanted to know to what extent eye movements are influenced by the contrast of the facial features. To assess the influence of contrast changes on the viewing time, we calculated the contrast and the fractional viewing time for the mouth and eye regions during the first second of every trial. Contrast was defined as the s.d. of pixel intensities in a particular region normalized by its mean intensity. We first looked at the mouth. Both groups were sensitive to contrast in the mouth region and looked more at it when the contrast was higher (Figure 7A; P < 0.0001, F = 29.6, random effect model). However, although they differ in their overall viewing time (P < 0.001, F = 19.9), the groups show similar contrast sensitivity (P = 0.52, F = 0.41, Supplementary Table 2).
Fig. 7.
Influence of contrast on the time spent viewing the facial feature. (A) Influence of mouth contrast on mouth fixations. (B) Influence of the eye contrast on the time the subject looked at the eyes. C+D) Interaction between eyes and mouth, showing the influence of the eye contrast on mouth fixations (C) and of the contrast in the mouth region on the time spent looking the eyes (D). Contrast was defined as the standard deviation of pixel intensities in a particular region normalized by the mean intensity. The data of the autism group is plotted in red, and of the control group in blue.
When we analyzed the fixations made to the eyes, we found a strong contrast sensitivity for the control group (P < 0.0001, F = 191), and a smaller but significant slope for the autism group (P < 0.01, F = 7.26; Figure 7B).
To study how the two facial features compete for attention, we analyzed how contrast in one region influences the fixations made to the other. When controls made saccades to the eyes, they were distracted when parts of the mouth were revealed (P < 0.01, F = 10.6; Figure 7D). The autism group, in contrast, spent very little time looking at the eyes and the viewing time was not influenced by the mouth contrast (P = 0.30, F = 1.07).
When the autism group looked at the mouth, they were distracted when information in the eyes was shown (P < 0.0001, F = 22.4; Figure 7C). However, the slope did not differ from controls (P = 0.59, F = 0.29).
Bottom-up influence
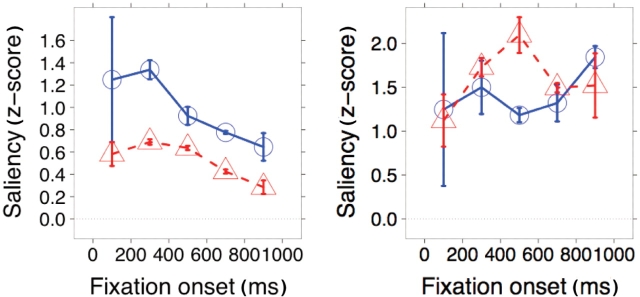
Given the stimuli we used, these findings raise a further question: are the fixations driven bottom-up by the saliency of the features revealed by the bubbles, or due to a top-down bias? We addressed this question by computing, for each trial image, a saliency map from the computational model. Overall, the saliency given by the model showed a highly significant association with the actual fixations that the controls made (P < 0.01, t = 35), compared with a random sampling of the saliency maps (Z-score controls, 1.08, random, 0.0047). The association between the predicted locations and the fixations made by people with autism was significantly lower (P < 0.01, t = 136, Z-score autism, 0.83).
The lower agreement between the saliency model and the fixations made by the autism group appear to arise from an exaggerated top-down bias in the autism group to fixate the mouth. We calculated the predictability of fixations to facial features by training a support vector machine on the optimal relationship between the saliency model and the actual fixations that viewers made (see ‘Methods’ section). Whereas the predictability of fixations to the eye region of faces was equivalent (and low) for both the autism and control groups (autism, 0.515; control, 0.527; P > 0.20), the model was significantly better at predicting fixations to the mouth for controls than for people with autism (autism, 0.553; control, 0.621, P < 0.001, t(17.2) = 3.49).
Comparing the saliency of the mouth and the eye regions when viewers fixated there revealed that people with autism fixate the eyes when saliency cues are present there, but fixate the mouth even when no saliency cues are present there (Figure 8). This suggests that people with autism share a normal, bottom-up attentional process to look at the eyes, but have an abnormal top-down bias for fixating the mouth.
Fig. 8.
Saliency values for fixations made to the mouth (left) or eyes region of faces (right). The agreement with the saliency model is lower for people with autism (red) than for controls (blue) in the case of the mouth, but similar or even a little higher in the case of the eyes. Error bars indicate the bootstrap standard error.
DISCUSSION
We asked high-functioning subjects with autism to identify emotional facial expressions, a task people with autism often perform normally. In line with previous findings, we also observed normal accuracy and normal face gaze, provided that whole upright faces were used as the stimuli. When the difficulty of the task was increased and only sparse regions of a face were revealed using the bubbles technique, we still observed normal performance levels in the autism group. However, their gaze onto these sparse facial features became dramatically abnormal. People with autism looked much more often and longer (autism, 27.3%; control, 8.7% of all saccades; autism, 216 ms; control, 48 ms) at the mouth.
When they fixated the mouth, we did not observe any abnormality in how viewing time is influenced by contrast changes. Despite their overall bias, higher contrast in the mouth region and lower contrast in the eye region increases the viewing time as it did for normals. The autism group rarely looked at the eyes in the bubbles condition, and they did not look at them more frequently when the mouth was not revealed, or shown with low contrast.
We then studied to what extent the eye movements to those target regions are influenced by bottom-up saliency information and compared the fixations made by the subjects with the predictions from a computational model. For the mouth region we found a strong reduction in predictability for the autism group, while the use of saliency information in the eyes, despite differences in the gaze behavior, are remarkably similar in both groups.
Returning to our initial hypotheses, it is unlikely that the autism group is attracted by the mouth because of its salient features. The normal influence of contrast changes on mouth viewing, as well as the absence of the bias in the full contrast condition, speaks against this possibility. The low correlation between the low-level visual information for saccades made to the mouth instead suggests an impaired top-down modulation of attention in the autism group.
Our results are consistent with earlier findings that autism subjects are impaired when judging complex social information from the eyes, but not from the mouth (Baron-Cohen, 1995), and that they rely more on information from the mouth for emotional judgments (Spezio et al., 2006). The differences in attentional processing suggest a possible general mechanism for the neurodevelopmental progression of impaired face gaze in autism (Dawson et al., 2005). We failed to observe a deficit in using low-level visual saliency cues, or bottom-up attention, while we found differences in top-down modulation for saccades made to the mouth. We propose that this evidence is consistent with a neurodevelopmental progression that begins in infancy with a failure in directing attention to the faces and more specifically to the eyes in a face, along with preservation of bottom-up attentional processing. This is consistent with the major deficits in social engagement rather than in nonsocial areas when autism is evident in early infancy (Kanner, 1943). Reported signs of lower social engagement in infants with autism include less interest in people (Volkmar et al., 2005) and less looking at faces (Osterling et al., 2002). The abnormal top-down attentional processing of faces may be due to abnormal reward circuitry (Dawson et al., 2005) or to abnormal circuitry for emotional salience (Schultz, 2005). Over the course of development, via learning, top-down attention may cause the propensity for mouth gaze in autism. This hypothesized mechanism adds to previous hypotheses about the causes of deficits in top-down attention to the face, and draws on our findings that bottom-up attention to the face is normal in high-functioning people with autism.
Another possibility is that the bubbles stimuli reveal an impairment in how attention is directed to local vs global features. In contrast to earlier reports, we observed a normal eye gaze to whole faces. This could also be due to a social training program most of our autism subjects participated in. Despite their overall normal gaze to whole faces, the sparse bubbles stimuli might reveal an underlying impairment in deploying attention to local (vs global) features (Dakin and Frith, 2005).
The similar influence of contrast and other visual saliency information on eye movements in both groups suggests that the subcortical and cortical brain networks for bottom-up attention might be unimpaired in the autism group. Subcortically, the superior colliculus and the pulvinar are involved in the deployment of overt and covert spatial attention. The computation of the conspicuity maps is attributed to areas in the visual cortex (Lee et al., 2002; Treue, 2003). In contrast to bottom-up tasks, top-down attentional tasks activate parietal and frontal areas. The frontal areas, such as the frontal eye fields and in the parietal eye field (lateral intraparietal area in macaques), encode attention, but not the actual eye movements (Bisley and Goldberg, 2003). Studies of patients with lesions to the temporoparietal junction and ventral frontal cortices suggest an involvement in the detection of visually salient events. Unilateral lesions in these brain areas result in a contralateral spatial neglect, and activity in the temporoparietal junction correlates with the recovery from spatial neglect after damage to the ventral frontal cortex (Corbetta, 2005). In autism subjects, the cerebral cortex has been reported to be thinner in areas involved in attention and social cognition (inferior frontal cortex, inferior parietal lobe, the superior temporal gyrus; Hadjikani et al., 2006). When looking at faces, activity in the superior temporal gyrus fails to be enhanced for eye gaze that is directed towards a target vs gaze into the void (Pelphrey et al., 2005).
Our results are consistent with an impairment in top-down modulation of attention for faces, along with preservation of bottom-up attentional processing. Future development of behavioral interventions in autism may benefit from using low-level visual cues, in addition to top-down instructions, to train eye gaze.
Acknowledgments
This research was supported by grants from the NIMH, the Cure Autism Now Foundation, and Autism Speaks. The authors would like to thank the participants and their families for making this study possible, Dr Frédéric Gosselin for helpful advice on the using the ‘Bubbles’ method, and Robert Hurley for support in conducting the experiment.
Footnotes
Conflict of Interest
None declared.
REFERENCES
- Adolphs R, Gosselin F, Buchanan TW, Tranel D, Schyns P, Damasio AR. A mechanism for impaired fear recognition after amygdala damage. Nature. 2005;433:68–72. doi: 10.1038/nature03086. [DOI] [PubMed] [Google Scholar]
- Adolphs R, Sears L, Piven J. Abnormal processing of social information from faces in autism. Journal of Cognitive Neuroscience. 2001;13:232–40. doi: 10.1162/089892901564289. [DOI] [PubMed] [Google Scholar]
- Baron-Cohen S. Cambridge, MA: MIT Press; 1995. Mindblindness: An essay on autism and theory of mind. [Google Scholar]
- Baron-Cohen S, Campbell R, Karmiloff-Smith A, Grant J, Walker J. Are children with autism blind to the mentalistic significance of the eyes. British Journal of Developmental Psychology. 1995;13:379–98. [Google Scholar]
- Baron-Cohen S, Wheelwright S, Jolliffe T. Is there a “language of the eyes”? Evidence from normal adults, and adults with autism or Asperger syndrome. Visual Cognition. 1997;4:311–331. [Google Scholar]
- Bisley JW, Goldberg ME. Neuronal activity in the lateral intraparietal area and spatial attention. Science. 2003;299:81–6. doi: 10.1126/science.1077395. [DOI] [PubMed] [Google Scholar]
- Corbetta M, Kincade MJ, Lewis C, Snyder AZ, Sapir A. Neural basis and recovery of spatial attention deficits in spatial neglect. Nature Neuroscience. 2005;8:1603–10. doi: 10.1038/nn1574. [DOI] [PubMed] [Google Scholar]
- Dakin S, Frith U. Vagaries of visual perception in autism. Neuron. 2005;48:497–507. doi: 10.1016/j.neuron.2005.10.018. [DOI] [PubMed] [Google Scholar]
- Dalton KM, Nacewicz BM, Johnstone T, et al. Gaze fixation and the neural circuitry of face processing in autism. Nature Neuroscience. 2005;8:519–26. doi: 10.1038/nn1421. [DOI] [PMC free article] [PubMed] [Google Scholar]
- Dawson G, Webb SJ, McPartland J. Understanding the nature of face processing impairment in autism: Insights from behavioral and electrophysiological studies. Developmental Neuropsychology. 2005;27:403–24. doi: 10.1207/s15326942dn2703_6. [DOI] [PubMed] [Google Scholar]
- Gosselin F, Schyns PG. Bubbles: A technique to reveal the use of information in recognition tasks. Vision Research. 2001;41:2261–71. doi: 10.1016/s0042-6989(01)00097-9. [DOI] [PubMed] [Google Scholar]
- Gosselin F, Schyns PG. RAP: A new framework for visual categorization. Trends in Cognitive Science. 2002;6:70–7. doi: 10.1016/s1364-6613(00)01838-6. [DOI] [PubMed] [Google Scholar]
- Hadjikhani N, Joseph RM, Snyder J, Tager-Flusberg H. Anatomical differences in the mirror neuron system and social cognition network in autism. Cerebral Cortex. 2006;16:1276–82. doi: 10.1093/cercor/bhj069. [DOI] [PubMed] [Google Scholar]
- Hill EL, Frith U. Understanding autism: Insights from mind and brain. (Series B – Biological Sciences).Philosophical Transactions of the Royal Society of London. 2003;358:281–89. doi: 10.1098/rstb.2002.1209. [DOI] [PMC free article] [PubMed] [Google Scholar]
- Itti L, Koch C. Computational modelling of visual attention. Nature Reviews Neuroscience. 2001;2:194–203. doi: 10.1038/35058500. [DOI] [PubMed] [Google Scholar]
- Itti L, Koch C, Niebur E. A model of saliency-based visual attention for rapid scene analysis. IEEE Transactions on Pattern Analysis and Machine Intelligence. 1998;20:1254–9. [Google Scholar]
- Joseph RM, Tanaka J. Holistic and part-based face recognition in children with autism. Journal of Child Psychology and Psychiatry and Allied Disciplines. 2003;44:529–42. doi: 10.1111/1469-7610.00142. [DOI] [PubMed] [Google Scholar]
- Kanner L. Autistic disturbances of affective contact. Nervous Child. 1943:217–50. [PubMed] [Google Scholar]
- Klin A, Jones W, Schultz R, Volkmar F, Cohen D. Visual fixation patterns during viewing of naturalistic social situations as predictors of social competence in individuals with autism. Archives of General Psychiatry. 2002;59:809–16. doi: 10.1001/archpsyc.59.9.809. [DOI] [PubMed] [Google Scholar]
- Kylliainen A, Hietanen JK. Skin conductance responses to another person's gaze in children with autism. Journal of Autism and Developmental Disorders. 2006;36:517–25. doi: 10.1007/s10803-006-0091-4. [DOI] [PubMed] [Google Scholar]
- Laird NM, Ware JH. Random-effects models for longitudinal data. Biometrics. 1982;38:963–74. [PubMed] [Google Scholar]
- Lee TS, Yang CF, Romero RD, Mumford D. Neural activity in early visual cortex reflects behavioral experience and higher-order perceptual saliency. Nature Neuroscience. 2002;5:589–97. doi: 10.1038/nn0602-860. [DOI] [PubMed] [Google Scholar]
- Leekam SR, Hunnisett E, Moore C. Targets and cues: Gaze-following in children with autism. Journal of Child Psychology and Psychiatry and Allied Disciplines. 1998;39:951–62. [PubMed] [Google Scholar]
- Osterling JA, Dawson G, Munson JA. Early recognition of 1-year-old-infants with autism spectrum disorder versus mental retardation. Development and Psychopathology. 2002;14:239–51. doi: 10.1017/s0954579402002031. [DOI] [PubMed] [Google Scholar]
- Pelphrey KA, Morris JP, McCarthy G. Neural basis of eye gaze processing deficits in autism. Brain. 2005;128:1038–48. doi: 10.1093/brain/awh404. [DOI] [PubMed] [Google Scholar]
- Pelphrey KA, Sasson NJ, Reznick JS, Paul G, Goldman BD, Piven J. Visual scanning of faces in autism. Journal of Autism and Developmental Disorders. 2002;32:249–61. doi: 10.1023/a:1016374617369. [DOI] [PubMed] [Google Scholar]
- Peters RJ, Iyer A, Itti L, Koch C. Components of bottom-up gaze allocation in natural images. Vision Research. 2005;45:2397–416. doi: 10.1016/j.visres.2005.03.019. [DOI] [PubMed] [Google Scholar]
- Schultz RT. Developmental deficits in social perception in autism: The role of the amygdala and fusiform area. International Journal of Developmental Neuroscience. 2005;23:125–41. doi: 10.1016/j.ijdevneu.2004.12.012. [DOI] [PubMed] [Google Scholar]
- Spezio ML, Adolphs R, Hurley RSE, Piven J. Abnormal use of facial information in high-functioning autism. Journal of Autism and Developmental Disorders. 2006 doi: 10.1007/s10803-006-0232-9. (Epub ahead of print; doi:10.1007/s10803-006-0232-9) [DOI] [PubMed] [Google Scholar]
- Treue S. Visual attention: the where, what, how and why of saliency. Current Opinion in Neurobiology. 2003;13:428–32. doi: 10.1016/s0959-4388(03)00105-3. [DOI] [PubMed] [Google Scholar]
- Venables WN, Ripley BD. New York: Springer; 2002. Modern applied statistics with S. [Google Scholar]
- Volkmar F, Chawarska K, Klin A. Autism in infancy and early childhood. Annual Review of Psychology. 2005;56:315–336. doi: 10.1146/annurev.psych.56.091103.070159. [DOI] [PubMed] [Google Scholar]


