

Abstract
Faces are represented in a more configural or holistic manner than other objects. Substantial evidence indicates that this representation results from face-specific mechanisms, but some have argued that it is produced by configural mechanisms that can be applied to many objects including words. The face-specific hypothesis predicts that non-face configural processes will often be normal in prosopagnosic subjects, whereas the domain-general configural hypothesis predicts they will be deficient on all configural tasks. Although the weight of the evidence favors the face-specific hypothesis, a recent study reopened this issue when it was found that three out of five developmental prosopagnosics showed a larger local processing bias than controls in a global-local task (i.e. a Navon task). To examine this issue more thoroughly we tested a significantly larger sample of prosopagnosics (14 participants) who had severe face memory and face perception deficits. In contrast to the previous report, the developmental prosopagnosics performed normally in the global–local task. Like controls, they showed a typical global advantage and typical global-to-local consistency effects. The results demonstrate that the configural processing required by the Navon task is dissociable from face configural processing.
Keywords: face recognition, face perception, object recognition, agnosia
INTRODUCTION
A wide variety of evidence indicates that upright faces are represented in a qualitatively different manner than other object classes including inverted faces (Moscovitch et al., 1997; Farah et al., 1998; Kanwisher, 2000; McKone et al., 2001; Tsao et al., 2006). In particular, it often has been suggested that upright face perception is especially dependent on configural or holistic processing (Yin, 1969; Diamond and Carey, 1986; Young et al., 1987). The large inversion effects seen with faces have often been considered evidence for configural/holistic processing (configural: Yin, 1969; holistic: Yovel and Kanwisher, 2004; Yovel and Duchaine, 2006), and more direct demonstrations include composite effects (Young et al., 1987), part-whole effects (Tanaka and Farah, 1993; Tanaka and Sengco, 1997) and relational alteration effects (Leder and Bruce, 1998; Freire et al., 2000; Le Grand et al., 2001).
Although there is consensus that faces are represented more configurally or holistically than objects, the nature of the mechanisms producing this representation are debated. The face-specific hypothesis claims that face configural processing is produced by mechanisms specialized for upright faces (Farah et al., 1995; Moscovitch et al., 1997; Duchaine et al., 2006; Yovel and Duchaine, 2006). According to this hypothesis, these mechanisms are activated only by upright faces and they represent facial information in a manner that better encodes configural information in faces than other recognition mechanisms. According to some proposals, these face-specific mechanisms represent the facial configuration but not the parts (Leder and Bruce, 1998; Freire et al., 2000); in other proposals, face-specific mechanisms represent the face holistically and include both configural information and part information (Tanaka and Farah, 1993; Biederman and Kalocsai, 1997; Yovel and Duchaine, 2006; Yovel and Kanwisher, 2006). The specialized nature of the mechanisms carrying out face processing is supported by the failure to find any non-face object classes that show the behavioral effects mentioned in the previous paragraph (large inversion effects, composite effects, etc.). Face-specific mechanisms are also consistent with findings showing that forcing subjects to process configural information in non-face objects does not lead to a behavioral face-inversion effect or greater activation in face-selective areas (Yovel and Kanwisher, 2004), and recent single-unit recording in monkeys has shown that face-selective areas defined by fMRI consist entirely of face-selective neurons (Tsao et al., 2006). As predicted by a face-specific account, neuropsychological studies in humans have shown a double dissociation between face and object processing (Sergent and Signoret, 1992; McNeill and Warrington, 1993; Moscovitch et al., 1997; Duchaine et al., 2006). Furthermore, individuals with developmental prosopagnosia (DP) are impaired when required to discriminate changes in face configural information, yet nearly all performed normally with a comparable configural discrimination task with houses (Duchaine et al., 2006; Yovel and Duchaine, 2006).
In contrast, domain-general configural hypotheses propose that configural information in upright faces is represented by mechanisms used to process configural information for a variety of visual stimuli, not just faces. If face configural processing depends on general purpose configural mechanisms, individuals with face configural processing impairments should have impairments with configural processing tasks involving non-face stimuli. Clear support for this hypothesis is lacking, but new claims for it come from a recent report using a global–local task with five DPs (Behrmann et al., 2005). Subjects were presented with typical Navon stimuli (Navon, 1977) consisting of a global letter formed by the configuration of local letters (e.g. a global S made of small Hs) (Figure 1). The global and the local letters were either consistent (e.g. global S, local Ss) or inconsistent (e.g. global H, local Ss) and subjects responded to either the global letter or the local letter in a block of trials. Controls, unlike most subjects in global–local tasks (Navon, 2003), showed a non-significant response time advantage for local discriminations (11 ms), and as the domain-general configural hypothesis predicts, the local bias was greater in the DP group (85 ms). In addition, local information in global discriminations had a greater effect on DPs than controls.
Fig. 1.

Examples of compound stimuli used in the global–local task in Behrmann et al. (2005) and the current paper.
Although some aspects of Behrmann et al.'s results (2005) are consistent with the domain-general configural hypothesis, they do not provide strong support for it. Accuracy was equivalent in the two groups. The mean local advantage was larger for the DP group than controls, but two of the five DPs appear to show local superiority in the control range. Similarly, three DPs were affected by local information in global discriminations as much as many controls. Finally, the domain-general configural hypothesis also predicts that prosopagnosics’ local bias will cause them to be less affected by global information than controls yet this was not the case.
There is an additional reason to pause before accepting Behrmann et al.'s domain-general configural explanation for developmental prosopagnosia. This concerns the spatial frequencies required to do the global Navon task in relation to those required for face recognition. It is well recognized that the spatial frequency content required to do each task are very different. Spatial frequency masking experiments (Shulman et al., 1986; Shulman and Wilson, 1987) and those using spatial frequency filtered stimuli (Badcock et al., 1990; LeGasse, 1993) show that the global Navon task relies on low spatial frequencies. On the other hand, similar masking and filtering experiments show that the critical spatial frequencies for face identification are bandpass, requiring much higher spatial frequencies (Hayes et al., 1986; Nasanen, 1999). Thus Behrmann et al.'s claim implies that losses at low spatial frequencies are responsible for developmental prosopagnosia yet studies in normal observers show that these low frequencies are of lesser importance for face recognition.
Thus for several reasons, it is necessary to re-examine whether DPs show a local bias in global–local tasks. Towards this end, we have carried out our experiments in a manner that allow us to test the predictions of the domain-general configural hypothesis more thoroughly. First and most significantly, we tested a much larger sample of prosopagnosic subjects than the original Behrmann et al. (2005) study. In addition, we took great care to ensure that the face capacities of the prosopagnosic subjects were exhaustively documented. We also made sure that the typical global precedence results of the Navon task were replicated in our controls, something that was not achieved in the Behrmann et al. (2005) study.
As such we tested 14 DPs with tests of face memory, face perception and a global–local task. We present face memory results to document the face recognition impairments of the DPs. However, because the domain-general configural hypothesis refers to perceptual mechanisms, evidence from prosopagnosia is relevant only if participants have deficits with face perception. We use two face perception tests to demonstrate that the DPs have deficits with face perception. We then examine their global and local processing using a Navon task (Navon, 1977).
METHODS AND RESULTS
Prosopagnosic subjects
We tested 14 individuals who contacted the web site of the Center for Prosopagnosia Research at Harvard University/University College London (http://www.faceblind.org), because they experienced significant face recognition problems in everyday life. All were unaware of any events that may have caused brain damage and all reported lifelong problems with face recognition.
Their average age was 41.9 (s.d. = 12.7), ranging from 18 to 62. Appendix A lists each participant's nationality and occupation. All subjects were tested in person.
Each participant was tested with a battery of tests assessing face processing and low-level vision. All performed normally on the Birmingham Object Recognition Battery (Humphreys and Riddoch, 1993) and had normal or corrected-to-normal vision. Contrast sensitivity was tested with either the Pelli–Robson test (Pelli et al., 1988) or the contrast sensitivity test from Test Chart 2000 (Thomson Software Solutions, Hatfield, UK). DP participants are designated by either an M or an F for their sex and a number for their age. Only M56 has appeared in another paper (Yovel and Duchaine, 2006).
Face memory tests
Famous faces
Two different famous face tests were used: a version for US and Canadian participants (Yovel and Duchaine, 2006) and a version for UK participants. In both versions, 60 images were cropped so that little hair or clothing was visible. Faces in the US/Canadian version were presented for 5 s each and those in the UK version were presented for 3 s each. Participants were asked to name the face presented or provide uniquely identifying information (e.g. movie roles or political positions).
Because of the range of ages and backgrounds of the DP participants, we used three different control groups tailored to the age and nationality of each subject. The 19 US/Canadian controls were between 35 and 45 years of age (average age = 40.9 years), and they averaged 52.5/60 (s.d. = 6.6) correct identifications. Sixteen university age controls in the UK (average age = 20.1 years) were compared to F18 and they averaged 53.4/60 (s.d. = 5.4). Sixteen middle-aged UK adults (average age = 44.1 years) were compared to the older UK prosopagnosics, and their average score was 47.3/60 (s.d. = 6.2).
Figure 2 shows the z scores for the DPs on the famous face tests. The DPs averaged 23.5 (s.d. = 14.7). All DPs scored poorly with famous faces except M45, but because he scored so poorly on all other face recognition tests, we included him in the DP sample (Appendix A). After the test, participants were quizzed on their familiarity with the celebrities they failed to recognize and all were familiar with the nearly all of them. z scores for each DP on this test as well as the face tests that follow are provided in Appendix A.
Fig. 2.

Face memory z scores for DPs. The z scores on a famous face test and Cambridge Face Memory Test for each DP are displayed. The dashed line shows two standard deviations below the control mean, a typical cut-off in neuropsychology. All DPs except M45 were clearly impaired. However, his poor scores on the CFMT and the two face perception tests presented make it clear that he has face-recognition impairments.
Cambridge memory test for faces (Duchaine and Nakayama, 2006)
Because exposure to famous faces varied among the participants, we next examine their face memory with a test using unfamiliar faces so that exposure is identical. In this test, participants must recognize images of six target faces. Each target face was introduced by presenting participants with three different study views (left 3/4 profile, frontal, right 3/4 profile) for 3 s each. Immediately after presentation of the study images for a particular target face, participants were presented with three forced choice items, which consisted of one of the study images paired with two other faces in the same pose. This study and test cycle was repeated for all six target faces. Thus, the introduction consisted of 18 items (6 faces × 3 test items per face). After this introductory phase, participants were tested with 54 forced choice items consisting of novel views of one of the target faces along with two non-target faces. Noise was added to the final 24 items presenting novel views to make them more difficult.
Figure 2 displays z scores for DPs on the Cambridge Face Memory Test. Twenty age-matched controls (average age = 45.1 years) averaged 59.6 correct (s.d. = 7.6) out of 72 items, which is very close to a previously published college-aged average (Duchaine and Nakayama, 2006). The DP group averaged 35.9 (s.d. = 5.3) and their scores were significantly worse than the scores of the age-matched controls [t(32) = 10.0, p < 0.001]. As Figure 2 shows, each DP was more than two standard deviations below the control mean.
Face perception tests
Having demonstrated that the self-reported DP subjects do, in fact, suffer from face memory impairments, we next show that they are also impaired with face perception.
Cambridge face perception test
On each trial, participants were presented with a 3/4 profile view of a target face above frontal views of six men's faces (Figure 3A). Participants had 1 min to sort the faces based on their similarity to the target face. Each frontal view was an image from a morph continuum between a frontal view of the target face and a frontal view of another face. The six test faces for each trial were pulled from six different morph continua. Two steps were taken to systematically vary the similarity of the faces to be sorted. Pilot subjects ranked the similarity of the six different faces that were morphed with the target face to determine the proportion of the target face in each test image. One test face was created by morphing the target face with the face rated most similar to the target and it contained 88% of the target face. The other test faces contained 76, 64, 52, 40 and 28% of the target face morphed with the other faces in the order of the similarity rankings. Eight different trials were created, and each was presented upright once and inverted once. Upright and inverted trials were intermixed, with the upright trial occurring first half the time. One upright practice trial and one inverted practice trial were presented at the start of the test. Participants sorted the faces by clicking on a face and then indicating where that face should be moved by clicking in the area between two cards. The chosen face was then moved by the program to the desired location.
Fig. 3.
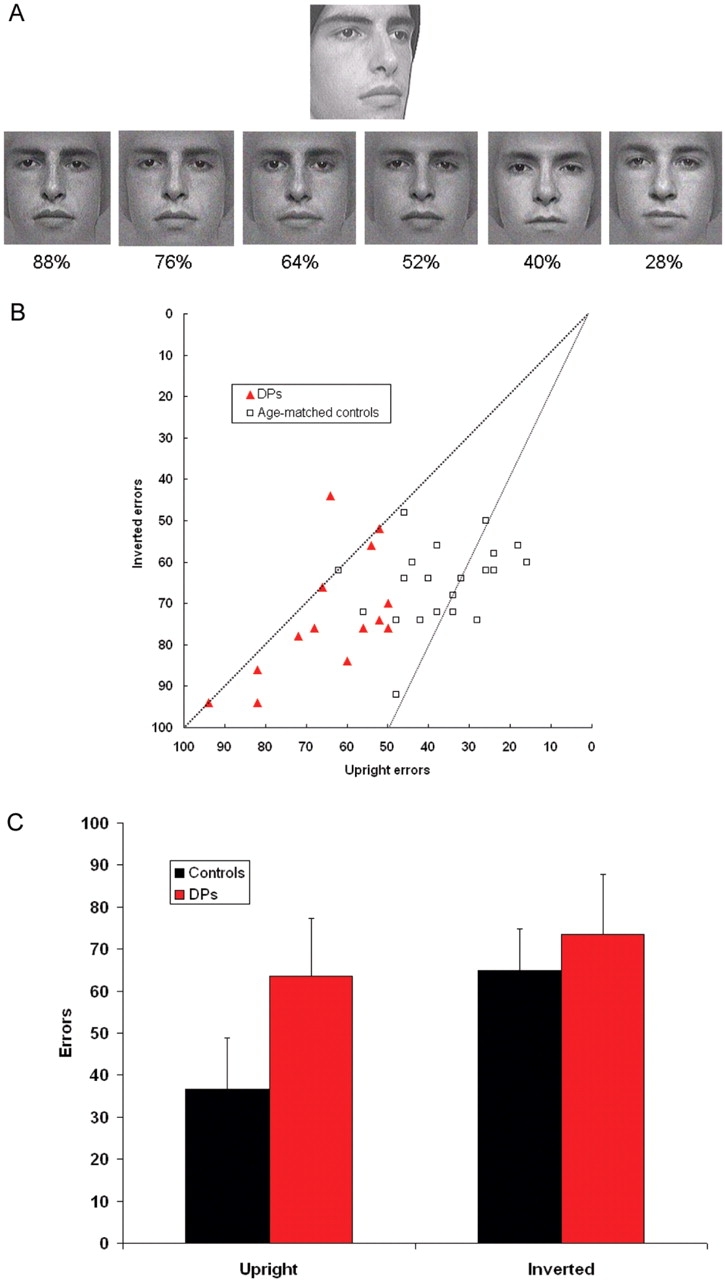
Cambridge Face Perception Test. (a) Images from an item in the Cambridge Face Perception Test. The six frontal shots are presented in a random order and must be sorted by their similarity to the target image (the 3/4 profile view). Numbers under each image indicate the percentage of the target face in the image. Note that each image is morphed with a different exemplar. (B) DP and control scores on the CFPT. DPs score more poorly with the upright sort than controls, but score similarly with inverted sorts. The dashed line running from corner to corner indicates equivalence with upright and inverted sorting. The smaller dashed line displays the position at which subjects made twice as many inverted errors as upright errors. (C) Average errors for controls and DPs with the upright and inverted CFPT sorts. Error bars show one standard deviation. Controls show a large inversion effect while DPs performed only slightly better with upright faces than with inverted faces.
Scores for each item were computed by summing the deviations from the correct position for each face. For example, if a face was one position from its correct position, that was one error. If three positions away, that was three errors. Scores for each of the eight upright items and each of the eight inverted items were added to determine total number of upright and inverted errors. Chance performance with items of one orientation would result in 94 errors.
Figure 3B displays upright and inverted errors for each control and DP. Twenty-one age-matched controls (average age = 46.5 years) showed a robust inversion effect. Figure 3B shows that none of the controls were above the line of equivalence for upright and inverted errors. In fact, most clustered around the other line in the figure, which displays scores with twice as many inverted errors as upright errors. Controls averaged 36.7 errors (s.d. = 12.2) on the upright sorts while their inverted average was 65.0 errors (s.d. = 9.8).
DPs showed a different pattern of results. Their scores are shifted to the left on Figure 3B, because they made far more upright errors than controls yet made only slightly more inverted errors. In addition, many of the DPs showed little or no inversion effect. These effects are especially apparent in Figure 3C, which displays upright and inverted means for each group. An ANOVA found significant effects for orientation [F(1,33) = 70.5, p < 0.001], group (1,33) = 19.3, p < 0.001) and the interaction between orientation and group [F(1,33) = 23.9, p < 0.001]. For upright trials, DPs averaged 64.4 errors (s.d. = 13.8), and their average was significantly different from the age-matched control group [t(33) = 6.25, p < 0.001]. All DPs did poorly with upright trials, with −1.1 s.d. being the best individual z score. Their inverted average of 73.3 errors (s.d. = 14.8) narrowly failed to reach significance when compared to the control average [t(33) = 2.01, p = 0.053].
Face part and spacing discrimination test
Our next test examines perception of face parts and face spacing (configuration) separately. Not only will this test assess whether the DPs have perceptual problems with faces, but it will also test a prediction of the domain-general configural hypothesis. Namely, if DP is caused primarily by impairments that affect configural processing, the DP group should have greater deficits with spacing discriminations than part discriminations.
Participants were sequentially presented with two faces for 500 ms each, and they judged whether the two faces were identical or different (Yovel and Duchaine, 2006). Forty trials consisted of pairs of identical images while 40 consisted of pairs of different images. There were two types of different trials. Faces with varied part spacing were created by manipulating the horizontal distance between the eyes and the vertical distance between the nose and mouth. Faces with varied parts were created by pasting in different eyes and mouths. Importantly, parts in the spacing variants were the same and spacing in the part variants was the same. This task was referred to as the Ann-S task in Yovel and Duchaine (2006). M47, however, was tested with a comparable task using a different face (Alfred) (Yovel and Kanwisher, 2004; Yovel and Duchaine, 2006). M47's z scores are presented in Appendix A but are not included in the figure displaying the results of the Ann task (Figure 4).
Fig. 4.

Percent correct for DPs and controls on the same–different face discrimination. The DPs perform more poorly than controls on both part and spacing discriminations.
The discrimination abilities of the 13 DPs who did the Ann task were compared to 15 age-matched controls. Figure 4 shows that the DPs scored much more poorly than controls on both the part and spacing discrimination. The DPs showed a significant deficit in discrimination of the faces relative to the controls [60 vs 78%, F(1,27) = 27.30, p < 0.0001]. Like Yovel and Duchaine (2006), both the DPs and the controls showed no difference between their performance on the spacing (DPs = 59%, Cont = 77%) and part (DPs = 60%, Controls = 80%) discrimination tasks. Thus, the main effect of type (spacing or part) [F(1,23) < 1] and the interaction of Group and Type [F(1,23) < 1] were not significant. The DPs’ comparable deficits with spacing and part discrimination demonstrates that their face deficits are not limited to configural information as the domain-general configural hypothesis predicts.
Global vs local: Navon letter task
Having demonstrated that the DPs suffer from face memory and face perception deficits, we can now examine the key question: Do developmental prosopagnosics also show a specific pattern of deficits with respect to global vs local processing as claimed by Behrmann et al. (2005)? Will they be impaired with global processing in a global–local task and will they be more influenced by local information on global judgments and less affected by global information on local judgments?
Compound letters consisted of a number of small capital Ss or Hs (local letters) configured to form either a global S or H (Figure 1). The Global letters subtended 3 × 2 degrees of visual angle, the smaller local letters, 0.4 × 0.35 degrees of visual angle. Participants responded to either the local aspect or the global aspect in blocks of 48 trials. Each participant was tested in two back-to-back sessions, and the order of the blocks within a session was local, global, global and local for a total of 384 trials. The local and global letters were consistent on half the trials and inconsistent on the other half.
To ensure that we obtained the typical global precedence effects in controls, we varied the vertical position of the compound stimulus from trial to trial to prevent participants from focusing on a tiny area of the screen during local blocks. This strategy can spuriously improve local performance and lessen the effect of global information on local discrimination (Robertson and Lamb, 1988; Navon, 2003) by allowing participants to more easily ignore the global information.
The letter remained visible until participants made a key press to indicate whether an S or an H was presented at the attended level. A fixation point was presented for 600 ms after each response. Five practice trials preceded the initial global block and the initial local block. Response times for incorrect trials were not included when response time averages were computed. In addition, we computed the average RT for each subject in each condition and then removed response times more than 2.5 s.d. longer than the average RT.
The performance of the DPs on the global–local task was compared to a group of 14 age-matched controls (average age = 41.7 years). We performed an ANOVA with Level (Global, Local) and Consistency (Consistent, Inconsistent) as within-subject factors and Group (DP, Controls) as a between-subject factor.
Figure 5 displays the means for the DPs and the age-matched control group for the global–local task (see Figure 6 and Appendix B for individual DP results and control averages). Overall response time of the age-matched control group did not differ from the DPs [no main effect of Group F(1,26) < 1]. As shown in Figure 6, overall the DPs and the controls showed a similar pattern of response to the hierarchical letters. Both groups showed a faster response to the global than the local level [main effect of Level: F(1,26) = 26.1, p < 0.00001; for DPs: F(1,13) = 8.6, p <0 .05; for Controls F(1,13) = 17.1, p <0 .0001] and a faster response to consistent than inconsistent letters [main effect of Consistency F(1,26) = 135.46, p < 0.00001; for DPs F(1,13) = 67.5, p < 0.0001; for Controls F(1,13) = 69.4, p < 0.0001]. Paired comparisons found that controls and DPs showed significant global precedence, significant consistency effects on global discriminations, and significant consistency effects on local discriminations (see Appendix C for these results).
Fig. 5.

Average RTs for the controls and the DPs on the global–local task. Note that although the DPs show greater separation between local and global RTs than controls the difference is not significant and more importantly it is in the wrong direction to that predicted by the domain-general configural hypothesis.
Fig. 6.
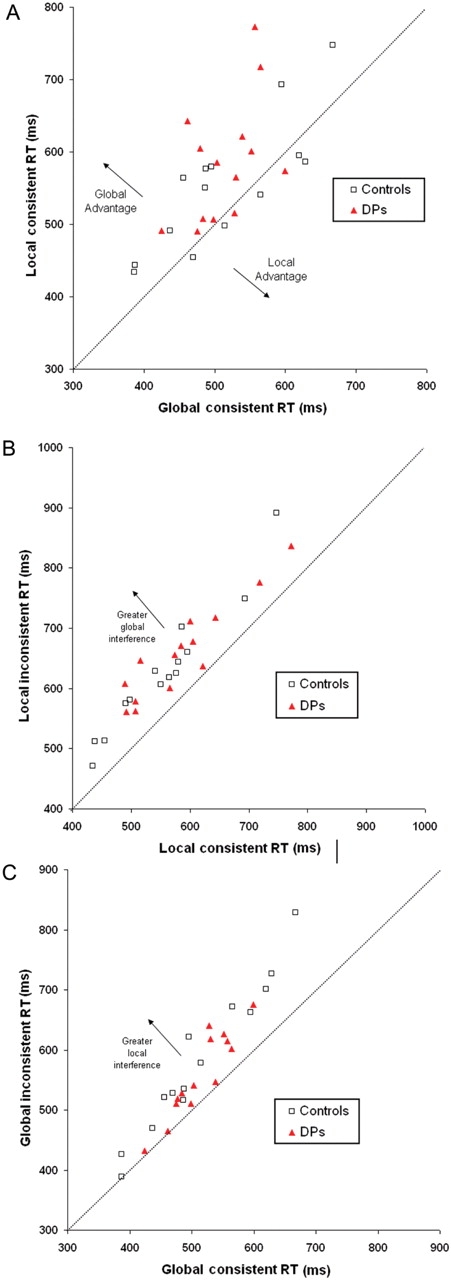
Individual RTs of DPs and controls on the global–local task. Each point represents one participant. (A) Comparison of average RTs on global consistent trials and local consistent trials. (B) Comparison of average RTs for local consistent and inconsistent trials. (C) Comparison of average RTs for global consistent and inconsistent trials.
A weak interaction of Group × Level × Consistency [F(1,26) = 4.7, p = 0.04] reflects that, contrary to the report of a local bias in DPs (Behrmann et al., 2005), our data show a weak global bias in DPs relative to the controls. To further assess this result, we examined whether the two groups differed significantly in the magnitude of their global precedence and global-to-local and local-to-global consistency measures. We computed the difference between global and local consistent conditions (i.e. global precedence), the difference between the local consistent and local inconsistent conditions (i.e. global interference) and the difference between global consistent and global inconsistent (i.e. local interference) for the two groups and used ANOVA to compare between the groups. In contrast to the predictions of the domain-general configural hypothesis (i.e. local bias in DPs), DPs showed a trend towards larger global precedence than the controls [Group × Global Precedence, F(1,26) = 4.6, p = 0.04] (Figure 6A). There was no difference in the magnitude of global-to-local consistency effects between the DP and the control group [Group × Global Interference, F(1,26) < 1] (Figure 6B). The controls showed a trend towards a larger local-to-global consistency effects than the DPs (Group × Local Interference, F(1,26) = 3.1, p = 0.09] (Figure 6C).
Accuracy for both controls and DPs was at ceiling for all conditions with percent correct ranging from 98.0 to 98.7%. None of the differences were significant.
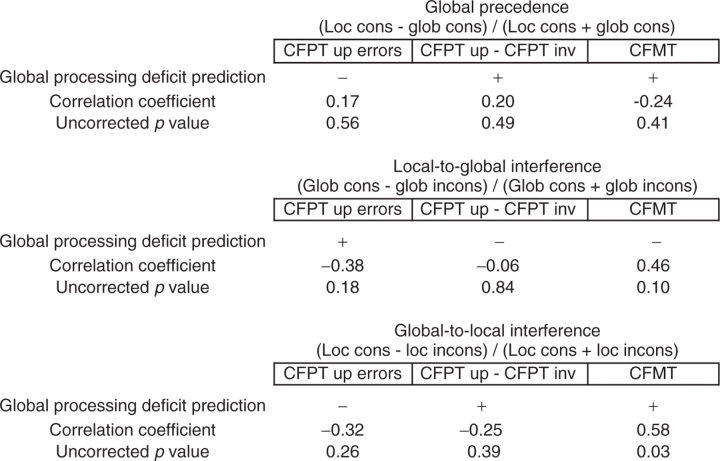
If face processing and Navon-type global processing depend on the same mechanisms, face processing ability should be positively correlated with global processing ability. To examine this prediction, we computed correlations for three measures of global processing and three measures of face processing. For global processing, we computed global precedence, local-to-global consistency effects and global-to-local consistency effects (Table 1 for formulas). The three measures of face processing were CFPT scores, the difference between CFPT upright and CFPT inverted scores and CFMT scores. Table 1 presents the predicted direction of the correlation made by the domain-general configural hypothesis, the correlations and the P values (not corrected for multiple comparisons). As is apparent, the pattern of correlations is not consistent with the predictions of the domain-general configural hypothesis. Five of the nine correlations are in the wrong direction. The only significant correlation is in the predicted direction, but the other correlation which just failed to reach significance is in the wrong direction.
Table 1.
Correlations of global processing measures with face processing measures
 |
DISCUSSION
Configural information in faces is represented more precisely than configural information in many other objects (Yin, 1969; Young et al., 1987; Tanaka and Farah, 1993). Considerable evidence from a variety of sources indicates that faces are processed by mechanisms specialized for faces and these mechanisms are a likely source of face configural processing (Moscovitch et al., 1997; Yovel and Kanwisher, 2006). This view was challenged however in a recent paper examining non-face global processing in DPs (Behrmann et al., 2005). The domain-general configural hypothesis suggests that face configural processing results from mechanisms that operate on faces and other types of objects. It predicts that individuals with face perception impairments will also show impairments with non-face tasks that require configural processing.
We tested the prediction of the domain-general configural account with 14 developmental prosopagnosics. These DPs reported significant face recognition problems in everyday life, and our testing verified their face memory deficits. Importantly, our two tests of face perception showed that these DPs were impaired with face perception as well. The spacing discrimination test directly demonstrated that the DPs were impaired with face configural information. The other half of the discrimination test, the part discrimination, showed that their deficits with faces were not limited to configural information but also extended to part information, a finding consistent with other recent reports (Duchaine et al., 2006; Yovel and Duchaine, 2006). The DPs’ deficit with face parts shows that impaired configural processing cannot fully account for their prosopagnosia.
Having documented the DPs’ face memory and perception deficits, we next compared their performance on a global–local task to controls (Navon, 1977). In contrast to Behrmann et al. (2005), control averages for global responses were faster than local responses and responses to stimuli consisting of inconsistent letters were slower than responses to consistent stimuli for both global and local discriminations. Contrary to the predictions of the domain-general configural hypothesis, the DPs showed a global advantage comparable to the controls. In fact, the global advantage was slightly larger for DPs than for age-matched controls. The effects of consistent and inconsistent letters in the unattended level of the compound stimuli were also inconsistent with the domain-general configural hypothesis. It predicts greater local effects on global discriminations, but the effect for DPs was somewhat smaller than for controls. Furthermore, the hypothesis predicts a weaker global effect on local discriminations, but the effects were nearly identical for the two groups. The accuracy results also show no differences between DPs and controls with both groups producing near ceiling performance for all conditions. Hence, on all measures of global processing in the global–local task, the performance of the DPs was normal. We found no support for the domain-general configural hypothesis.
Differences between our results and those of Behrmann et al.
Our global–local results are inconsistent with several aspects of Behrmann et al.'s (2005) findings, and we believe that these differences may stem from a single methodological difference. The most critical difference between the results of the two papers is that our DPs performed typically on all measures of global–local processing while their group of five DPs showed a greater local advantage than controls and they were also more affected by local information on global discriminations than controls. Two of their DPs, however, did not show atypical local superiority and three showed normal levels of local interference on global discriminations. Given that some of their DPs had normal non-face global processing and our 14 DPs gave no indication of atypical non-face global processing, we believe that this is the typical pattern in DP. Most importantly, the normal performance of these DPs clearly demonstrates that non-face global processing and face configural processing are dissociable. Severe face processing deficits commonly co-occur with normal non-face global processing. A similar dissociation was also found in a group of 13 DPs who showed normal discrimination of spacing (configural) variants in houses coupled with impaired discrimination of spacing variants in faces (Yovel and Duchaine, 2006). Only one of the DPs featured in Yovel and Duchaine (2006) was discussed in this paper.
Another difference between our results and Behrmann et al.'s results is the pattern of RTs in controls. Our controls (like our DPs) showed the typical pattern for Navon tasks, with faster global than local discriminations. In contrast, Behrmann et al.'s controls showed a non-significant advantage for local discriminations. Additionally, our controls produced interference effects for both global and local discriminations; Behrmann et al.'s controls only showed interference effects for local information on global discriminations. What produced this difference? The compound stimuli were the same in both experiments and the visual angle was comparable, but we presented the stimuli in four vertical positions, whereas the stimuli were presented in the same location on each trial in Behrmann et al. (2005). Varying the location of the stimulus prevents participants from focusing on a small section of the stimulus during the local discriminations. Such a strategy can speed local discriminations relative to global and can lessen the effect of global interference on local discriminations (Robertson and Lamb, 1988; Navon, 2003)—effects which would neatly explain the difference between the results for the two control groups. Moreover, the possibility of focusing on a section also suggests an explanation for the difference between Behrmann et al.'s controls and their DPs. If a larger proportion of their DPs than controls happened to use this strategy during local discriminations, DPs would be expected to show increased local precedence. Another possibility is that the different results in DPs is simply a reflection of the heterogeneity in DP (Behrmann and Avidan, 2005; Duchaine and Nakayama, 2006). A number of other developmental problems sometimes co-occur with DP, and a few of Behrmann et al.'s participants may have problems with non-face global processing. Regardless of the explanation of the difference between our findings and those from Behrmann et al. (2005), our results clearly demonstrate that general configural processing problems cannot account for most cases of DP.
Support for holistic face-specific mechanisms
Although our testing does not demonstrate that our DPs experience prosopagnosia due to face-specific deficits (Duchaine et al., 2006), the global–local results are consistent with the face-specific hypothesis. Two versions of the face-specific hypothesis have been discussed (Farah et al., 1998; Freire et al., 2000; Yovel and Duchaine, 2006). The spacing version suggests that face-specific mechanisms represent the spatial configuration of face parts while more general recognition mechanisms represent the face parts themselves (Freire et al., 2000). The holistic version proposes that faces are processed as undecomposed wholes, with both spacing and parts represented by the same mechanisms (Tanaka and Farah, 1993; Biederman and Kalocsai, 1997; Yovel and Kanwisher, 2004). If different mechanisms represent the spacing and parts, the ability to process these aspects will often dissociate in prosopagnosics. If, however, the same mechanisms process both types of information, prosopagnosics should show comparable impairments with spacing and parts.
To document the DPs’ face perception problems, we tested them with the Ann task which required discrimination of spacing changes and part changes. Consistent with the predictions of the holistic account and previous results (Yovel and Duchaine, 2006), the DPs were similarly impaired with face spacing discriminations and face part discriminations. Hence our results suggest face spacing and face parts are represented by common mechanisms.
SUMMARY
We examined whether DPs have impairments in a global–local task to assess whether deficits with general purpose configural processing can account for their prosopagnosia. The DPs showed no deficit with a global–local task and these results are inconsistent with the predictions of the domain-general configural account. Because their deficits with faces affected both spacing and part processing, face processing appears to result from the operation of mechanisms specialized for holistic processing of facial information. More broadly, the results also demonstrate the value of assessing larger samples of DPs. Our laboratory has been contacted by more than 2000 individuals who believe they are developmental prosopagnosics. DP is clearly not a rare disorder as was previously believed (Kennerknecht et al., 2006), and conclusions will be on much firmer ground as larger samples are studied.
Acknowledgments
We are grateful for the DPs’ generosity in providing their time and effort to this project. We thank Laura Germine, Lucia Garrido, Kerry Dingle, Gayle Speck, George Gordon, Kathleen Cui and Carl Mueller for their assistance. This was supported by a grant to BD (ESRC: RES-061-23-0400) and another to KN (R01 EY13602).
Appendix A
z scores for DPs on face test
| Nationality | Occupation | Famous face | CFMT | CFPT Up | CFPT Inv | Spacing | Parts | |
|---|---|---|---|---|---|---|---|---|
| F18 | UK | Model | −5.5 | −3.9 | −1.3 | 1.3 | −2.3 | −2.6 |
| M30 | UK | Designer | −3.1 | −2.3 | −2.2 | 2.1 | −4.4 | −3.4 |
| M32 | UK | Researcher | −4.4 | −2.6 | −1.6 | −1.1 | −4.5 | −0.3 |
| F32 | UK | IT | −1.8 | −2.2 | −1.3 | −0.9 | −0.3 | −1.9 |
| F35 | Canadian | Researcher | −4.8 | −3.0 | −4.7 | −3.0 | −4.0 | −2.6 |
| M35 | UK | Sales | −6.1 | −2.8 | −2.6 | −1.1 | −4.0 | −5.3 |
| F39 | Canadian | Artist | −4.0 | −2.7 | −1.1 | −1.1 | −2.3 | −2.6 |
| M41 | UK | Administrator | −2.6 | −3.6 | −1.1 | −0.5 | 0.5 | −2.2 |
| M45 | US | Researcher | −0.4 | −3.2 | −2.4 | −0.1 | −4.0 | −3.4 |
| M47 | UK | Civil Engineer | −4.2 | −4.1 | −3.7 | −3.0 | −0.6 | −3.1 |
| M51 | UK | Executive | −5.3 | −3.1 | −1.4 | 0.9 | −1.9 | −1.5 |
| M54 | UK | Education | −7.6 | −3.8 | −2.9 | −1.3 | −6.0 | −5.7 |
| M56 | US | Sales | −2.8 | −2.2 | −1.9 | −1.9 | −4.0 | 0.8 |
| F62 | UK | IT | −5.8 | −4.1 | −3.7 | −2.1 | −4.4 | −4.1 |
Appendix B
RTs and percent correct for DPs on the global–local task
| Global consistent | Global inconsistent | Local consistent | Local inconsistent | Global consistent | Global inconsistent | Local consistent | Local inconsistent | |
|---|---|---|---|---|---|---|---|---|
| F18 | 499 | 510 | 507 | 578 | 0.99 | 0.99 | 1.00 | 0.97 |
| M30 | 528 | 641 | 515 | 646 | 0.96 | 0.98 | 0.99 | 0.94 |
| M32 | 504 | 541 | 585 | 671 | 0.99 | 1.00 | 1.00 | 0.98 |
| F32 | 476 | 510 | 490 | 608 | 0.99 | 0.99 | 1.00 | 1.00 |
| F35 | 425 | 432 | 492 | 561 | 0.98 | 0.93 | 1.00 | 0.95 |
| M35 | 462 | 465 | 643 | 717 | 0.99 | 1.00 | 0.99 | 1.00 |
| F39 | 552 | 627 | 601 | 711 | 0.98 | 0.96 | 1.00 | 0.98 |
| M41 | 557 | 615 | 772 | 836 | 0.99 | 0.98 | 0.99 | 0.99 |
| M45 | 477 | 518 | 605 | 677 | 0.99 | 0.99 | 1.00 | 0.97 |
| M47 | 539 | 546 | 621 | 637 | 0.99 | 0.99 | 1.00 | 1.00 |
| M51 | 484 | 528 | 508 | 562 | 1.00 | 0.99 | 1.00 | 1.00 |
| M54 | 600 | 676 | 574 | 656 | 1.00 | 0.99 | 1.00 | 0.94 |
| M56 | 530 | 619 | 565 | 601 | 1.00 | 1.00 | 0.99 | 1.00 |
| F62 | 564 | 602 | 718 | 775 | 1.00 | 1.00 | 1.00 | 1.00 |
| DP Ave | 514 | 559 | 586 | 660 | 0.99 | 0.98 | 1.00 | 0.98 |
| DP SD | 63 | 71 | 85 | 80 | 0.01 | 0.02 | 0.005 | 0.02 |
| Control Ave | 514 | 584 | 554 | 627 | 0.98 | 0.97 | 1.00 | 0.97 |
| Control SD | 89 | 124 | 90 | 107 | 0.03 | 0.03 | 0.005 | 0.04 |
Appendix C
Paired-sample t-tests for the global-local task
| Controls | Mean | SD | SEM | t | df | p | |
|---|---|---|---|---|---|---|---|
| Local interference | GC–GI | −70.47 | 41.74 | 11.16 | −6.32 | 13 | <0.01 |
| Global interference | LC–LI | −73.34 | 28.48 | 7.61 | −9.64 | 13 | <0.01 |
| Global precedence | GC–LC | −40.05 | 53.05 | 14.18 | −2.82 | 13 | <0.02 |
| DPs | |||||||
| Local interference | GC–GI | −45.09 | 33.19 | 8.87 | −5.08 | 13 | <0.01 |
| Global interference | LC–LI | −74.37 | 30.79 | 8.23 | −9.04 | 13 | <0.01 |
| Global precedence | GC–LC | −71.33 | 73.69 | 19.69 | −3.62 | 13 | <0.01 |
Footnotes
Conflict of Interest
None declared.
REFERENCES
- Badcock J, Whitworth F, Badcock D, Lovegrove W. Low-frequency filtering and the processing of local-processing stimuli. Perception. 1990;19:617–29. doi: 10.1068/p190617. [DOI] [PubMed] [Google Scholar]
- Behrmann M, Avidan G, Marotta J, Kimchi R. Detailed exploration of face-related processing in congenital prosopagnosia: 1. Behavioral findings. Journal of Cognitive Neuroscience. 2005;17:1130–49. doi: 10.1162/0898929054475154. [DOI] [PubMed] [Google Scholar]
- Biederman I, Kalocsai P. Neurocomputational bases of object and face recognition. Philosophical Transactions of the Royal Society: Biological Sciences. 1997;352:1203–19. doi: 10.1098/rstb.1997.0103. [DOI] [PMC free article] [PubMed] [Google Scholar]
- Diamond R, Carey S. Why faces are and are not special - an effect of expertise. Journal of Experimental Psychology-General. 1986;115:107–17. doi: 10.1037//0096-3445.115.2.107. [DOI] [PubMed] [Google Scholar]
- Duchaine B, Nakayama K. The Cambridge Face Memory Test: results for neurologically intact individuals and an investigation of its validity using inverted face stimuli and prosopagnosic participants. Neuropsychologia. 2006;44:576–85. doi: 10.1016/j.neuropsychologia.2005.07.001. [DOI] [PubMed] [Google Scholar]
- Duchaine B, Yovel G, Butterworth E, Nakayama K. Prosopagnosia as an impairment to face-specific mechanisms: elimination of the alternative hypotheses in a developmental case. Cognitive Neuropsychology. 2006;23:714–47. doi: 10.1080/02643290500441296. [DOI] [PubMed] [Google Scholar]
- Farah MJ, Wilson KD, Drain HM, Tanaka JR. The inverted face inversion effect in prosopagnosia: evidence for mandatory, face-specific perceptual mechanisms. Vision Research. 1995;35:2089–93. doi: 10.1016/0042-6989(94)00273-o. [DOI] [PubMed] [Google Scholar]
- Farah MJ, Wilson KD, Drain M, Tanaka JN. What is “special” about face perception? Psychological Review. 1998;105:482–98. doi: 10.1037/0033-295x.105.3.482. [DOI] [PubMed] [Google Scholar]
- Freire A, Lee K, Symons LA. The face-inversion effect as a deficit in the encoding of configural information: direct evidence. Perception. 2000;29:159–70. doi: 10.1068/p3012. [DOI] [PubMed] [Google Scholar]
- Hayes T, Morrone MC, Burr D. Recognition of positive and negative bandpass-filtered images. Perception. 1986;15:595–602. doi: 10.1068/p150595. [DOI] [PubMed] [Google Scholar]
- Humphreys G, Riddoch MJ. Birmingham Object Recognition Battery. Hove: Lawrence Erlbaum Associates; 1993. [Google Scholar]
- Kanwisher N. Domain specificity in face perception. Nature Neuroscience. 2000;3:759–63. doi: 10.1038/77664. [DOI] [PubMed] [Google Scholar]
- Kennerknecht I, Grueter T, Welling B, et al. First report of prevalence of non-syndromic hereditary prosopagnosia (HPA) American Journal of Medical Genetics A. 2006;140:1617–22. doi: 10.1002/ajmg.a.31343. [DOI] [PubMed] [Google Scholar]
- Lamb M, Robertson L. The processing of hierarchical stimuli: effects of retinal locus, locational uncertainty, and stimulus identity. Perception and Psychophysics. 1988;44:172–81. doi: 10.3758/bf03208710. [DOI] [PubMed] [Google Scholar]
- LeGasse L. Effects of good form and spatial frequency on global precedence. Perception and Psychophysics. 1993;53:89–105. doi: 10.3758/bf03211718. [DOI] [PubMed] [Google Scholar]
- Leder H, Bruce V. Local and relational aspects of face distinctiveness. Quarterly Journal of Experimental Psychology A. 1998;51:449–73. doi: 10.1080/713755777. [DOI] [PubMed] [Google Scholar]
- LeGrand R, Mondloch CJ, Maurer D, Brent HP. Neuroperception. Early visual experience and face processing. Nature. 2001;410:890. doi: 10.1038/35073749. [DOI] [PubMed] [Google Scholar]
- McKone E, Martini P, Nakayama K. Categorical perception of face identity in noise isolates configural processing. Journal Experimental Psychology: Human Perception and Performance. 2001;27:573–99. doi: 10.1037//0096-1523.27.3.573. [DOI] [PubMed] [Google Scholar]
- McNeill J, Warrington EK. Prosopagnosia: a face-specific disorder. Quarterly Journal of Experimental Psychology A. 1993;46:1–10. doi: 10.1080/14640749308401064. [DOI] [PubMed] [Google Scholar]
- Moscovitch M, Winocur G, Behrmann M. What is special about face recognition? Nineteen experiments on a person with visual object agnosia and dyslexia but normal face recognition. Journal of Cognitive Neuroscience. 1997;9:555–604. doi: 10.1162/jocn.1997.9.5.555. [DOI] [PubMed] [Google Scholar]
- Nasanen R. Spatial frequency bandwidth used in the recognition of facial images. Vision Research. 1999;39:3824–33. doi: 10.1016/s0042-6989(99)00096-6. [DOI] [PubMed] [Google Scholar]
- Navon D. Forest before trees - precedence of global features in visual-perception. Cognitive Psychology. 1977;9:353–83. [Google Scholar]
- Navon D. What does a compound letter tell the psychologist? Acta Psychologica. 2003;114:273–309. doi: 10.1016/j.actpsy.2003.06.002. [DOI] [PubMed] [Google Scholar]
- Pelli D, Robson J, Wilkins A. The design of a new letter chart for measuring contrast sensitivity. Clinical Vision Sciences. 1988;2:187–99. [Google Scholar]
- Sergent J, Signoret J-L. Varieties of functional deficits in prosopagnosia. Cerebral Cortex. 1992;2:375–88. doi: 10.1093/cercor/2.5.375. [DOI] [PubMed] [Google Scholar]
- Shulman G, Sullivan M, Gish K, Sakoda W. The role of spatial-frequency channels in the perception of local and global structure. Perception. 1986;15:259–73. doi: 10.1068/p150259. [DOI] [PubMed] [Google Scholar]
- Shulman G, Wilson J. Spatial frequency and selective attention to local and global information. Perception. 1987;16:89–101. doi: 10.1068/p160089. [DOI] [PubMed] [Google Scholar]
- Tanaka JW, Farah MJ. Parts and wholes in face recognition. Quarterly Journal of Experimental Psychology A. 1993;46:225–45. doi: 10.1080/14640749308401045. [DOI] [PubMed] [Google Scholar]
- Tanaka JW, Sengco JA. Features and their configuration in face recognition. Memory & Cognition. 1997;25:583–92. doi: 10.3758/bf03211301. [DOI] [PubMed] [Google Scholar]
- Tsao DY, Freiwald WA, Tootell RB, Livingstone MS. A cortical region consisting entirely of face-selective cells. Science. 2006;311:670–4. doi: 10.1126/science.1119983. [DOI] [PMC free article] [PubMed] [Google Scholar]
- Yin RK. Looking at upside-down faces. Journal of Experimental Psychology. 1969;81:141–5. [Google Scholar]
- Young AW, Hellawell D, Hay DC. Configurational information in face perception. Perception. 1987;16:747–59. doi: 10.1068/p160747. [DOI] [PubMed] [Google Scholar]
- Yovel G, Duchaine B. Specialized face perception mechanisms extract both part and spacing information: evidence from developmental prosopagnosia. Journal of Cognitive Neuroscience. 2006;18:580–93. doi: 10.1162/jocn.2006.18.4.580. [DOI] [PubMed] [Google Scholar]
- Yovel G, Kanwisher N. Face perception: domain specific, not process specific. Neuron. 2004;44:889–98. doi: 10.1016/j.neuron.2004.11.018. [DOI] [PubMed] [Google Scholar]
- Yovel G, Kanwisher N. The neural basis of the behavioral face-inversion effect. Current Biology. 2006;15:2256–62. doi: 10.1016/j.cub.2005.10.072. [DOI] [PubMed] [Google Scholar]