

Abstract
As a central kinase in the phosphatidylinositol 3-kinase pathway, Akt has been the subject of extensive research; yet, spatiotemporal regulation of Akt in different membrane microdomains remains largely unknown. To examine dynamic Akt activity in membrane microdomains in living cells, we developed a specific and sensitive fluorescence resonance energy transfer-based Akt activity reporter, AktAR, through systematic testing of different substrates and fluorescent proteins. Targeted AktAR reported higher Akt activity with faster activation kinetics within lipid rafts compared with nonraft regions of plasma membrane. Disruption of rafts attenuated platelet-derived growth factor (PDGF)-stimulated Akt activity in rafts without affecting that in nonraft regions. However, in insulin-like growth factor-1 (IGF)-1 stimulation, Akt signaling in nonraft regions is dependent on that in raft regions. As a result, cholesterol depletion diminishes Akt activity in both regions. Thus, Akt activities are differentially regulated in different membrane microdomains, and the overall activity of this oncogenic pathway is dependent on raft function. Given the increased abundance of lipid rafts in some cancer cells, the distinct Akt-activating characteristics of PDGF and IGF-1, in terms of both effectiveness and raft dependence, demonstrate the capabilities of different growth factor signaling pathways to transduce differential oncogenic signals across plasma membrane.
INTRODUCTION
Human serine-threonine kinase Akt (Bellacosa et al., 1991) was first identified as an oncogene in 1991, followed by discovery and characterization of many important upstream and downstream regulatory components (Brazil and Hemmings, 2001). There are three mammalian Akt isoforms, all of which share similar domain structures that include three functional domains, namely, an N-terminal pleckstrin homology (PH) domain, a kinase domain, and a C-terminal regulatory hydrophobic motif (Frech et al., 1997; Vivanco and Sawyers, 2002). As a key cellular regulator that transduces various signals that turn on phosphatidylinositol 3-kinase (PI3K), the activity of Akt is dynamically regulated. On growth factor stimulation, active PI3K catalyzes the conversion of phosphatidylinositol (4,5)-bisphosphate [PI(4,5)P2] into the cell membrane-bound second messenger phosphatidylinositol (3,4,5)-triphosphate [PI(3,4,5)P3], which recruits Akt to plasma membrane, where 3-phosphoinositide–dependent protein kinase 1 phosphorylates the T-loop of Akt at a threonine residue (Thr 308/309) (Alessi et al., 1997). Another phosphorylation event mediated by mammalian target of rapamycin–Rictor complex occurs at a serine residue located in the C-terminal hydrophobic motif of Akt (Ser 473/474) (Sarbassov et al., 2005), leading to full activation of Akt. A tumor suppressor, phosphatase and tensin homologue deleted on chromosome 10 (PTEN), dephosphorylates PI(3, 4,5)P3 to PI(4,5)P2, suppressing Akt activation through reduction of the second messenger (Li and Ross, 2007). Two phosphatases, protein phosphatase 2A (PP2A) (Ugi et al., 2004) and PH domain leucine-rich repeat protein phosphatase (PHLPP) (Gao et al., 2005; Brognard et al., 2007), regulate Akt activity in vivo by directly dephosphorylating Thr 308/309 (PP2A) and Ser 473/474 (PHLPP), respectively.
Active Akt regulates several cellular processes that are critical to tumorigenesis, from cell growth and proliferation to survival and motility. Not coincidentally, it has been shown that components of the PI3K/Akt signaling pathway are frequently altered in a wide range of tumor types (Vivanco and Sawyers, 2002; Luo et al., 2003). For example, elevated Akt1 kinase activity (Sun et al., 2001), Akt2 amplification and overexpression (Bellacosa et al., 1995), up-regulation of Akt3 (Nakatani et al., 1999), and loss of PTEN (Dahia et al., 1997; Forgacs et al., 1998; Lu et al., 1999; Zhou et al., 2000) have all been observed in various cancers. Recently, a single transforming mutation in the PH domain of Akt1 has been identified in various tumors (Carpten et al., 2007). Given the central importance of this pathway, a detailed understanding of its regulation is critical for both basic science and clinical advances.
The regulatory mechanisms underlying the PI3K/Akt pathway are complex, because this pathway serves as a major hub in the signal transduction network to connect various upstream signals with an array of downstream signaling cascades. Although it is well known that Akt can be activated after activation of different growth factor receptors, their specific regulatory mechanisms pertaining to Akt activation have not been fully investigated. Furthermore, the plasma membrane, as a major site of Akt activation and integration of different growth factor signals, contains multiple microdomains. Among them, the cholesterol rich, detergent-resistant microdomains, lipid rafts, have been suggested as critical signaling platforms (Hancock, 2003; Hanzal-Bayer and Hancock, 2007). It has been indicated that raft-associated Akt could be an important determinant of oncogenicity (Adam et al., 2007). However, the activation of Akt in different plasma membrane microdomains has not been studied in the cellular context. This is, at least in part, due to the lack of methods and tools suitable for dissecting signaling mechanisms in a complex and dynamic cellular environment. Here, by developing and using a genetically encodable Akt activity reporter, we analyze the spatiotemporal dynamics of Akt activity within plasma membrane microdomains in live-cell context, showing platelet-derived growth factor (PDGF)- or insulin-like growth factor-1 (IGF)-1–stimulated Akt activity is differentially regulated between raft and nonraft regions of the plasma membrane.
MATERIALS AND METHODS
Materials
PDGF, IGF-1, phorbol 12-myristate 13-acetate (PMA), forskolin, Calyculin A, methyl-β-cyclodextrin (MβCD), and LY294002 were purchased from Sigma-Aldrich (St. Louis, MO). SH-5 was purchased from Calbiochem (San Diego, CA). Akt antibody, phospho-Akt (S473) antibody, and phospho-forkhead transcription factor O (FOXO)1 (S256) antibody were from Cell Signaling Technology (Danvers, MA). Horseradish peroxidase-conjugated cholera toxin B subunit was from Invitrogen (Carlsbad, CA).
Western Analysis
NIH 3T3 cells were serum starved for 24 h, followed by stimulation with growth factors in the presence or absence of MβCD. Cells were washed with ice-cold phosphate-buffered saline, and then lysed in radioimmunoprecipitation assay lysis buffer containing protease inhibitor cocktail, 1 mM phenylmethylsulfonyl fluoride (PMSF), 1 mM NaVO4, 1 mM NaF, and 25 nM Calyculin A. Total cell lysates were incubated on ice for 30 min, and then they were centrifuged at 4°C for 20 min. Total protein was separated with 10% SDS-polyacrylamide gel electrophoresis (PAGE) and transferred to nitrocellulose membranes. Membranes were blocked with Tris-buffered saline containing 0.05% Tween 20 and 1% bovine serum albumin, and then they were incubated with antibodies overnight at 4°C. After incubation with appropriate horseradish peroxidase-conjugated secondary antibodies, bands were visualized by enhanced chemiluminescence. The intensity of the bands was quantified, and the values were then normalized to total Akt level by using UN-SCAN-IT (Silk Scientific, Orem, UT).
Construction of Akt Activity Reporter (AktAR)
Each AktAR construct was generated with a fluorescent protein pair sandwiching FHA1 domain and the substrate region. Different variants of cyan and yellow fluorescent proteins, Cerulean, circularly permutated variants of Venus (K156, E172, L194, and A228) (Nagai et al., 2004) and YPet (Nguyen and Daugherty, 2005) were subcloned to the construct to replace corresponding cyan fluorescent protein (CFP) or yellow fluorescent protein (YFP). AktAR-T/A was generated by polymerase chain reaction (PCR). PM(Lyn)-AktAR and AktAR-PM(Kras) were generated by addition of the N-terminal portion of Lyn kinase gene at the 5′ end and CAAX (KKKKKKSKTKCVIM) tag at the 3′ end of AktAR, respectively. All of the constructs were generated in pRSET B, and then they were subcloned to the mammalian expression vector pCDNA 3′.
Cell Transfection and Imaging
NIH 3T3 cells were plated on sterilized glass coverslips in 35-mm dishes, and then they were grown to 40% confluence in DMEM (10% fetal bovine serum) at 37°C with 5% CO2. Cells were transfected with Lipofectamine 2000 (Invitrogen), and then they were serum-starved for 24 h. For imaging, NIH 3T3 cells were washed with Hanks' balanced salt solution buffer and imaged in the dark at room temperature. Images were acquired on an Axiovert 200M microscope (Carl Zeiss, Thornwood, NY) with a cooled charge-coupled device camera, as described previously (Ananthanarayanan et al., 2005). Dual-emission ratio imaging used a 420DF20 excitation filter, a 450DRLP dichroic mirror, and two emission filters. For CFP and YFP, 475DF40 and 535DF25 were used, respectively. Exposure time was 50–500 ms. Images were taken every 20–30 s. Imaging data were analyzed with MetaFluor 6.2 software (Molecular Devices, Sunnyvale, CA). Fluorescence images were background corrected by deducting the background (regions with no cells) from the emission intensities of CFP or YFP. Traces were normalized by taking the emission ratio before addition of drugs as 1.
Sucrose Density Gradient Fractionation
Cells were lysed in 1 ml of 10 mM Tris, pH 7.4, buffer containing 1% Triton X-100, 150 mM NaCl, 5 mM EDTA, 2 mM PMSF, 2 mM NaVO4, 2 mM NaF, and 50 nM Calyculin A, with protease inhibitor cocktail. Cell lysates were incubated in ice with periodic mixing for 1 h, and then they were diluted 1:1 with 85% sucrose and layered by 4 ml of 35% sucrose, followed by additions of 1 ml of 5% sucrose solution and 4.5 ml of 10 mM Tris, pH 7.4, buffer containing 150 mM NaCl and 5 mM EDTA. Ultracentrifugation was performed at 39,000 × g for 18 h in a Beckman SW41-Ti rotor (Beckman Coulter, Fullerton, MA). All experimental steps were performed at 4°C. After ultracentrifugation, the top 3.5-ml sample was discarded. Nine 890-μl fractions were then collected, starting from the top of the gradient.
RESULTS
Development of a Specific Reporter for Tracking Akt Activity in Signaling Microdomains
Lipid rafts seem to play an important role in regulating PDGF- and IGF-1–stimulated Akt activation in that disruption of lipid rafts by cholesterol depletion largely diminished PDGF or IGF-1–stimulated phosphorylation of Akt and its substrate FOXO1 in NIH 3T3 cells (Supplemental Figure 1), which is consistent with previous observations in small cell lung cancer cells (Arcaro et al., 2007) and LNCaP cells (Adam et al., 2007). Investigations into the regulatory mechanisms by which lipid rafts regulate Akt activation will rely on methodologies that allow us to examine dynamic Akt activity in distinct membrane microdomains, such as lipid rafts and nonraft regions of the plasma membrane. To achieve dynamic tracking of Akt activity in these different microdomains in living cells, we turned to genetically encoded and subcellularly targetable kinase activity reporters.
The design of a kinase activity reporter is based on a kinase-dependent molecular switch flanked by a pair of fluorescent proteins, which consists of a substrate domain and a phosphoamino acid binding domain. Phosphorylation of the substrate causes an intramolecular reorganization due to binding of the phospho-substrate by the binding domain, which leads to a change in the distance or orientation between the fluorescence resonance energy transfer (FRET) pair, yielding a change in FRET (Zhang et al., 2001, 2002; Ni et al., 2006). We recently developed B-kinase activity reporter (BKAR) by using this general design (Kunkel et al., 2005). However, the signal amplitude of BKAR is limited despite multiple efforts to try to improve it (data not shown), thus limiting its application in monitoring subtle changes of Akt activity in different plasma membrane microdomains.
We then set out to generate a new Akt activity reporter, AktAR, through systematic testing of different Akt substrates and fluorescent proteins (Ni et al., 2006). A critical step in designing a new kinase activity reporter is to identify a specific phosphorylation substrate for the kinase of interest. This may be achieved by choosing a known sequence from an endogenous substrate or designing a substrate based on consensus sequences. Here, three Akt substrate sequences were tested in the first round of evolution, including a substrate designed from the Akt consensus sequence (RKRDRLGTLGD, the phospho-acceptor threonine is underlined), a sequence based on the Akt phosphorylation site in BAD (PFRGRSRTAPDNLWA), and a substrate derived from the sequence surrounding Thr-24 of FOXO1 (PRPRSCTWPDPRPEF) (Burgering and Kops, 2002; Huang and Tindall, 2007), which is listed among top endogenous Akt substrates by a proteome-wide search (Yaffe et al., 2001). In all three sequences, the +3 amino acid residue with respect to the phosphorylation site was mutated to an aspartate to accommodate binding to the forkhead-associated domain (FHA1) used as the phosphoamino acid binding domain (Durocher et al., 2000). Candidate constructs were generated, with the FRET pair ECFP and Venus flanking the FHA1 domain and the substrate region (Figure 1A). Among the three constructs, only the construct with FOXO1 sequence showed an increase in yellow over cyan emission ratio of ∼4% in serum-starved NIH 3T3 cells upon 50 ng/ml PDGF stimulation.
Figure 1.

Development of AktAR. (A) The first round of AktAR evolution by using three Akt substrate sequences (FOXO, BAD, and the optimal peptide sequence). The response of each construct is indicated as follows: Δ, 1∼5%; ΔΔ, 5∼10%; ΔΔΔ, 10∼20%; ΔΔΔΔ, 20∼30%; ΔΔΔΔΔ, 30∼40%. (B) The second round of AktAR evolution. The FOXO1 sequence was used as the substrate, and FHA1 as the binding partner. Different variants of cyan and yellow fluorescent protein were introduced to replace ECFP and the wild-type Venus. (C) Representative responses of different versions of AktAR in NIH 3T3 cells (n = 3∼8). (D) Pseudocolor images showing AktAR response to 50 ng/ml PDGF in NIH 3T3 cells. Yellow fluorescence image (top left) shows distribution of AktAR.
The FOXO1 sequence was then used in the second round of evolution, which used different variants of cyan and yellow fluorescent proteins, a strategy proven to be effective in improving the dynamic range of FRET-based biosensors (Nagai et al., 2004; Allen and Zhang, 2006). By replacing the N-terminal ECFP with Cerulean, a brighter cyan fluorescent protein, the response was improved from 4 to 12%. Next, four circularly permutated Venus variants, cpV K156, cpV E172, cpV L194, and cpV A228 (Nagai et al., 2004), as well as a new yellow variant, YPet (Nguyen and Daugherty, 2005), were introduced to replace the wild-type Venus (Figure 1B). As shown in Figure 1, B and C, substitution with cpV K156, cpV L194, cpV A228, or YPet did not improve the dynamic range of the reporter, whereas replacing of the wild-type Venus with cpV E172 increased the response to 38 ± 4% (n = 6) (Figure 1, C and D), presumably via changes of the relative orientation of the donor and acceptor fluorophores (Nagai et al., 2004; Allen and Zhang, 2006).
Thus, the most responsive variant from two rounds of evolution, named AktAR, detects endogenous Akt activity with an up to 40% increase in emission ratio in serum-starved NIH 3T3 cells upon 50 ng/ml PDGF stimulation (Figure 2A). Overexpression of Akt1 (Figure 2A) or suppressing phosphatase activities by Calyculin A (Figure 2B) further increased the PDGF-stimulated response of AktAR. Even in unstarved NIH 3T3 cells, AktAR was able to report an increase in endogenous Akt activity above its basal level upon stimulation with PDGF, showing a 17% increase in emission ratio, whereas BKAR had a response of <4% under the same conditions (Figure 2C). The robust signal and great sensitivity of AktAR should facilitate detection of subtle changes in subcellular Akt activity.
Figure 2.
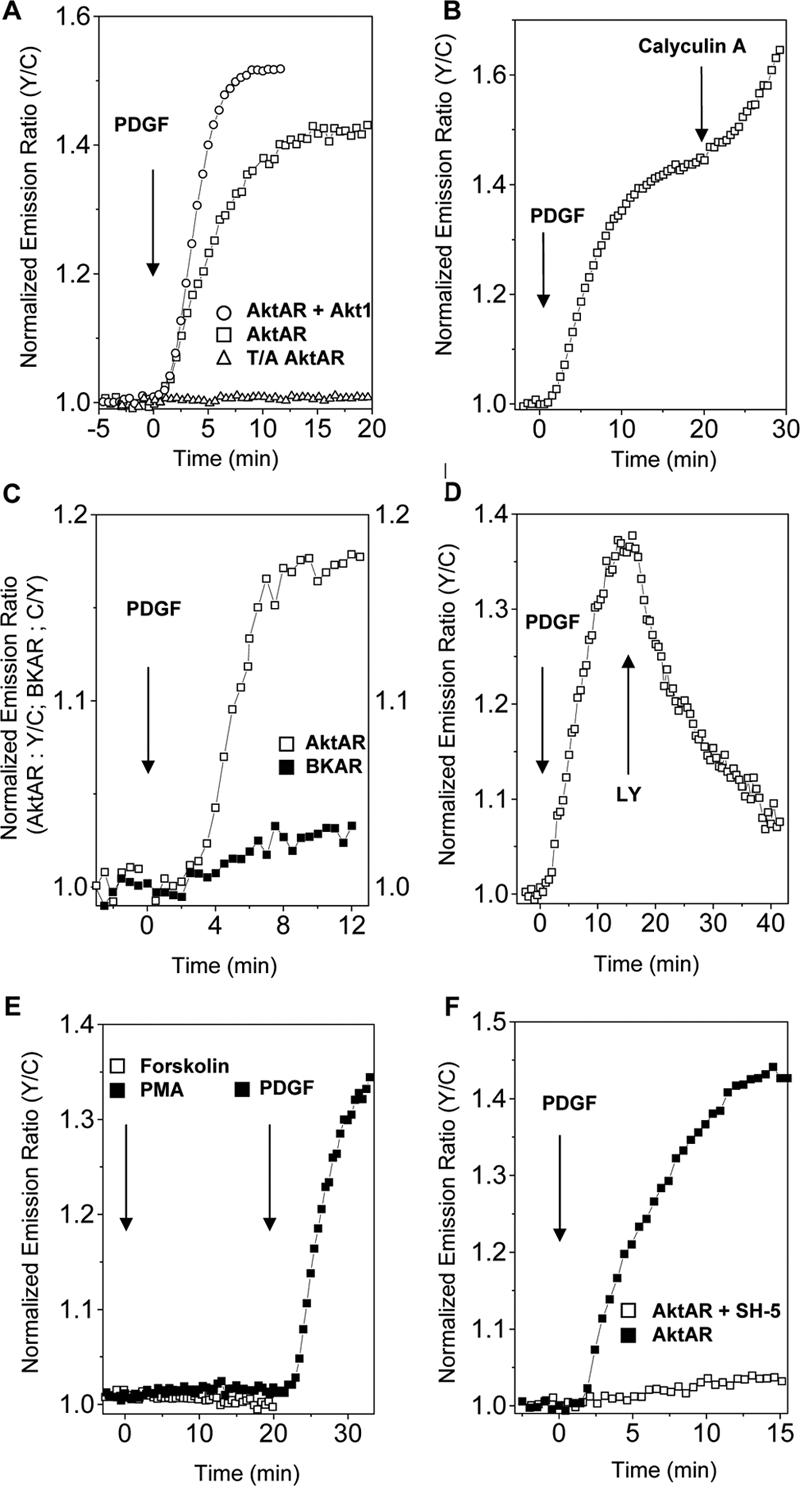
Characterization of AktAR. (A) Representative time courses show the response of overexpressed AktAR in serum-starved NIH 3T3 cells upon 50 ng/ml PDGF stimulation, with (n = 5) or without (n = 7) overexpression of Akt1. Representative response of the AktAR-T/A mutant is also shown (n = 3). (B) A representative time course shows the response of AktAR in serum-starved NIH3T3 cells stimulated by 50 ng/ml PDGF, followed by treatment with 5 nM Calyculin A (n = 2). (C) Representative time courses of AktAR (n = 3) and BKAR (n = 3) in unstarved NIH 3T3 cells stimulated with 50 ng/ml PDGF. (D) Reversibility of AktAR. A representative time course shows the response of AktAR in NIH 3T3 cells stimulated with 50 ng/ml PDGF, followed by 20 μM LY294002 (n = 3). (E) AktAR is insensitive to PKC and PKA activation. NIH3T3 cells were treated with either 50 ng/ml PMA, followed by 50 ng/ml PDGF (n = 4) or 50 μM forskolin (n = 3). (F) Specificity of AktAR. Representative time courses show the response of AktAR in NIH 3T3 cells stimulated with 50 ng/ml PDGF in the absence (n = 4) and presence (n = 5) of 6 μM SH-5.
To determine whether the emission ratio change results from Akt phosphorylation of the designated threonine, an AktAR-T/A mutant, in which the threonine in the substrate sequence was mutated to an alanine, was generated. The mutant failed to respond to 50 ng/ml PDGF stimulation in serum-starved NIH 3T3 cells (Figure 2A), indicating that phosphorylation of the predetermined threonine is responsible for the FRET change in AktAR. To test the reversibility and specificity of AktAR in living cells, AktAR-expressing cells were treated with LY294002, a PI3K inhibitor, after the PDGF-stimulated response stabilized. Addition of LY294002 caused a decrease of FRET ratio (Figure 2D), indicating that the response of AktAR is reversible and dependent on the activation of the PI3K pathway. In addition, activation of two other AGC family kinases, Protein Kinase C (PKC) and Protein Kinase A (PKA), did not induce any signals from AktAR (Figure 2E). AktAR-expressing cells were also preincubated with 6 μM SH-5, a phosphatidylinositol analogue that specifically inhibits Akt. Akt inhibition by SH-5 blocked the 50 ng/ml PDGF-stimulated response (Figure 2F), confirming AktAR is specific for detecting Akt activity.
Akt is Differentially Regulated in Microdomains of Plasma Membrane
The sensitive and dynamic readout as well as genetic targetability of AktAR provided us a unique tool for investigating the role of lipid rafts in regulating Akt activity. The effect of disrupting lipid rafts on Akt activity was first investigated in live cells by using AktAR. As shown in Figure 3A, cholesterol depletion by pretreating cells with 5 mM MβCD (Zidovetzki and Levitan, 2007) for 30 min reduced the PDGF-induced (50 ng/ml) response of AktAR from 40 to 20%. By contrast, the IGF-1–stimulated (400 ng/ml) response was abolished by membrane raft disruption (Figure 3B). These data demonstrate that the integrity of lipid rafts is essential for activation of Akt in NIH 3T3 cells, consistent with the Western analysis (Supplemental Figure 1). Importantly, PDGF- and IGF-1–stimulated Akt activity showed distinct sensitivity to raft disruption.
Figure 3.

Effects of lipid disruption on cellular Akt signaling. (A) Representative time courses show the responses of AktAR in 50 ng/ml PDGF stimulated NIH 3T3 cells with (n = 4) or without (n = 3) preincubation with 5 mM MβCD. (B) Representative time courses show the responses of AktAR in 400 ng/ml IGF-1 stimulated NIH 3T3 cells with (n = 3) or without (n = 5) preincubation with 5 mM MβCD.
To directly measure Akt activity within lipid rafts in real time, as well as distinguish Akt signaling between raft and nonraft regions, we generated two plasma membrane- targeted AktAR constructs. The activities of two functional pools of Akt were separately monitored with PM(Lyn)- AktAR and AktAR-PM(Kras) (Figure 4A). The N-terminal portion of Lyn kinase is known to provide targeting to lipid rafts through myristoylation and palmitoylation, whereas the C-terminal CAAX (C stands for a cysteine, A for aliphatic amino acids, and X for any amino acids) sequence along with a polylysine motif, adapted from K-ras, provides anchoring to the nonraft plasma membrane (Zacharias et al., 2002). To confirm the specific targeting and investigate the effect of MβCD treatment on localization of the two plasma membrane-targeted AktAR, human embryonic kidney (HEK) 293 cells expressing PM(Lyn)-AktAR or AktAR-PM(Kras), with or without preincubation with MβCD, were subjected to sucrose density gradient fractionation. PM(Lyn)-AktAR were found in the lipid raft-containing fractions in untreated samples, and such raft localization was lost after MβCD treatment. In contrast, AktAR-PM(Kras) was distributed in higher density fractions, and this distribution was not affected by preincubation of MβCD (Supplemental Figure 2). These data show PM(Lyn)-AktAR and AktAR-PM(Kras) are targeted to desired membrane microdomains, and MβCD treatment specifically affects raft-associated AktAR. Importantly, activation of PKC and PKA did not induce any signals from PM(Lyn)-AktAR or AktAR-PM(Kras) (Supplemental Figure 3, A and B). The Akt-specific inhibitor SH-5 completely blocked the PDGF-stimulated (50 ng/ml) responses (Supplemental Figure 3, C and D), confirming PM(Lyn)-AktAR and AktAR-PM(Kras) are also specific for detecting Akt activity.
Figure 4.

Akt signaling in different microdomains of plasma membrane. (A) Plasma membrane targeted AktAR, PM(Lyn)-AktAR in which the N-terminal portion of Lyn kinase directs AktAR to lipid rafts, and AktAR-PM(Kras) for monitoring Akt activity in the nonraft regions. (B) NIH 3T3 cells overexpressing either PM(Lyn)- AktAR or AktAR-PM(Kras) with or without MβCD treatment. (C) Representative time courses show the responses of PM(Lyn)-AktAR in 50 ng/ml PDGF-stimulated NIH 3T3 cells with (n = 4) or without (n = 3) preincubation with MβCD. (D) PDGF (50 ng/ml) stimulated nonraft Akt activity is not affected with MβCD treatment shown by representative time courses (n = 3). (E) Representative time courses show the responses of PM(Lyn)-AktAR in 400 ng/ml IGF-1 stimulated NIH 3T3 cells with (n = 3) or without (n = 3) preincubation with MβCD. (F) IGF-1 (400 ng/ml) stimulated nonraft Akt activity is abolished by MβCD treatment shown by representative time courses (n = 3∼5).
These specifically targeted AktAR constructs allowed the investigation of Akt activation in different plasma membrane microdomains in living cells. NIH 3T3 cells were transfected with either PM(Lyn)-AktAR or AktAR-PM(Kras) (Figure 4B), serum starved and stimulated with growth factors. As shown in Figure 4, C and D, PM(Lyn)-AktAR and AktAR-PM(Kras) both had faster kinetics than diffusible AktAR upon 50 ng/ml PDGF stimulation, consistent with previous observations made with BKAR (Kunkel et al., 2005). Notably, both the signal amplitude and kinetics were different for PM(Lyn)-AktAR and AktAR-PM(Kras). PM(Lyn)-AktAR showed a response of 19 ± 1% (n = 3), compared with 16 ± 1% (n = 3) given by AktAR-PM(Kras). The t1/2 value of PM(Lyn)-AktAR (1.4 ± 0.2 min; n = 3) was less than half that of AktAR-PM(Kras) (2.9 ± 0.1 min; n = 3) (Figure 5A), indicating Akt activity is differentially regulated at these two locations. Disruption of membrane rafts by MβCD both diminished the amplitude (14 ± 2%; n = 4) and slowed down the kinetics (t1/2 = 5.1 ± 0.4 min; n = 4) of PM(Lyn)-AktAR. By sharp contrast, the response of AktAR-PM(Kras) was unaffected by treatment with MβCD, with a response of 15 ± 2%, and a t1/2 value of 3.1 ± 0.3 min (n = 3) (Figure 5, A and B). Thus, these data reveal that Akt activity is turned on more rapidly in lipid rafts and that PDGF regulated Akt activity in the nonraft regions is relatively independent of that in the raft regions.
Figure 5.

Statistically significant differences of Akt signaling in plasma membrane microdomains. (A) Statistically significant differences between the responses from Figure 4, C–F. Each response is indicated as following: 1, PM(Lyn)-AktAR, stimulated with PDGF; 2, AktAR-PM(Kras), stimulated with PDGF; 3, PM(Lyn)-AktAR, stimulated with PDGF, preincubated with MβCD; 4, AktAR-PM(Kras), stimulated with PDGF, preincubated with MβCD; 5, PM(Lyn)-AktAR, stimulated with IGF-1; 6, AktAR-PM(Kras), stimulated with IGF-1; 7, PM(Lyn)-AktAR, stimulated with IGF-1, pre-incubated with MβCD; 8, AktAR-PM(Kras), stimulated with IGF-1, preincubated with MβCD. The asterisks show statistically significant difference with an unpaired student's t test (p < 0.05). (B) Statistically significant differences between the t1/2 value of the responses from Figure 4, C–F. The asterisks show statistically significant difference with an unpaired student's t test (p < 0.05).
IGF-1–stimulated Akt activity was studied with the same set of reporters. Shown in Figure 4, E and F, PM(Lyn)-AktAR gave a 20 ± 1% response when stimulated with 400 ng/ml IGF-1, with a t1/2 value of 2.7 ± 0.4 min (n = 3), whereas AktAR-PM(Kras) showed a smaller and slower response (16 ± 3%; t1/2 = 4.2 ± 0.5 min; n = 5) than PM(Lyn)-AktAR (Figure 5, A and B). Disruption of membrane rafts generated a delay in response (t1/2 = 8.9 ± 0.3 min; n = 3) for PM(Lyn)-AktAR (Figure 4E). Interestingly, cholesterol depletion with MβCD abolished IGF-1 (400 ng/ml)-stimulated response of AktAR-PM(Kras) (Figure 4F), indicating Akt signaling in the nonraft regions is dependent on that in the raft regions with IGF-1 stimulation.
Together, these data suggest lipid rafts play a critical role in regulating Akt signaling, demonstrated by a higher maximal activity and faster activation kinetics of raft associated Akt, as well as the requirement of intact lipid rafts for full activation of Akt. Although this is a shared theme between PDGF and IGF-1 stimulated Akt signaling, the roles of lipid rafts are distinct, as illustrated in the model shown in Figure 6. Rafts are essential components for orchestrating IGF-1-stimulated Akt signaling in the plasma membrane, with Akt activity associated with nonraft regions also depending on lipid rafts, whereas in the case of PDGF stimulation there exist two different pools active Akt, which are relatively independent of each other.
Figure 6.

Models for regulation of Akt activity in different plasma membrane microdomains by PDGF and IGF-1. (A) PDGF-stimulated raft and nonraft Akt activities are relatively independent of each other. Raft resident Akt is activated faster and more efficiently than nonraft Akt. Disruption of lipid rafts has minimum effect on the activity of Akt localized within the nonraft regions. (B) In response to IGF-1, Akt is activated mostly through raft associated Akt. Akt signaling in the nonraft regions is highly dependent on that in the raft regions. Disruption of lipid raft results in abolishing total cellular Akt activity.
To examine the upstream signaling events that may contribute to the differential regulation of Akt activity in different microdomains by PDGF and IGF-1, we measured growth factor-stimulated production of 3′ phosphoinositides by using a previously developed phosphoinositide indicator, indicator for 3′ phosphoinositides based on Akt (InPAkt) (Ananthanarayanan et al., 2005). Serum-starved cells expressing InPAkt were stimulated with either 50 ng/ml PDGF or 400 ng/ml IGF-1, with or without preincubation with 5 mM MβCD (Figure 7, A and B). MβCD treatment decreased PDGF-stimulated response of InPAkt from 26 to <10%, showing disruption of lipid rafts diminished the production of the lipid second messengers. Of note, the 5% signal of InPAkt in response to IGF-1 stimulation was abolished upon MβCD treatment. These data suggest the integrity of lipid rafts is critical to maintaining PI(3,4,5)P3 production, and the differential regulation by different growth factors can be seen at the level of changes in cellular phosphoinositides. A key difference between PDGF- and IGF-1–stimulated Akt signaling revealed by AktAR is the dependence of the nonraft-region activity on lipid rafts (Figure 6). Taking advantage of the targetability of InPAkt, we further examined the dependence of phosphoinositide production in this microdomain on lipid rafts. To directly analyze the nonraft-associated phosphoinositide production, InPAkt was targeted to the nonraft regions of plasma membrane with the K-ras anchoring sequence (Ananthanarayanan et al., 2005). Treatment of NIH 3T3 cells expressing InPAkt-Kras with 400 ng/ml IGF-1 did not generate any response. By sharp contrast, a large response of 20% change in emission ratio change was observed when cells were stimulated with 50 ng/ml PDGF (Figure 7C), suggesting PDGF can stimulate phosphoinositide production in the nonraft regions. Cholesterol depletion by MβCD treatment minimally affected this response (Figure 7C), suggesting production of this pool of 3′ phosphoinositides is relatively independent of raft function. The data here show distinct patterns of 3′ phosphoinositide production stimulated by PDGF and IGF-1, which could directly contribute to the differential regulation of Akt activity stimulated by PDGF or IGF-1.
Figure 7.

Compartmentalized 3′ phosphoinositide production. (A) Representative time courses show the response of the phosphoinositide indicator InPAkt in 50 ng/ml PDGF-stimulated NIH3T3 cells, with (n = 5) or without (n = 7) preincubation with MβCD. (B) Representative time courses show the response of InPAkt in 400 ng/ml IGF-1–stimulated NIH 3T3 cells, with (n = 5) or without (n = 6) preincubation with MβCD. (C) Representative time courses show the response of InPAkt-Kras in NIH 3T3 cells stimulated by 400 ng/ml IGF-1 (n = 3) or by 50 ng/ml PDGF with (n = 4) or without (n = 3) preincubation MβCD, suggesting PDGF and IGF-1 regulate PI(3,4,5)P3 production differentially in the nonraft regions.
DISCUSSION
Advantages of AktAR
Fluorescent biosensors that are capable of tracking signaling events in live cells are powerful tools to aid the understanding of dynamic cellular signaling. Here, we present a new genetically encoded FRET sensor for monitoring the spatiotemporal dynamics of Akt activity with high sensitivity. Two Akt activity reporters have been generated before AktAR. The first reporter, Aktus (Sasaki et al., 2003), requires overexpression of Akt for detectable signals, which limits its applicability to study the regulation mechanism of endogenous Akt. The other Akt activity reporter, BKAR (Kunkel et al., 2005), detects endogenous Akt activity and proves useful in revealing subcellular dynamics of endogenous Akt (Kunkel et al., 2005). However, precisely tracking Akt activity in different cell lines and subcellular locations requires a sensitive readout of endogenous Akt activity. AktAR, a new genetically encoded FRET-based Akt activity reporter reported here, has a large dynamic range, detecting endogenous Akt activity, with a 15–40% increase in emission ratio of yellow over cyan in various cell lines such as NIH 3T3, MCF-7, and 3T3 L1 (data not shown). As demonstrated in this study, the ability to monitor subtle changes of Akt activity is instrumental in revealing the different regulatory patterns of Akt signaling within subcellular microdomains. Furthermore, AktAR reports endogenous Akt activity above its basal level upon PDGF stimulation in unstarved NIH 3T3 cells, which will be of great use in studying Akt signaling in cells incompatible with low-serum culture conditions, such as preadipocytes that are in the process of differentiation (Otto and Lane, 2005). Therefore, AktAR should serve as a powerful tool to be applied in different biological systems to reveal molecular mechanisms of Akt signaling. The systematic evolving method presented here for engineering fluorescent biosensors should also be very useful in developing other kinase activity reporters.
Akt Signaling in Different Microdomains of Plasma Membrane
The cholesterol-rich lipid rafts are important signaling microdomains and are known to serve as molecular platforms to spatially compartmentalize specific signaling activities (Simons and Ehehalt, 2002; Hancock, 2003). However, the functions of lipid rafts in pathological processes have not been extensively studied. As an important oncogenic pathway, Akt signaling in plasma membrane microdomains has only recently been examined. Studies in small cell lung cancer cells showed specific PI3K isoforms reside in lipid rafts and that disruption of membrane rafts by MβCD inhibited PI3K-mediated Akt activation. Western analysis failed to detect any Akt population in this cell line from detergent-insoluble membrane fractions, which were thought to be lipid raft enriched (Arcaro et al., 2007). By contrast, both raft- and nonraft-associated Akt were found in LNCaP cells, with most endogenous Akt in the nonraft regions (Adam et al., 2007). As shown in these studies, investigations of lipid raft associated Akt signal transduction pathway have heavily relied on the use of subcellular fractionation method. Here, to maintain the intact cellular context and obtain dynamic information, we applied a live-cell fluorescence imaging approach to study raft-associated Akt activity.
Genetically targeting the Akt reporter to different membrane microdomains enables specific monitoring of the activities of two pools of Akt in plasma membrane, providing the first direct comparison of their kinetics in living cells. As shown in Figure 4, raft Akt is activated faster and more potently than nonraft Akt, presumably due to compartmentalization of various components of the signaling pathway, including the receptors, PI3K and Akt itself. Our method not only maintains the live-cell context but also offers continuous observation of enzymatic reaction progression. Thus, the dynamic visualization achieved by this approach provides real-time tracking of changes in the activities rather than static comparison of Akt activation in these two regions at predetermined time points. Real-time analysis of Akt activity in lipid rafts also revealed three effects of raft disruption—a delay in response to growth factor stimulation, a decelerated increase in amplitude and a decreased maximal activity level. Furthermore, direct comparison of quantitative kinetic profiles uncovered the distinct difference in cholesterol sensitivities of PDGF and IGF-1 signaling pathways. Disruption of lipid rafts does not affect PDGF-stimulated Akt activity in nonraft regions, whereas IGF-1–stimulated Akt activity in the same region is abolished.
Raft integrity is critical for both PDGF- and IGF-1–stimulated Akt activities, but there seem to be distinct differences in raft-dependent regulatory mechanisms via these two pathways. We propose a further refined model (Supplemental Figure 4) to capture some of the differences. In the case of PDGF stimulation, two different pools of 3′ phosphoinositides may be involved in activating distinct pools of Akt, which are relatively independent of each other (Supplemental Figure 4A). IGF-1–stimulated Akt activation, however, shows higher sensitivity to cholesterol depletion due to lack of PI(3,4,5)P3 production in nonraft regions (Figure 7C). In response to IGF-1, membrane Akt may be activated mostly through 3′ phosphoinositides produced in raft regions. As a result, both IGF-1–stimulated phosphoinositide production and Akt activity are highly dependent on lipid rafts (Supplemental Figure 4B). This model will be further tested in future studies. In this context, direct visualization of phosphoinositide production in lipid rafts was attempted but unsuccessful, and modifications of the current phosphoinositide indicator may be required.
Oncogenic Akt and Membrane Microdomains
As a central player for transducing mitogenic, proliferatory, antiapoptotic, and migratory signals, Akt receives signals from various growth factors. For both PDGF- and IGF-1–mediated Akt activation, lipid rafts play a critical role in regulating Akt activities in such a way that the overall Akt activity is raft dependent. Recent data showed elevated levels of lipid rafts in certain types of cancer cells, compared with their normal counterparts (Li et al., 2006). With high efficiency of Akt signaling in lipid rafts, increased abundance of lipid rafts should cause amplification of Akt oncogenic signaling, which should have important functional impact on tumorigenesis. Furthermore, distinct raft dependence of individual receptors may cause different responses to alteration of raft abundance, thus leading to differentially amplified oncogenic signals across plasma membrane.
In the context of drug development, drugs modulating raft levels, such as cholesterol-lowering statins, have been suggested to have potential applications in anticancer therapy, possibly in combination with other modalities (Zhuang et al., 2005; Li et al., 2006). In this context, different cholesterol sensitivities of growth factor signaling pathways may play a role in affecting the drug efficacy in different tissues. Thus, evaluation of the effectiveness and cholesterol sensitivity of different growth factor pathways for activating oncogenic Akt signaling should provide important insight into mechanisms of oncogenesis as well as help developing effective anticancer therapeutics.
In closing, plasma membrane microdomains are important signaling platforms for orchestrating Akt-regulated signaling. Mechanistic investigation into their regulatory roles can greatly benefit from the live-cell activity tracking approach used in this study that maintains the spatial compartmentalization and reveals important dynamic information about Akt signaling.
Supplementary Material
ACKNOWLEDGMENTS
We thank Dr. Peter Devreotes for critical reading of the manuscript, David Zuckerman and Dr. Carolyn Machamer for help with sucrose density gradient fractionation. This work was supported by National Institutes of Health grants R01 DK-073368 and R21 CA-122673), the Young Clinical Scientist Award Program of the Flight Attendant Medical Research Institute, a Scientist Development Award from the American Heart Association, and 3M (to J. Z.).
Abbreviations used:
- AktAR
Akt activity reporter
- BKAR
B kinase activity reporter
- FOXO
forkhead transcription factor O
- FRET
fluorescence resonance energy transfer
- IGF-1
insulin-like growth factor-1
- InPAkt
indicator for 3′ phosphoinositides based on Akt
- MβCD
methyl-β-cyclodextrin
- PDGF
platelet-derived growth factor
- PH domain
pleckstrin homology domain
- PI3K
phosphatidylinositol 3-kinase
- PI(4,5)P2
phosphatidylinositol (4,5)-bisphosphate
- PI(3,4,5)P3
phosphatidylinositol (3,4,5)-triphosphate.
Footnotes
This article was published online ahead of print in MBC in Press (http://www.molbiolcell.org/cgi/doi/10.1091/mbc.E08-05-0449) on August 13, 2008.
REFERENCES
- Adam R. M., Mukhopadhyay N. K., Kim J., Di Vizio D., Cinar B., Boucher K., Solomon K. R., Freeman M. R. Cholesterol sensitivity of endogenous and myristoylated Akt. Cancer Res. 2007;67:6238–6246. doi: 10.1158/0008-5472.CAN-07-0288. [DOI] [PubMed] [Google Scholar]
- Alessi D. R., James S. R., Downes C. P., Holmes A. B., Gaffney P. R., Reese C. B., Cohen P. Characterization of a 3-phosphoinositide-dependent protein kinase which phosphorylates and activates protein kinase Balpha. Curr. Biol. 1997;7:261–269. doi: 10.1016/s0960-9822(06)00122-9. [DOI] [PubMed] [Google Scholar]
- Allen M. D., Zhang J. Subcellular dynamics of protein kinase A activity visualized by FRET-based reporters. Biochem. Biophys. Res. Commun. 2006;348:716–721. doi: 10.1016/j.bbrc.2006.07.136. [DOI] [PubMed] [Google Scholar]
- Ananthanarayanan B., Ni Q., Zhang J. Signal propagation from membrane messengers to nuclear effectors revealed by reporters of phosphoinositide dynamics and Akt activity. Proc. Natl. Acad. Sci. USA. 2005;102:15081–15086. doi: 10.1073/pnas.0502889102. [DOI] [PMC free article] [PubMed] [Google Scholar]
- Arcaro A., Aubert M., Espinosa del Hierro M. E., Khanzada U. K., Angelidou S., Tetley T. D., Bittermann A. G., Frame M. C., Seckl M. J. Critical role for lipid raft-associated Src kinases in activation of PI3K-Akt signalling. Cell Signal. 2007;19:1081–1092. doi: 10.1016/j.cellsig.2006.12.003. [DOI] [PubMed] [Google Scholar]
- Bellacosa A., et al. Molecular alterations of the AKT2 oncogene in ovarian and breast carcinomas. Int. J. Cancer. 1995;64:280–285. doi: 10.1002/ijc.2910640412. [DOI] [PubMed] [Google Scholar]
- Bellacosa A., Testa J. R., Staal S. P., Tsichlis P. N. A retroviral oncogene, akt, encoding a serine-threonine kinase containing an SH2-like region. Science. 1991;254:274–277. doi: 10.1126/science.254.5029.274. [DOI] [PubMed] [Google Scholar]
- Brazil D. P., Hemmings B. A. Ten years of protein kinase B signalling: a hard Akt to follow. Trends Biochem. Sci. 2001;26:657–664. doi: 10.1016/s0968-0004(01)01958-2. [DOI] [PubMed] [Google Scholar]
- Brognard J., Sierecki E., Gao T., Newton A. C. PHLPP and a second isoform, PHLPP2, differentially attenuate the amplitude of Akt signaling by regulating distinct Akt isoforms. Mol. Cell. 2007;25:917–931. doi: 10.1016/j.molcel.2007.02.017. [DOI] [PubMed] [Google Scholar]
- Burgering B. M., Kops G. J. Cell cycle and death control: long live Forkheads. Trends Biochem. Sci. 2002;27:352–360. doi: 10.1016/s0968-0004(02)02113-8. [DOI] [PubMed] [Google Scholar]
- Carpten J. D., et al. A transforming mutation in the pleckstrin homology domain of AKT1 in cancer. Nature. 2007;448:439–444. doi: 10.1038/nature05933. [DOI] [PubMed] [Google Scholar]
- Dahia P. L., Marsh D. J., Zheng Z., Zedenius J., Komminoth P., Frisk T., Wallin G., Parsons R., Longy M., Larsson C., Eng C. Somatic deletions and mutations in the Cowden disease gene, PTEN, in sporadic thyroid tumors. Cancer Res. 1997;57:4710–4713. [PubMed] [Google Scholar]
- Durocher D., Taylor I. A., Sarbassova D., Haire L. F., Westcott S. L., Jackson S. P., Smerdon S. J., Yaffe M. B. The molecular basis of FHA domain:phosphopeptide binding specificity and implications for phospho-dependent signaling mechanisms. Mol. Cell. 2000;6:1169–1182. doi: 10.1016/s1097-2765(00)00114-3. [DOI] [PubMed] [Google Scholar]
- Forgacs E., Biesterveld E. J., Sekido Y., Fong K., Muneer S., Wistuba I. I., Milchgrub S., Brezinschek R., Virmani A., Gazdar A. F., Minna J. D. Mutation analysis of the PTEN/MMAC1 gene in lung cancer. Oncogene. 1998;17:1557–1565. doi: 10.1038/sj.onc.1202070. [DOI] [PubMed] [Google Scholar]
- Frech M., Andjelkovic M., Ingley E., Reddy K. K., Falck J. R., Hemmings B. A. High affinity binding of inositol phosphates and phosphoinositides to the pleckstrin homology domain of RAC/protein kinase B and their influence on kinase activity. J. Biol. Chem. 1997;272:8474–8481. doi: 10.1074/jbc.272.13.8474. [DOI] [PubMed] [Google Scholar]
- Gao T., Furnari F., Newton A. C. PHLPP: a phosphatase that directly dephosphorylates Akt, promotes apoptosis, and suppresses tumor growth. Mol. Cell. 2005;18:13–24. doi: 10.1016/j.molcel.2005.03.008. [DOI] [PubMed] [Google Scholar]
- Hancock J. F. Ras proteins: different signals from different locations. Nat. Rev. Mol. Cell. Biol. 2003;4:373–384. doi: 10.1038/nrm1105. [DOI] [PubMed] [Google Scholar]
- Hanzal-Bayer M. F., Hancock J. F. Lipid rafts and membrane traffic. FEBS Lett. 2007;581:2098–2104. doi: 10.1016/j.febslet.2007.03.019. [DOI] [PubMed] [Google Scholar]
- Huang H., Tindall D. J. Dynamic FoxO transcription factors. J. Cell Sci. 2007;120:2479–2487. doi: 10.1242/jcs.001222. [DOI] [PubMed] [Google Scholar]
- Kunkel M. T., Ni Q., Tsien R. Y., Zhang J., Newton A. C. Spatio-temporal dynamics of protein kinase B/Akt signaling revealed by a genetically encoded fluorescent reporter. J. Biol. Chem. 2005;280:5581–5587. doi: 10.1074/jbc.M411534200. [DOI] [PMC free article] [PubMed] [Google Scholar]
- Li L., Ross A. H. Why is PTEN an important tumor suppressor? J. Cell Biochem. 2007;102:1368–1374. doi: 10.1002/jcb.21593. [DOI] [PubMed] [Google Scholar]
- Li Y. C., Park M. J., Ye S. K., Kim C. W., Kim Y. N. Elevated levels of cholesterol-rich lipid rafts in cancer cells are correlated with apoptosis sensitivity induced by cholesterol-depleting agents. Am. J. Pathol. 2006;168:1107–1118. doi: 10.2353/ajpath.2006.050959. quiz 1404–1105. [DOI] [PMC free article] [PubMed] [Google Scholar]
- Lu Y., et al. The PTEN/MMAC1/TEP tumor suppressor gene decreases cell growth and induces apoptosis and anoikis in breast cancer cells. Oncogene. 1999;18:7034–7045. doi: 10.1038/sj.onc.1203183. [DOI] [PubMed] [Google Scholar]
- Luo J., Manning B. D., Cantley L. C. Targeting the PI3K-Akt pathway in human cancer: rationale and promise. Cancer Cell. 2003;4:257–262. doi: 10.1016/s1535-6108(03)00248-4. [DOI] [PubMed] [Google Scholar]
- Nagai T., Yamada S., Tominaga T., Ichikawa M., Miyawaki A. Expanded dynamic range of fluorescent indicators for Ca(2+) by circularly permuted yellow fluorescent proteins. Proc. Natl. Acad. Sci. USA. 2004;101:10554–10559. doi: 10.1073/pnas.0400417101. [DOI] [PMC free article] [PubMed] [Google Scholar]
- Nakatani K., Thompson D. A., Barthel A., Sakaue H., Liu W., Weigel R. J., Roth R. A. Up-regulation of Akt3 in estrogen receptor-deficient breast cancers and androgen-independent prostate cancer lines. J. Biol. Chem. 1999;274:21528–21532. doi: 10.1074/jbc.274.31.21528. [DOI] [PubMed] [Google Scholar]
- Nguyen A. W., Daugherty P. S. Evolutionary optimization of fluorescent proteins for intracellular FRET. Nat. Biotechnol. 2005;23:355–360. doi: 10.1038/nbt1066. [DOI] [PubMed] [Google Scholar]
- Ni Q., Titov D. V., Zhang J. Analyzing protein kinase dynamics in living cells with FRET reporters. Methods. 2006;40:279–286. doi: 10.1016/j.ymeth.2006.06.013. [DOI] [PubMed] [Google Scholar]
- Otto T. C., Lane M. D. Adipose development: from stem cell to adipocyte. Crit. Rev. Biochem. Mol. Biol. 2005;40:229–242. doi: 10.1080/10409230591008189. [DOI] [PubMed] [Google Scholar]
- Sarbassov D. D., Guertin D. A., Ali S. M., Sabatini D. M. Phosphorylation and regulation of Akt/PKB by the rictor-mTOR complex. Science. 2005;307:1098–1101. doi: 10.1126/science.1106148. [DOI] [PubMed] [Google Scholar]
- Sasaki K., Sato M., Umezawa Y. Fluorescent indicators for Akt/protein kinase B and dynamics of Akt activity visualized in living cells. J. Biol. Chem. 2003;278:30945–30951. doi: 10.1074/jbc.M212167200. [DOI] [PubMed] [Google Scholar]
- Simons K., Ehehalt R. Cholesterol, lipid rafts, and disease. J. Clin. Invest. 2002;110:597–603. doi: 10.1172/JCI16390. [DOI] [PMC free article] [PubMed] [Google Scholar]
- Sun M., et al. AKT1/PKBalpha kinase is frequently elevated in human cancers and its constitutive activation is required for oncogenic transformation in NIH3T3 cells. Am. J. Pathol. 2001;159:431–437. doi: 10.1016/s0002-9440(10)61714-2. [DOI] [PMC free article] [PubMed] [Google Scholar]
- Ugi S., Imamura T., Maegawa H., Egawa K., Yoshizaki T., Shi K., Obata T., Ebina Y., Kashiwagi A., Olefsky J. M. Protein phosphatase 2A negatively regulates insulin's metabolic signaling pathway by inhibiting Akt (protein kinase B) activity in 3T3–L1 adipocytes. Mol. Cell Biol. 2004;24:8778–8789. doi: 10.1128/MCB.24.19.8778-8789.2004. [DOI] [PMC free article] [PubMed] [Google Scholar]
- Vivanco I., Sawyers C. L. The phosphatidylinositol 3-Kinase AKT pathway in human cancer. Nat. Rev. Cancer. 2002;2:489–501. doi: 10.1038/nrc839. [DOI] [PubMed] [Google Scholar]
- Yaffe M. B., Leparc G. G., Lai J., Obata T., Volinia S., Cantley L. C. A motif-based profile scanning approach for genome-wide prediction of signaling pathways. Nat. Biotechnol. 2001;19:348–353. doi: 10.1038/86737. [DOI] [PubMed] [Google Scholar]
- Zacharias D. A., Violin J. D., Newton A. C., Tsien R. Y. Partitioning of lipid-modified monomeric GFPs into membrane microdomains of live cells. Science. 2002;296:913–916. doi: 10.1126/science.1068539. [DOI] [PubMed] [Google Scholar]
- Zhang J., Campbell R. E., Ting A. Y., Tsien R. Y. Creating new fluorescent probes for cell biology. Nat. Rev. Mol. Cell. Biol. 2002;3:906–918. doi: 10.1038/nrm976. [DOI] [PubMed] [Google Scholar]
- Zhang J., Ma Y., Taylor S. S., Tsien R. Y. Genetically encoded reporters of protein kinase A activity reveal impact of substrate tethering. Proc. Natl. Acad. Sci. USA. 2001;98:14997–15002. doi: 10.1073/pnas.211566798. [DOI] [PMC free article] [PubMed] [Google Scholar]
- Zhou X. P., Gimm O., Hampel H., Niemann T., Walker M. J., Eng C. Epigenetic PTEN silencing in malignant melanomas without PTEN mutation. Am. J. Pathol. 2000;157:1123–1128. doi: 10.1016/S0002-9440(10)64627-5. [DOI] [PMC free article] [PubMed] [Google Scholar]
- Zhuang L., Kim J., Adam R. M., Solomon K. R., Freeman M. R. Cholesterol targeting alters lipid raft composition and cell survival in prostate cancer cells and xenografts. J. Clin. Invest. 2005;115:959–968. doi: 10.1172/JCI200519935. [DOI] [PMC free article] [PubMed] [Google Scholar]
- Zidovetzki R., Levitan I. Use of cyclodextrins to manipulate plasma membrane cholesterol content: evidence, misconceptions and control strategies. Biochim. Biophys. Acta. 2007;1768:1311–1324. doi: 10.1016/j.bbamem.2007.03.026. [DOI] [PMC free article] [PubMed] [Google Scholar]
Associated Data
This section collects any data citations, data availability statements, or supplementary materials included in this article.