Abstract
The liver is a complex and unique organ responsible for a breadth of functions crucial to sustaining life, especially for various metabolic processes in its mitochondria. Senescence-accelerated mouse prone/8 (SAMP8), a widely used aging model, exhibits an oxidative stress-induced aging phenotype and severe mitochondria-related liver pathology that are not seen in senescence-accelerated mouse resistant/1 (SAMR1). Here we used both two-dimensional electrophoresis- and ICAT-based mitochondrial proteomics analysis to view the liver mitochondrial protein alterations between SAMP8 and SAMR1. Compared with SAMR1, decreased expression and activity of mitochondrial 3-hydroxy-3-methylglutaryl-CoA synthase were detected in SAMP8 at 6 months old (SAMP8-6m). As the key enzyme of ketogenesis, 3-hydroxy-3-methylglutaryl-CoA synthase is well known to be transcriptionally regulated by peroxisome proliferator-activated receptor α, which was also expressed at lower levels in SAMP8-6m livers. In addition, down-regulation of two peroxisome proliferator-activated receptor α target gene products (acyl-CoA oxidase and enoyl-CoA hydratase), elevation of triglyceride, and reduction of acetyl-CoA were observed, indicating abnormal fatty acid metabolism in SAMP8-6m livers. In addition eight proteins (NDUAA, NDUBA, NDUB7, NDUS1, NDUS3, NDUV1, ETFA, and UCRI) of mitochondrial complexes were down-regulated in SAMP8-6m, resulting in mitochondria-related liver dysfunction characterized by enhanced oxidative stress-induced molecular damage (lipid peroxide and oxidized protein) and depressed energy production (ATP). Glutamine synthetase and ornithine aminotransferase involved in glutamine synthesis were up-regulated in SAMP8 livers at both 1 and 6 months old that may be related to the accumulation of glutamate and glutamine. Our work provided useful clues to understanding the molecular mechanism underlying liver dysfunction in senescence-accelerated mouse.
The liver is regarded as the major organ for a number of physiological presses. As the main energy producers, liver mitochondria are considered to be the central integrators of intermediary metabolism including fatty acid oxidation, the Krebs cycle, oxidative phosphorylation, ketogenesis, and the urea cycle. Furthermore most of the liver disorders have been reported to have increased reactive oxygen species (ROS)1 and decreased ATP as vital characteristics (1, 2), which are both generated through the mitochondrial respiratory chain.
The senescence-accelerated mouse (SAM) model is an aging model obtained by continuous sister-brother breeding from original litters of AKR/J mice (3). SAM includes two strains, i.e. SAM prone (SAMP) and SAM resistant (SAMR). SAMP exhibit a shortened life span and early manifestation of various symptoms of senescence, whereas SAMR are senescence-resistant inbred strains (4). SAMP8, a substrain of SAMP, has become a major biogerontological resource in aging research with SAMR1 as control (5, 6).
Recently Ye et al. (7) have suggested SAMP8 as a valuable animal model for the study of liver diseases because of its phenotype of liver dysfunction. Compared with SAMR1, 5-month-old SAMP8 display hepatic steatosis and reduced fatty acid oxidation (8). The levels of alanine aminotransferase and aspartate aminotransferase were also significantly increased in SAMP8, indicating abnormal liver functions. Oxidative stress, as a crucial component of most liver pathologies (9, 10), was found to be elevated in aged SAMP8 mice livers, supporting the relationship between liver pathologies and free radical damage induced by mitochondrial impairment (11, 12). Although various functional changes have been observed in liver mitochondria of SAMP8, the molecular mechanism of these variations remains unknown.
Mitochondrial proteomics combines classic biochemical fractionation methods and robust mass spectrometry-based proteomics methods, providing insights into the identity and functions of mitochondria (13–16). Here we applied both 2-DE- and ICAT-based mitochondrial proteomics approaches to compare the different expression patterns of liver mitochondrial proteins between SAMP8 and SAMR1 at 1 and 6 months old. We found that most of the down-regulated proteins in SAMP8 were related to fatty acid metabolism, the tricarboxylic acid cycle, and oxidative phosphorylation, whereas the up-regulated proteins were mainly involved in glutamine synthesis. Consistent with the protein alteration, we also found that triglyceride (TG), glutamine, oxidative protein, and lipid peroxide concentrations were increased in 6-month-old SAMP8 livers, whereas acetyl-CoA and ATP content were decreased. Our results provided useful information to understanding the early stage of liver dysfunction in senescence-accelerated mouse at the proteome level.
MATERIALS AND METHODS
Isolation of Livers—
Male SAMP8 at 1 month old (SAMP8-1m), SAMP8 at 6 months old (SAMP8-6m), SAMR1 at 1 month old (SAMR1-1m), and SAMR1 at 6 months old (SAMR1-6m) (obtained from the Institute of Genetics and Developmental Biology of the Chinese Academy of Sciences) were housed under specific pathogen-free conditions at a temperature of 25 ± 1.5 °C with 12:12-h light-dark cycles with full access to water and food. Animals were anesthetized intraperitoneally with 10% (w/v) chloral hydrate and perfused with a 0.9% (w/v) normal saline buffer. After sacrifice, liver tissues were removed and homogenized immediately for the following procedures.
Preparation of Liver Mitochondria—
Mitochondria were isolated by subcellular fractionation from fresh livers as described previously (17) with some modifications. Briefly minced livers were homogenized with 5 volumes of ice-cold homogenization buffer (0.25 m sucrose, 10 mm HEPES, 1 mm PMSF, pH 7.5) using a loose fitting Dounce homogenizer. After filtering through four layers of nylon gauze, the homogenate was centrifuged at 800 × g for 10 min, and then the supernatant was centrifuged at 15,000 × g for 20 min in a Himac CR21 centrifuge. The suspension of the resulting pellet was layered over a discontinuous sucrose gradient consisting of 1.0 m sucrose on top of 1.5 m sucrose and centrifuged for 60 min at 24,000 rpm in a Beckman Optima™ L-80 XP ultracentrifuge. The mitochondria collected from the interface between 1.0 and 1.5 m sucrose were resuspended in homogenization buffer, centrifuged at 14,500 × g, and stored in aliquots at −80 °C.
Western Blotting—
Western blotting was performed essentially as described previously (18). Antibodies used in this study include: anti-ornithine aminotransferase generously provided by Dr. Olivier Levillain (Universite Claude Bernard Lyon 1) (19), anti-Oxphos complex I 39-kDa subunit from Molecular Probes (Eugene, OR), and anti-glutamine synthetase and anti-peroxisome proliferator-activated receptor α (PPARα) from Abcam (Cambridge, UK).
Electron Microscopy—
Equal volumes of sample and 5% glutaraldehyde in PBS were mixed, incubated overnight at 4 °C, and centrifuged. The resulting pellets were postfixed in OsO4, dehydrated through a graded series of ethanol and acetone, and embedded in Epon. Then thin sections were stained with uranyl acetate and lead citrate and observed under a transmission electron microscope (JEM-100CX, Jeol, Tokyo, Japan).
Two-dimensional Gel Electrophoresis and MALDI-TOF/TOF MS—
Mitochondria were solubilized in a lysis buffer consisting of 7 m urea, 2 m thiourea, 65 mm DTT, 4% CHAPS. After determining protein concentration using a 2-D Quant kit (GE Healthcare), 450-μl samples containing 800 μg of proteins were loaded onto nonlinear IPG strips (24 cm, pH 3–10 nonlinear, GE Healthcare). IEF was conducted according to the following procedure: 30 V × 8 h, 50 V × 4 h, 300 V × 1 h, 1000 V × 1 h, 3000 V × 1 h, 5000 V × 1 h, and 8000 V for a total of 10,000 V-h. The second dimension was performed in 12.5% SDS-polyacrylamide gels that were then stained by Coomassie Brilliant Blue R-250 and scanned at 300-dpi resolution. Protein spots were analyzed with ImageMaster Platinum™ software (GE Healthcare) according to the manufacturer’s procedures. Proteins altered over 1.5-fold were considered to be significantly changed (p < 0.01 by Mann-Whitney test). The differentially expressed proteins were cut and digested essentially as described by Yang et al. (20).
MALDI samples were prepared according to a thin layer method as described before (20, 21). Mass spectra were recorded on an Ultraflex MALDI-TOF/TOF mass spectrometer (Bruker Daltonik GmbH) under the control of FlexControl™ 2.2 software (Bruker Daltonik GmbH). MALDI-TOF spectra were recorded in the positive ion reflector mode in a mass range from 800–4000 Da, and the ion acceleration voltage was 25 kV. After analysis of the TOF results by FlexAnalysis™ 2.2 (Bruker Daltonik GmbH), the proteins were subjected to TOF-TOF analysis in “LIFT” mode. Some of the strongest peaks of each TOF spectra were selected as precursor ions that were accelerated in TOF1 at a voltage of 8 kV and fragmented by lifting the voltage to 19 kV. Both the MALDI-TOF spectra and the MS/MS spectra were processed by FlexAnalysis 2.2 and Biotool™ 2.2 and automatically searched against the Swiss-Prot database (version 54.0) using Mascot 2.1.0 (Matrix Science, London, UK). The main parameters were set as follows: S/N ≥ 3.0; fixed modification, carbamidomethyl (Cys); variable modification, oxidation (Met); maximum number of missing cleavages, 1; MS tolerance, ±100 ppm; and MS/MS tolerance, ±0.7 Da.
ICAT Labeling—
One hundred and fifty micrograms of proteins from each sample were labeled with the acid-cleavable ICAT reagents, either the isotopically light or heavy forms (Applied Biosystems, Foster City, CA). The ICAT labeling was performed according to the manufacturer’s procedures. Samples from six SAMP8 mice at 1 month old were labeled with the heavy reagent, six SAMR1 mice at 1 month old were labeled with the light reagent (forward labeling), and then a reverse labeling with samples obtained from an independent experiment was also performed to avoid variability of the labeling procedure. The same labeling methods were applied to samples from SAMP8 and SAMR1 mice at 6 months old.
Nano-LC-FTICR-MS—
The ICAT-labeled peptides were dissolved in 0.1% formic acid and then separated by a nano-LC system (Micro-Tech Scientific, Vista, CA) that was equipped with a strong cation exchange column and a C18 reverse phase column. The salt steps were 5, 10, 20, 50, 100, and 500 mm NH4Cl, each of which was followed by a 120-min reverse phase gradient from 0 to 50% acetonitrile in 0.1% formic acid at a constant flow rate of 400 nl/min. Mass spectra were recorded on a 7-tesla FTICR mass spectrometer, Apex-Qe (Bruker Daltonics, Bremen, Germany). Data were acquired in data-dependent mode using ApexControl 1.0 software (Bruker Daltonics). The strongest peak of each MS acquisition was selected for the following MS/MS analysis. The MS/MS spectra were processed by DataAnalysis 3.4 (Bruker Daltonics) with S/N ≥4.0 and automatically searched against the Swiss-Prot database (version 54.0) using Mascot 2.1.0 (Matrix Science). Mass tolerances for MS and MS/MS were 30 ppm and 0.03 Da, respectively, and variable modifications were specified as ICAT_heavy and ICAT_light. The instrument setting for the Mascot search was selected as “ESI-FTICR.” Finally the ratio of the detected peptide pairs was obtained by calculating their extracted ion chromatograms with WarpLC 1.1 software and Biotool 3.1 (Bruker Daltonics). Furthermore only precursor ions with peak intensity ≥105 and S/N ≥20 were accepted for quantitation.
Quantitative Real Time PCR—
Primers are listed in Table III. The reverse transcription was performed on 2 μg of total RNA with SuperScript III Reverse Transcriptase (Invitrogen). Quantitative real time PCR was performed using the SYBR Green PCR kit (Applied Biosystems) in a DNA Engine Opticon-Continuous Fluorescence Detection System (MJ Research) with parameters as follows: initiation with a 10-min denaturation at 95 °C followed by 40 cycles of amplification with 10-s denaturation at 94 °C, 20-s annealing of the primer pair at 58 °C, 30-s extension at 72 °C, and reading the plate for fluorescence data collection at 78–80 °C. After a final extension at 72 °C for 5–10 min, a melting curve was performed from 65 to 95 °C (1-s hold/0.2 °C increase) to check the specificity of the amplified product. Mouse β-actin was used as an internal control in parallel reactions with primers. All samples were analyzed in triplicates using independent RNA samples.
Table III.
mRNA expression levels of some changed proteins detected by real time PCR
| Swiss-Prot ID | Gene name | GenBank™ accession no. | Primer sequence sense (+), antisense (−) | Size | Ratio
|
|
|---|---|---|---|---|---|---|
| 1ma | 6mb | |||||
| bp | ||||||
| ODO2 | Dlst | BC006702 | (+) 5′-CCT CCT TCT AGC AAA CCA GTG T-3′, (−) 5′-CAT CCT GTT CAT TTT CTC CCG-3′ | 114 | 0.75 | 0.75 |
| ETFA | Etfa | BC096645.1 | (+) 5′-GCT GTT GAT GCT GGC TTT G-3′, (−) 5′-AAT TGG AGC TTC TGG ATC TTT G-3′ | 171 | 0.82 | 0.66 |
| NDUAA | Ndufa10 | BC003439.1 | (+) 5′-AGG ACG ACT GGA CCT TTC AC-3′, (−) 5′-TCA CCC ACC TCG GCA TT-3′ | 190 | 0.8 | 0.63 |
| NDUBA | Ndufb10 | BC043013.1 | (+) 5′-AGA CCT CGC TCC CTA ACC C-3′, (−) 5′-CAC AGA ACA TCA CCC TCT TTG C-3′ | 184 | 0.96 | 0.67 |
| NDUS3 | Ndufs3 | BC119269.1 | (+) 5′-CCC CTC ACT GGC TAT GTT GA-3′, (−) 5′-GGT TTC AGG CTT CTT GTC TCC-3′ | 183 | 0.75 | 0.64 |
| UCRI | Uqcrfs1 | BC019934.1 | (+) 5′-CCG TCC TAT CGG CCA CTT-3′, (−) 5′-GGG CAC CTT GAC ATC TGT ATG-3′ | 221 | 0.79 | 0.43 |
| OAT | Oat | BC008119 | (+) 5′-AAG CAG GCG TTA TCG TTC C-3′, (−) 5′-ATC CAC AGC CAG CCA TCT AC-3′ | 134 | 1.69 | 2.68 |
| HMCS2 | Hmgcs2 | BC024744 | (+) 5′-GAA ATC CCT GGC TCG GTT-3′, (−) 5′-CCT TGT CTA CAT CCT TGT TGG T-3′ | 137 | 1.04 | 0.63 |
| PPARα | Ppara | BC016892 | (+) 5′-ATT TGC CAA GGC TAT CCC A-3′, (−) 5′-GCA TCC CGT CTT TGT TCA TC-3′ | 125 | 0.97 | 0.52 |
mRNA expression ratios of SAMP8/SAMR1 at 1 month old.
mRNA expression ratios of SAMP8/SAMR1 at 6 months old.
Assay of 3-Hydroxy-3-methylglutaryl (HMG)-CoA Synthase Activity—
HMG-CoA synthase activity was assayed as described by Quant et al. (22). Briefly 0.2 g of livers was homogenized in 1 ml of homogenization buffer (0.25 m sucrose, 10 mm HEPES, 1 mm PMSF, pH 7.5), then 100 μl of homogenates were treated with 5 μl of 20% Triton X-100, and 5-μl samples were assayed immediately. The 1-ml assay system contained 50 mm Tris/HCl, pH 8.0, 10 mm MgCl2, 0.2 mm DTT at 30 °C; 5 mm acetyl phosphate, 10 μm acetoacetyl-CoA, and 5-μl samples were added followed by addition of 10 units of phosphotransacetylase and 100 μm acetyl-CoA. HMG-CoA synthase activity was measured as the difference in the rate before and after addition of acetyl-CoA. A unit of enzyme activity is defined as 1 μmol of acetoacetyl-CoA formed/min.
Glutamine Synthetase Activity and Glutamine Assays—
Glutamine synthetase activity was assayed by measuring the rate of formation of γ-glutamyl hydroxamate as described previously (23). By definition, 1 unit of enzyme activity causes 1 μmol of γ-glutamyl hydroxamate formed/min. Glutamine concentration was determined with a glutamine/glutamate determination kit (Sigma-Aldrich) following the manufacturer’s instructions.
Detection of the Concentration of Protein Carbonyl and Lipid Peroxide—
The level of protein carbonyl was determined according to the method of Oliver et al. (24). Carbonyl groups in oxidized proteins were derivatized to 2,4-dinitrophenylhydrazone, and then absorption at 360 nm was measured. Lipid peroxide in liver was measured by the thiobarbituric acid reaction as described previously (25).
Triglyceride, Acetyl-CoA, and ATP Determination—
Triglyceride, acetyl-CoA, and ATP in liver homogenates were measured as described by Roglans et al. (26), Baltazar et al. (27), and Yu et al. (28), respectively.
RESULTS
Evaluation of the Isolated Mitochondria—
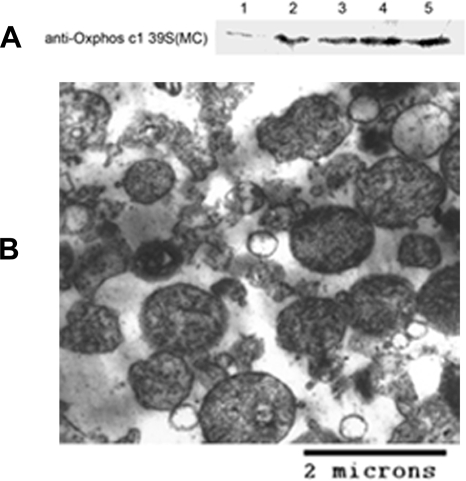
The purity of the mitochondria was examined by Western blotting. We compared the liver homogenates with the isolated mitochondria using antibodies against Oxphos complex I 39-kDa subunit. As a result, the mitochondria-specific protein was enriched about 7-fold in the mitochondria fraction (Fig. 1A). The mitochondria fraction was also morphologically evaluated by electron microscopy. As can be seen in Fig. 1B, the predominant structures in this fraction were mitochondria.
Fig. 1.
Evaluation of mitochondria fraction. A, Western blotting analysis of mitochondria enrichment. 15 μg of the liver homogenate and mitochondria proteins were separated by 12.5% SDS-PAGE and transferred to PVDF membranes. The blots were probed with an antibody against a mitochondria protein, Oxphos complex I 39-kDa subunit. 1 represents liver homogenate; 2, 3, 4, and 5 represent mitochondria fractions from SAMR1-1m, SAMP8-1m, SAMR1-6m, and SAMP8-6m, respectively. B, electron micrograph of isolated mitochondria from SAMP8-6m. Thin sections were stained with uranyl acetate and lead citrate. Scale bar, 2 μm.
2-DE-based Proteomics Analysis—
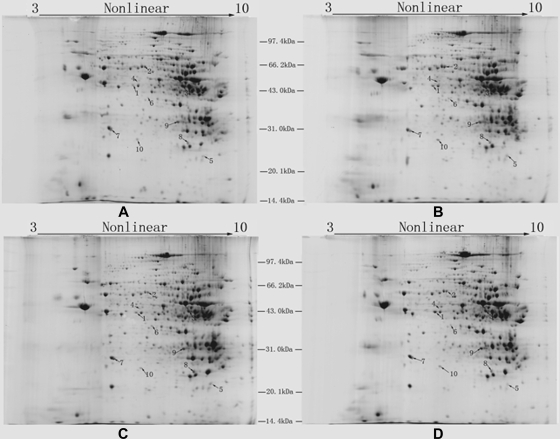
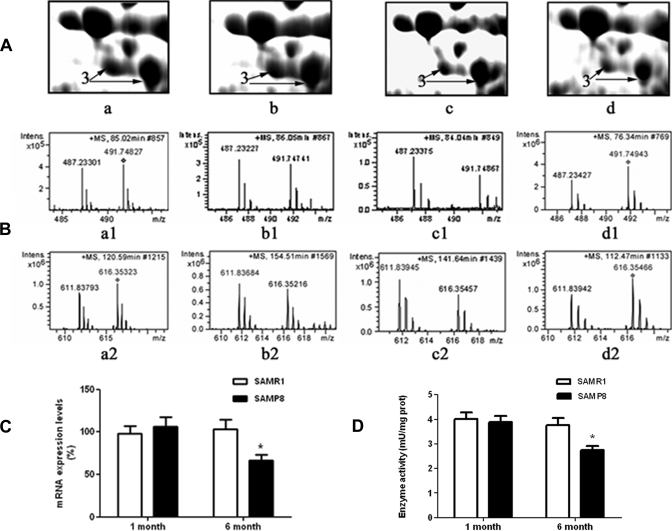
The proteins of mouse liver mitochondria were separated by 2-DE. Four representative 2-D gel images (Fig. 2) were divided into two groups, i.e. a 1-month group (Fig. 2, A and B) and a 6-month group (Fig. 2, C and D). Comparisons among these images resulted in the detection of 10 differentially expressed proteins between SAMP8 and SAMR1 in each group that were further analyzed by MALDI-TOF MS and MALDI-TOF/TOF MS after tryptic in-gel digestion. The combined peptide mass fingerprint and LIFT MS/MS spectra were searched against the Swiss-Prot database using a Mascot engine (MALDI-TOF/TOF mass spectra of peptides from the changed proteins are shown in supplemental Fig. S1, and the detailed information of Mascot search results is listed in supplemental Table S1). Table I lists the identified protein IDs together with their spot numbers, molecular weights and pI values, amount of peptides, -fold changes, subcellular locations, and functions. The higher magnification images of one protein, HMG-CoA synthase, are shown in Fig. 5A.
Fig. 2.
Images of Coomassie Blue R-250-stained 2-D gels. A, B, C, and D represent gels of SAMR1-1m, SAMP8-1m, SAMR1-6m, and SAMP8-6m, respectively. 800 μg of mitochondrial proteins from SAMR1-1m (A), SAMP8-1m (B), SAMR1-6m (C), and SAMP8-6m (D) were separated on pH 3–10 nonlinear IPG strips and then on 12.5% SDS-polyacrylamide gels. Differentially expressed proteins identified in the present work are annotated on the gels (spots 1–10).
Table I.
Changed proteins identified by MALDI-TOF/TOF MS/MS from 2-D gels
The spectrum for each peptide is illustrated in supplemental Fig. S1.
| No.a | Swiss-Prot ID | Protein name | Molecular weight/pI | Scoreb | Pep.c | Ratio
|
Loc.f | Function | |
|---|---|---|---|---|---|---|---|---|---|
| 1md | 6me | ||||||||
| 1 | OAT_MOUSE | Ornithine aminotransferase | 48,723/6.19 | 336 | 4 | 1.56 | 2.72 | MC | Transaminase |
| 2 | HACL1_MOUSE | 2-Hydroxyacyl-CoA lyase 1 | 64,588/5.89 | 532 | 4 | 1.23 | 0.68 | Pero | Lipid metabolism |
| 3 | HMCS2_MOUSE | HMG-CoA synthase | 57,300/8.65 | 115 | 1 | 1.1 | 0.63 | MC | Ketone body biosynthesis |
| 4 | ODO2_MOUSE | Dihydrolipoamide succinyltransferase | 49,306/9.11 | 194 | 2 | 0.96 | 0.45 | MC | Tricarboxylic acid cycle |
| 5 | NDUBA_MOUSE | NADH-ubiquinone oxidoreductase PDSW subunit | 21,296/8.19 | 342 | 3 | 1.06 | 0.62 | MC | Respiratory chain |
| 6 | NDUAA_MOUSE | NADH-ubiquinone oxidoreductase 42-kDa subunit | 40,863/7.63 | 338 | 4 | 0.93 | 0.48 | MC | Respiratory chain |
| 7 | NDUS3_MOUSE | NADH-ubiquinone oxidoreductase 30-kDa subunit | 30,302/6.67 | 530 | 6 | 0.89 | 0.5 | MC | Respiratory chain |
| 8 | UCRI_MOUSE | Ubiquinol-cytochrome c reductase iron-sulfur subunit | 29,634/8.91 | 196 | 2 | 0.9 | 0.67 | MC | Respiratory chain |
| 9 | ETFA_MOUSE | Electron transfer flavoprotein subunit α | 35,330/8.62 | 404 | 3 | 1.05 | 0.61 | MC | Respiratory chain |
| 10 | PRDX3_MOUSE | Thioredoxin-dependent peroxide reductase | 28,337/7.15 | 155 | 2 | 1.43 | 1.85 | MC | Oxidative damage protection |
Protein numbers on the 2-D gel (see Fig. 2).
Molecular weight search (MOWSE) scores obtained by the combined search (peptide mass fingerprint and LIFT data) using Mascot engine.
Numbers of peptides identified by MALDI-TOF/TOF MS/MS using the Ultraflex instrument in LIFT mode.
Protein expression ratios of SAMP8/SAMR1 at 1 month old.
Protein expression ratios of SAMP8/SAMR1 at 6 months old.
Protein subcellular locations. MC represents mitochondria, and Pero represents peroxisome.
Fig. 5.
Alteration of HMG-CoA synthase. A, the differential expression pattern of HMG-CoA synthase on 2-D gels in SAMR1-1m (a), SAMP8-1m (b), SAMR1-6m (c), and SAMP8-6m (d).The protein is indicated by arrows on each gel. B, the MS spectra of two peptides from HMG-CoA synthase in the orthogonal experiments. a1 and a2 represent peptides from SAMR1-1m and SAMP8-1m labeled with the light chain and the heavy chain, respectively (forward labeling of the 1-month group); b1 and b2 represent peptides from the reverse labeling of the 1-month group; c1 and c2 represent peptides from SAMR1-6m and SAMP8-6m labeled with the light chain and the heavy chain (forward labeling of the 6-month group), respectively; and d1 and d2 represent peptides from the reverse labeling of the 6-month group. C, alteration at the transcription levels of HMG-CoA synthase. Error bars indicate S.E. from three independent experiments; *, p < 0.05. D, activity of HMG-CoA synthase in liver homogenates. Error bars indicate S.E. from five independent experiments; *, p < 0.05. Intens., intensity.
ICAT-based Proteomics Analysis—
ICAT technology was applied to quantitatively assess the overall protein expression ratios between SAMP8 and SAMR1. Both forward and reverse labeling experiments were applied to samples from SAMR1 and SAMP8 at each month. The MS spectra were searched against Mascot 2.1.0 with mass accuracies of 30 ppm for the parent ion and 0.03 Da for fragment ions. The ion cutoff score for accepting individual MS/MS spectra was 14, resulting in a false-positive rate of 1% as evaluated by a composite target/decoy Swiss-Prot database. One hundred and forty-eight proteins were identified from SAMR1-1m and SAMP8-1m in both forward and reverse labeling experiments (see supplemental Table S2), and 166 proteins were identified from the 6-month group (see supplemental Table S3). 51% (99 of 196) of these proteins were located to mitochondria (see supplemental Table S4).
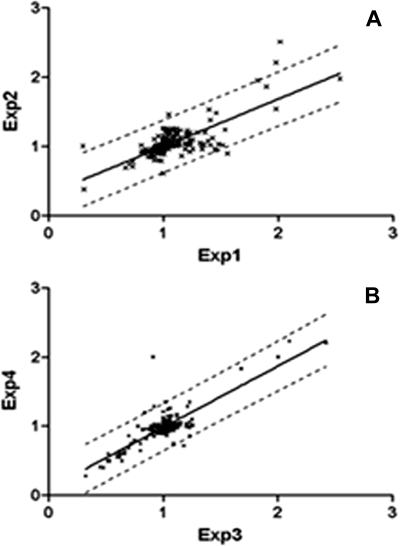
A linear regression analysis of the SAMP8/SAMR1 ratios from experiment 1 (SAMR1 labeled with the light chain) and experiment 2 (SAMP8 labeled with the light chain) was conducted (Fig. 3). The Pearson correlation coefficient was 0.75 in the 1-month group and 0.83 in the 6-month group with p value <0.0001.
Fig. 3.
Scatter plots obtained from orthogonal labeling in 1-month-old mice (A) and 6-month-old mice (B). The SAMP8/SAMR1 ratio of each identified protein from Experiment 1 (Exp1) or Experiment 3 (Exp3) (SAMR1 labeled with the light chain) is plotted on the x axis, and that from Experiment 2 (Exp2) or Experiment 4 (Exp4) (SAMP8 labeled with the light chain) is plotted on the y axis. The dashed line indicates a linear regression with 95% confidence.
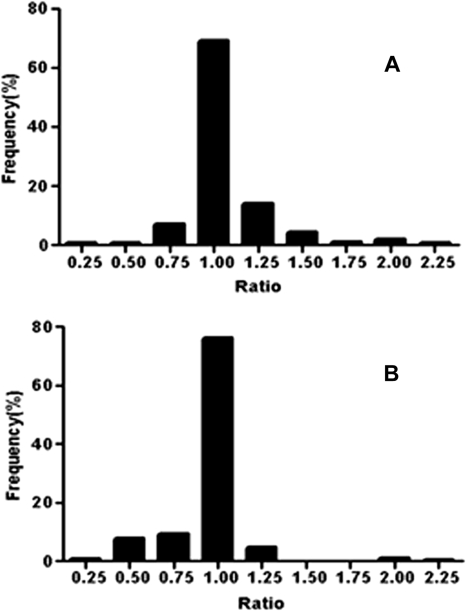
The variation in the SAMP8/SAMR1 ratios is displayed in Fig. 4. Proteins were categorized into different bins according to their ratio with 0.125 unit/bin. More than 90% of the proteins had expression ratios between 0.7 and 1.45 in both 1- and 6-month groups. Therefore, 13 proteins with a ratio of ≥1.5 or ≤0.67 were considered to be significantly changed (Table II; the spectrum for each peptide is illustrated in supplemental Fig. S2) wherein HMG-CoA synthase and ornithine aminotransferase were also identified from 2-D gels. The MS spectra of two ICAT-labeled peptides from HMG-CoA synthase are shown in Fig. 5B.
Fig. 4.
Variation of identified ICAT-labeled peptides versus SAMP8/SAMR1 ratio in 1-month-old mice (A) and 6-month-old mice (B).
Table II.
Changed proteins identified by ESI-FTICR-MS
The spectrum for each ICAT-labeled peptide is illustrated in supplemental Fig. S2. Changed proteins that were identified by both MALDI-TOF MS/MS and FT-MS are bold.
| No. | Swiss-Prot ID | Protein name | Molecular weight | Scorea | Pep.b | Ratio
|
Loc.e | Function | |
|---|---|---|---|---|---|---|---|---|---|
| 1mc | 6md | ||||||||
| 1 | OAT_MOUSE | Ornithine aminotransferase | 48,324 | 14 | 1 | 1.55 | 2.3 | MC | Transaminase |
| 2 | GLNA_MOUSE | Glutamine synthetase | 42,092 | 100 | 2 | 1.82 | 2.1 | MC | Glutamine biosynthesis |
| 3 | AL4A1_MOUSE | Δ1-Pyrroline-5-carboxylate dehydrogenase | 61,772 | 38 | 2 | 1.5 | 1.03 | MC | l-Glutamate biosynthesis |
| 4 | URIC_MOUSE | Uricase | 35,017 | 65 | 2 | 0.88 | 0.43 | MC | Oxidation of uric acid |
| 5 | ACOX1_MOUSE | Acyl-coenzyme A oxidase 1 | 74,587 | 146 | 3 | 1.02 | 0.64 | MC and Pero | Lipid oxidation |
| 6 | ECHP_MOUSE | Enoyl-CoA hydratase | 78,194 | 132 | 4 | 1.05 | 0.57 | MC and Pero | Lipid oxidation |
| 7 | HMCS2_MOUSE | HMG-CoA synthase | 56,786 | 109 | 3 | 1.15 | 0.65 | MC | Ketone body biosynthesis |
| 8 | NDUS1_MOUSE | NADH-ubiquinone oxidoreductase 75-kDa subunit | 79,698 | 39 | 1 | 0.72 | 0.5 | MC | Respiratory chain |
| 9 | NDUB7_MOUSE | NADH-ubiquinone oxidoreductase B18 subunit | 16,320 | 62 | 1 | 0.95 | 0.63 | MC | Respiratory chain |
| 10 | NDUV1_MOUSE | NADH-ubiquinone oxidoreductase 51-kDa subunit | 50,802 | 50 | 2 | 0.89 | 0.62 | MC | Respiratory chain |
| 11 | BHMT1_MOUSE | Betaine-homocysteine S-methyltransferase 1 | 44,992 | 236 | 4 | 2.2 | 1.05 | Cyto | Methionine biosynthesis |
| 12 | CAH3_MOUSE | Carbonic anhydrase 3 | 29,348 | 21 | 1 | 0.31 | 0.32 | Cyto | Hydration of carbon dioxide |
| 13 | HYEP_MOUSE | Epoxide hydrolase 1 | 52,542 | 53 | 1 | 1.0 | 0.58 | ER | Epoxide hydrolase |
Molecular weight search (MOWSE) scores obtained by the search of MS/MS data using Mascot engine.
Numbers of peptides identified by FT-MS.
Protein expression ratios of SAMP8/SAMR1 at 1 month old.
Protein expression ratios of SAMP8/SAMR1 at 6 months old.
Protein subcellular locations. MC represents mitochondria, Pero represents peroxisome, Cyto represents cytoplasm, and ER represents endoplasmic reticulum.
Quantitative Real Time RT-PCR—
Eight altered proteins were selected to analyze their mRNA expression differences. The mRNA expression variations were in excellent agreement with the changing patterns of proteins (Table III). As an example, Fig. 5C shows the change of mRNA expression of HMG-CoA synthase.
HMG-CoA Synthase Activity—
The activity of HMG-CoA synthase in liver homogenates was measured. For this enzyme activity, there was not a significant difference between SAMR1-1m and SAMP8-1m. However, compared with SAMR1-6m, the HMG-CoA synthase activity in SAMP8-6m was reduced about 33.3% (p < 0.05) (Fig. 5D).
Expression Levels of PPARα—
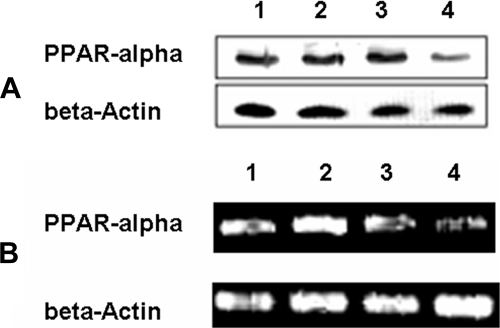
It is well known that transcription activation of HMG-CoA synthase is mainly influenced by PPARα. Therefore, we analyzed the expression levels of PPARα. Western blotting analysis showed that PPARα was clearly down-regulated in SAMP8-6m livers compared with SAMR1-6m, whereas the expression levels of the protein were almost identical in 1-month-old mice livers (Fig. 6A). A similar expression pattern of PPARα at the level of mRNA was also found (Fig. 6B).
Fig. 6.
Analysis of PPARα. A, Western blotting analysis of PPARα. 1, 2, 3, and 4 represent liver homogenates from SAMR1-1m, SAMP8-1m, SAMR1-6m, and SAMP8-6m, respectively. B, mRNA levels of PPARα. 1, 2, 3, and 4 represent mRNA from livers of SAMR1-1m, SAMP8-1m, SAMR1-6m, and SAMP8-6m, respectively.
Assays of Glutamine Synthetase and Ornithine Aminotransferase—
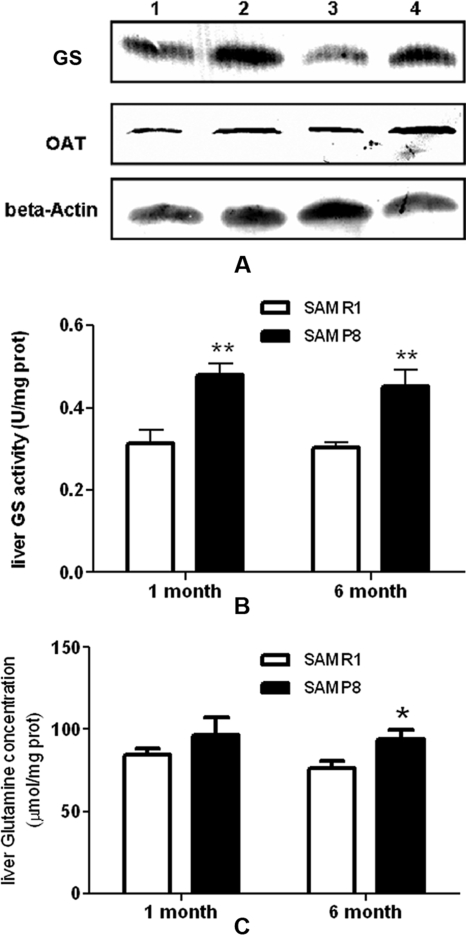
Glutamine synthetase and ornithine aminotransferase, which are related to glutamine synthesis, were identified as up-regulated proteins in SAMP8 using proteomics approaches. This was further verified by Western blotting analysis. Consistent with the proteomics results, both of these proteins were clearly more abundant in SAMP8 liver homogenates (Fig. 7A). In addition, the activity of glutamine synthetase was measured, and it was significantly increased in livers of both SAMP8-1m and SAMP8-6m (Fig. 7B). The liver glutamine concentration was also determined. As shown in Fig. 7C, glutamine concentration was slightly increased in SAMP8 but only statistically significant in 6-month-old SAMP8.
Fig. 7.
Assays of glutamine synthetase and ornithine aminotransferase. A, Western blotting analysis of glutamine synthetase and ornithine aminotransferase. 1, 2, 3, and 4 represent liver homogenates from SAMR1-1m, SAMP8-1m, SAMR1-6m, and SAMP8-6m, respectively. B, activity of GS in liver homogenates. C, glutamine concentration in liver homogenates. Error bars indicate S.E. from five independent experiments; *, p < 0.05; **, p < 0.01. U, units; prot, protein.
Oxidation Levels of Liver Proteins and Lipids—
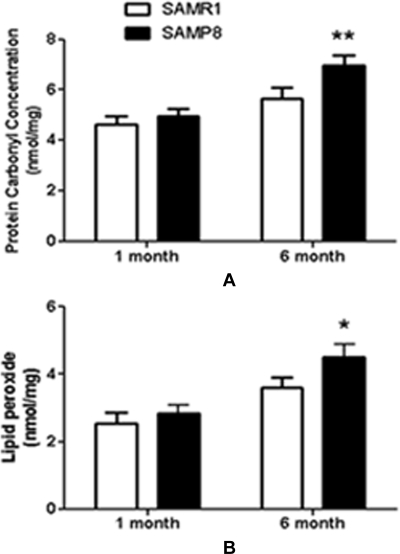
Both protein and lipid oxidation levels were compared between SAMR1 and SAMP8 at 1 and 6 months old. Protein carbonyl content (p < 0.01) and lipid peroxide (p < 0.05) in SAMP8-6m were significantly increased (Fig. 8, A and B).
Fig. 8.
Comparison of protein and lipid oxidation levels in SAMP8 and SAMR1. A, the average carbonyl content of liver proteins from SAMR1 and SAMP8. B, the average lipid peroxide content in the liver from SAMR1 and SAMP8. All data presented are the mean ± S.E. value of five independent experiments; *, p < 0.05; **, p < 0.01.
Other Assays—
Table IV lists several attributes of SAMR1 and SAMP8. Body weights and liver weights had no statistical differences between SAMR1 and SAMP8. As compared with SAMR1-6m, the liver triglycerides in SAMP8-6m were significantly increased (p < 0.01), whereas the levels of liver ATP (p < 0.01) and of liver acetyl-CoA (p < 0.05) were significantly decreased. Note that none of these characteristics had significant differences between SAMR1-1m and SAMP8-1m.
Table IV.
Phenotypic comparison of SAMR1 and SAMP8
The mice used were 1 month and 6 months of age, respectively. Each value represents the mean ± S.E.
| Parameter | 1 month
|
6 months
|
||
|---|---|---|---|---|
| SAMR1-1m | SAMP8-1m | SAMR1-6m | SAMP8-6m | |
| Number of mice | 5 | 5 | 5 | 5 |
| Body weight (g) | 23.1 ± 1.3 | 21.2 ± 1.5 | 31.3 ± 1.5 | 29.1 ± 2.1 |
| Liver weight (g) | 1.40 ± 0.13 | 1.23 ± 0.13 | 1.71 ± 0.10 | 1.75 ± 0.17 |
| Liver weight/body weight (%) | 6.1 ± 0.5 | 5.8 ± 0.6 | 5.5 ± 0.5 | 6.0 ± 0.3 |
| Liver triglycerides (mg/g protein) | 12.2 ± 4.9 | 14.6 ± 3.5 | 10.5 ± 3.6 | 21.7 ± 5.4a |
| Liver acetyl-CoA (nmol/mg protein) | 6.0 ± 0.8 | 5.9 ± 1.1 | 5.6 ± 0.6 | 4.1 ± 0.8b |
| Liver ATP (nmol/mg protein) | 30.3 ± 4.1 | 27.7 ± 3.5 | 37.0 ± 3.8 | 23.4 ± 4.6a |
p < 0.01 (Student’s t test).
p < 0.05 (Student’s t test).
DISCUSSION
As a widely used aging model, SAMP8 shows various age-related disorders after normal development and maturation. It has been reported that the differences between SAMP8 and SAMR1 become obvious after 4–6 months of age due to the steeper increase in the degree of senescence (29). In our study, no statistical difference was observed between the body weight, liver weight, and liver/body weight ratio of SAMP8 and that of SAMR1 at both 1 and 6 months old. However, SAMP8-6m showed a significant increase of liver lipid peroxide, protein carbonylation, and triglyceride concentration, indicating mitochondria-related liver dysfunction at the early stage. Therefore, we compared liver mitochondrial protein profiles between SAMP8-6m and SAMR1-6m to investigate the protein changes related to abnormal liver functions. Meanwhile protein profiles of SAMP8-1m and SAMR1-1m were also compared as a control group in the present study.
Mitochondrial metabolism of the fatty acids plays an important role in various biochemical reactions and metabolic pathways. Fatty acids constitute a main source of energy through β-oxidation with generation of acetyl-CoA subunits that may enter either the tricarboxylic acid cycle or ketogenesis in liver. Compared with SAMR1-6m, both protein and mRNA expression levels of HMG-CoA synthase were decreased in SAMP8-6m, causing significant reduction of its activity (Fig. 5). HMG-CoA synthase, which catalyzes acetoacetyl-CoA into 3-hydroxy-3-methylglutaryl-CoA, is considered to be the control site of the ketogenesis pathway (30). Ketogenesis occurs mainly in the liver, producing ketone bodies that can be exported out of the liver to provide energy for other tissues such as the heart, skeletal muscles, and brain under certain circumstances (31). The deficiency of HMG-CoA synthase would lead to lessened ketogenesis in SAMP8-6m livers.
It is now well recognized that the transcription activation of HMG-CoA synthase is mainly influenced by PPARα because of a conserved PPARα-responsive element in its promoter region (32). Lee et al. detected an extremely low level of HMG-CoA synthase in PPARα knock-out mice (33). PPARα is also known as a fatty acid transcriptional factor that determines the capacity of hepatic fatty acid β-oxidation. Absence of PPARα can lead to impairment in fatty acid β-oxidation in liver mitochondria with notable elevation in TG content (34). A considerable increased TG concentration had also been found in the livers of SAMP8-6m (Table IV), and we detected PPARα expression at protein and mRNA levels, both of which showed remarkable reduction in SAMP8-6m (Fig. 6). Acetyl-CoA, as an end product of the mitochondrial β-oxidation pathway, was also found to be decreased in SAMP8-6m livers (Table IV), indicating impairment of fatty acid metabolism. In addition, down-regulated expression levels of two PPARα target proteins, acyl-CoA oxidase 1 (ACOX1) and peroxisomal enoyl-CoA hydratase (ECHP), were detected in SAMP8-6m using proteomics tools (Table II). Given the reasons above, our data support that the impaired liver fatty acid metabolism and ketogenesis in SAMP8 was closely related to PPARα deficiency.
Liver mitochondria are considered to play a key role in metabolic process not only as the major resource of chemical energy (ATP) but also as the primary site of ROS. When reducing equivalents generated by fatty acid oxidation and the tricarboxylic acid cycle are oxidized to H2O through the transfer of electrons along the mitochondria respiratory chain, ATP and ROS are produced. In the present study, we found that eight proteins involved in the mitochondrial respiratory chain were down-regulated in SAMP8-6m, including NDUAA, NDUBA, NDUB7, NDUS1, NDUV1, and NDUS3 in mitochondrial complex I; EFTA in mitochondrial complex II; and UCRI in mitochondrial complex III. All of these altered proteins showed similar variations at their mRNA expression levels, indicating lower activity of the mitochondrial respiratory chain in SAMP8-6m. Correspondingly increased molecular damage (lipid peroxidation and protein carbonylation) as well as decreased ATP concentration was detected from the livers of SAMP8-6m in our study. There have already been various reports that aged SAMP8 displayed significantly lower mitochondrial respiratory chain complex I activity, leading to ATP deficiency and ROS elevation (4, 35). High oxidative stress conditions with reduced antioxidant enzyme activities in SAMP8 male livers have also been observed by Tomas-Zapico et al. (12). It is also reported that a severe inhibition of the respiratory chain would inhibit the lipid oxidation process (36). Therefore, it seems rational that the impairment of lipid oxidation, the tricarboxylic acid cycle, ketogenesis, and oxidative phosphorylation are closely related to each other to induce the mitochondria-related liver dysfunction in SAMP8.
As one of the main biological macromolecules, proteins are susceptible to free radical attack, leading to the loss of functions (37). Furthermore with ammonia as an end product, protein metabolic disorder may cause higher concentration of free ammonia. In our work, ornithine aminotransferase (OAT) and glutamine synthetase (GS), which can prevent ammonia accumulation via biosynthesis of glutamate and glutamine, were found to be up-regulated in both SAMP8-1m and SAMP8-6m. It has been reported previously that 2-month-old SAMP8 began to exhibit high levels of Glu and Gln, indicating abnormal protein metabolism (38). Hyperexpression of OAT from 12-month-old SAMP8 has also been reported (39); this is consistent with the present work. However, on the contrary, Butterfield et al. (40) have detected decreased GS activity in the brain of 10-month-old SAMP8 resulting from oxidative post-translational modifications. To investigate whether liver GS activity in SAMP8-6m was also influenced by oxidative modifications, we further measured the liver GS activity and glutamine (produced by GS) concentration in SAMP8-6m; both were elevated (Fig. 7, B and C), consistent with the up-regulation of GS detected by proteomics analysis (Table II) and Western blotting (Fig. 7A). However, GS expression in SAMP8 brains showed no difference from that in SAMR1, whereas its activity was significantly decreased in SAMP8-6m (supplemental Fig. S3). Considering the age-related learning and memory impairments in SAMP8, we hypothesize that the differences in these results may be due to the organ-specific control of glutamine metabolism.
Taken together, our results provided insight to explain the mitochondria-related liver dysfunction in SAMP8 at the level of subcellular proteome. We used both 2-DE- and ICAT-based proteomics analysis to find the differentially expressed mitochondrial proteins between SAMP8 and SAMR1. The altered proteins involved in the respiratory chain, ketogenesis, and fatty acid oxidation and protein metabolism may lead to liver metabolic disorders, which are characterized by increased TG, glutamine, oxidative protein, and lipid peroxide concentration as well as decreased acetyl-CoA and ATP content in SAMP8-6m. In conclusion, our data are should be helpful in understanding the intricate process of early liver dysfunction in SAMP8.
Supplementary Material
Footnotes
Published, MCP Papers in Press, May 29, 2008, DOI 10.1074/mcp.M800109-MCP200
The abbreviations used are: ROS, reactive oxygen species; 2-DE, two-dimensional gel electrophoresis; SAM, senescence-accelerated mouse; SAMP, senescence-accelerated mouse prone; SAMP8-1m, senescence-accelerated mouse prone/8 at 1 month old; SAMP8-6m, senescence-accelerated mouse prone/8 at 6 months old; SAMR, senescence-accelerated mouse resistant; SAMR1-1m, senescence-accelerated mouse resistant/1 at 1 month old; SAMR1-6m, senescence-accelerated mouse resistant/1 at 6 months old; TG, triglyceride; PPARα, peroxisome proliferator-activated receptor α; S/N, signal to noise ratio; HMG, 3-hydroxy-3-methylglutaryl; 2-D, two-dimensional; ID, identity; OAT, ornithine aminotransferase; GS, glutamine synthetase.
This work was supported by the National Key Basic Research Program of China (Grant 2006CB910103). The costs of publication of this article were defrayed in part by the payment of page charges. This article must therefore be hereby marked “advertisement” in accordance with 18 U.S.C. Section 1734 solely to indicate this fact.
The on-line version of this article (available at http://www.mcponline.org) contains supplemental material.
REFERENCES
- 1.Pessayre, D., Berson, A., Fromenty, B., and Mansouri, A. ( 2001) Mitochondria in steatohepatitis. Semin. Liver Dis. 21, 57–69 [DOI] [PubMed] [Google Scholar]
- 2.Day, C. P., and James, O. F. ( 1998) Hepatic steatosis: innocent bystander or guilty party? Hepatology 27, 1463–1466 [DOI] [PubMed] [Google Scholar]
- 3.Takeda, T., Hosokawa, M., Takeshita, S., Irino, M., Higuchi, K., Matsushita, T., Tomita, Y., Yasuhira, K., Hamamoto, H., Shimizu, K., Ishii, M., and Yamamuro, T. ( 1981) A new murine model of accelerated senescence. Mech. Ageing Dev. 17, 183–194 [DOI] [PubMed] [Google Scholar]
- 4.Nakahara, H., Kanno, T., Inai, Y., Utsumi, K., Hiramatsu, M., Mori, A., and Packer, L. ( 1998) Mitochondrial dysfunction in the senescence accelerated mouse (SAM). Free Radic. Biol. Med. 24, 85–92 [DOI] [PubMed] [Google Scholar]
- 5.Miyamoto, M., Kiyota, Y., Yamazaki, N., Nagaoka, A., Matsuo, T., Nagawa, Y., and Takeda, T. ( 1986) Age-related changes in learning and memory in the senescence-accelerated mouse (SAM). Physiol. Behav. 38, 399–406 [DOI] [PubMed] [Google Scholar]
- 6.Yagi, H., Katoh, S., Akiguchi, I., and Takeda, T. ( 1988) Age-related deterioration of ability of acquisition in memory and learning in senescence accelerated mouse: SAM-P/8 as an animal model of disturbances in recent memory. Brain Res. 474, 86–93 [DOI] [PubMed] [Google Scholar]
- 7.Ye, X., Meeker, H. C., Kozlowski, P. B., Wegiel, J., Wang, K. C., Imaki, H., and Carp, R. I. ( 2004) Pathological changes in the liver of a senescence accelerated mouse strain (SAMP8): a mouse model for the study of liver diseases. Histol. Histopathol. 19, 1141–1151 [DOI] [PubMed] [Google Scholar]
- 8.Vila, L., Roglans, N., Alegret, M., Camins, A., Pallas, M., Sanchez, R. M., Vazquez-Carrera, M., and Laguna, J. C. ( 2007) Hypertriglyceridemia and hepatic steatosis in senescence-accelerated mouse associate to changes in lipid-related gene expression. J. Gerontol. A Biol. Sci. Med. Sci. 62, 1219–1227 [DOI] [PubMed] [Google Scholar]
- 9.Letteron, P., Fromenty, B., Terris, B., Degott, C., and Pessayre, D. ( 1996) Acute and chronic hepatic steatosis lead to in vivo lipid peroxidation in mice. J. Hepatol. 24, 200–208 [DOI] [PubMed] [Google Scholar]
- 10.Parola, M., and Robino, G. ( 2001) Oxidative stress-related molecules and liver fibrosis. J. Hepatol. 35, 297–306 [DOI] [PubMed] [Google Scholar]
- 11.Matsugo, S., Kitagawa, T., Minami, S., Esashi, Y., Oomura, Y., Tokumaru, S., Kojo, S., Matsushima, K., and Sasaki, K. ( 2000) Age-dependent changes in lipid peroxide levels in peripheral organs, but not in brain, in senescence-accelerated mice. Neurosci. Lett. 278, 105–108 [DOI] [PubMed] [Google Scholar]
- 12.Tomas-Zapico, C., Alvarez-Garcia, O., Sierra, V., Vega-Naredo, I., Caballero, B., Joaquin Garcia, J., Acuna-Castroviejo, D., Rodriguez, M. I., Tolivia, D., Rodriguez-Colunga, M. J., and Coto-Montes, A. ( 2006) Oxidative damage in the livers of senescence-accelerated mice: a gender-related response. Can. J. Physiol. Pharmacol. 84, 213–220 [DOI] [PubMed] [Google Scholar]
- 13.Dreger, M. ( 2003) Subcellular proteomics. Mass Spectrom. Rev. 22, 27–56 [DOI] [PubMed] [Google Scholar]
- 14.Yates, J. R., III, Gilchrist, A., Howell, K. E., and Bergeron, J. J. ( 2005) Proteomics of organelles and large cellular structures. Nat. Rev. Mol. Cell Biol. 6, 702–714 [DOI] [PubMed] [Google Scholar]
- 15.Andersen, J. S., and Mann, M. ( 2006) Organellar proteomics: turning inventories into insights. EMBO Rep. 7, 874–879 [DOI] [PMC free article] [PubMed] [Google Scholar]
- 16.Bailey, S. M., Landar, A., and Darley-Usmar, V. ( 2005) Mitochondrial proteomics in free radical research. Free Radic. Biol. Med. 38, 175–188 [DOI] [PubMed] [Google Scholar]
- 17.Bogenhagen, D., and Clayton, D. A. ( 1974) The number of mitochondrial deoxyribonucleic acid genomes in mouse L and human HeLa cells. Quantitative isolation of mitochondrial deoxyribonucleic acid. J. Biol. Chem. 249, 7991–7995 [PubMed] [Google Scholar]
- 18.He, J., Liu, Y., He, S., Wang, Q., Pu, H., and Ji, J. ( 2007) Proteomic analysis of a membrane skeleton fraction from human liver. J. Proteome Res. 6, 3509–3518 [DOI] [PubMed] [Google Scholar]
- 19.Levillain, O., Ventura, G., Dechaud, H., Hobeika, M., Meseguer, A., Moinard, C., and Cynober, L. ( 2007) Sex-differential expression of ornithine aminotransferase in the mouse kidney. Am. J. Physiol. 292, F1016–F1027 [DOI] [PubMed] [Google Scholar]
- 20.Yang, W., Liu, P., Liu, Y., Wang, Q., Tong, Y., and Ji, J. ( 2006) Proteomic analysis of rat pheochromocytoma PC12 cells. Proteomics 6, 2982–2990 [DOI] [PubMed] [Google Scholar]
- 21.Gobom, J., Schuerenberg, M., Mueller, M., Theiss, D., Lehrach, H., and Nordhoff, E. ( 2001) α-Cyano-4-hydroxycinnamic acid affinity sample preparation. A protocol for MALDI-MS peptide analysis in proteomics. Anal. Chem. 73, 434–438 [DOI] [PubMed] [Google Scholar]
- 22.Quant, P. A., Tubbs, P. K., and Brand, M. D. ( 1989) Treatment of rats with glucagon or mannoheptulose increases mitochondrial 3-hydroxy-3-methylglutaryl-CoA synthase activity and decreases succinyl-CoA content in liver. Biochem. J. 262, 159–164 [DOI] [PMC free article] [PubMed] [Google Scholar]
- 23.Webb, J. T., and Brown, G. W., Jr. ( 1980) Glutamine synthetase: assimilatory role in liver as related to urea retention in marine chondrichthyes. Science 208, 293–295 [DOI] [PubMed] [Google Scholar]
- 24.Oliver, C. N., Ahn, B. W., Moerman, E. J., Goldstein, S., and Stadtman, E. R. ( 1987) Age-related changes in oxidized proteins. J. Biol. Chem. 262, 5488–5491 [PubMed] [Google Scholar]
- 25.Ohkawa, H., Ohishi, N., and Yagi, K. ( 1979) Assay for lipid peroxides in animal tissues by thiobarbituric acid reaction. Anal. Biochem. 95, 351–358 [DOI] [PubMed] [Google Scholar]
- 26.Roglans, N., Sanguino, E., Peris, C., Alegret, M., Vazquez, M., Adzet, T., Diaz, C., Hernandez, G., Laguna, J. C., and Sanchez, R. M. ( 2002) Atorvastatin treatment induced peroxisome proliferator-activated receptor α expression and decreased plasma nonesterified fatty acids and liver triglyceride in fructose-fed rats. J. Pharmacol. Exp. Ther. 302, 232–239 [DOI] [PubMed] [Google Scholar]
- 27.Baltazar, M. F., Dickinson, F. M., and Ratledge, C. ( 1999) Oxidation of medium-chain acyl-CoA esters by extracts of Aspergillus niger: enzymology and characterization of intermediates by HPLC. Microbiology 145, 271–278 [DOI] [PubMed] [Google Scholar]
- 28.Yu, W., Gong, J. S., Ko, M., Garver, W. S., Yanagisawa, K., and Michikawa, M. ( 2005) Altered cholesterol metabolism in Niemann-Pick type C1 mouse brains affects mitochondrial function. J. Biol. Chem. 280, 11731–11739 [DOI] [PubMed] [Google Scholar]
- 29.Hosokawa, M., Kasai, R., Higuchi, K., Takeshita, S., Shimizu, K., Hamamoto, H., Honma, A., Irino, M., Toda, K., and Matsumura, A. ( 1984) Grading score system: a method for evaluation of the degree of senescence in senescence accelerated mouse (SAM). Mech. Ageing Dev. 26, 91–102 [DOI] [PubMed] [Google Scholar]
- 30.Reed, W. D., Ozand, P. T., Tildon, J. T., and Cornblath, M. ( 1977) Effects of starvation and development on mitochondrial acetoacetyl-coenzyme A thiolase of rat liver. Biochem. J. 164, 27–32 [DOI] [PMC free article] [PubMed] [Google Scholar]
- 31.Hegardt, F. G. ( 1999) Mitochondrial 3-hydroxy-3-methylglutaryl-CoA synthase: a control enzyme in ketogenesis. Biochem. J. 338, 569–582 [PMC free article] [PubMed] [Google Scholar]
- 32.Rodriguez, J. C., Gil-Gomez, G., Hegardt, F. G., and Haro, D. ( 1994) Peroxisome proliferator-activated receptor mediates induction of the mitochondrial 3-hydroxy-3-methylglutaryl-CoA synthase gene by fatty acids. J. Biol. Chem. 269, 18767–18772 [PubMed] [Google Scholar]
- 33.Lee, S. S., Chan, W. Y., Lo, C. K., Wan, D. C., Tsang, D. S., and Cheung, W. T. ( 2004) Requirement of PPARα in maintaining phospholipid and triacylglycerol homeostasis during energy deprivation. J. Lipid Res. 45, 2025–2037 [DOI] [PubMed] [Google Scholar]
- 34.Dreyer, C., Krey, G., Keller, H., Givel, F., Helftenbein, G., and Wahli, W. ( 1992) Control of the peroxisomal β-oxidation pathway by a novel family of nuclear hormone receptors. Cell 68, 879–887 [DOI] [PubMed] [Google Scholar]
- 35.Nishikawa, T., Takahashi, J. A., Fujibayashi, Y., Fujisawa, H., Zhu, B., Nishimura, Y., Ohnishi, K., Higuchi, K., Hashimoto, N., and Hosokawa, M. ( 1998) An early stage mechanism of the age-associated mitochondrial dysfunction in the brain of SAMP8 mice; an age-associated neurodegeneration animal model. Neurosci. Lett. 254, 69–72 [DOI] [PubMed] [Google Scholar]
- 36.Pande, S. V. ( 1971) On rate-controlling factors of long chain fatty acid oxidation. J. Biol. Chem. 246, 5384–5390 [PubMed] [Google Scholar]
- 37.Dean, R. T., Gebicki, J., Gieseg, S., Grant, A. J., and Simpson, J. A. ( 1992) Hypothesis: a damaging role in aging for reactive protein oxidation products? Mutat. Res. 275, 387–393 [DOI] [PubMed] [Google Scholar]
- 38.Kitamura, Y., Zhao, X. H., Ohnuki, T., Takei, M., and Nomura, Y. ( 1992) Age-related changes in transmitter glutamate and NMDA receptor/channels in the brain of senescence-accelerated mouse. Neurosci. Lett. 137, 169–172 [DOI] [PubMed] [Google Scholar]
- 39.Cho, Y. M., Bae, S. H., Choi, B. K., Cho, S. Y., Song, C. W., Yoo, J. K., and Paik, Y. K. ( 2003) Differential expression of the liver proteome in senescence accelerated mice. Proteomics 3, 1883–1894 [DOI] [PubMed] [Google Scholar]
- 40.Butterfield, D. A., Howard, B. J., Yatin, S., Allen, K. L., and Carney, J. M. ( 1997) Free radical oxidation of brain proteins in accelerated senescence and its modulation by N-tert-butyl-α-phenylnitrone. Proc. Natl. Acad. Sci. U. S. A. 94, 674–678 [DOI] [PMC free article] [PubMed] [Google Scholar]
Associated Data
This section collects any data citations, data availability statements, or supplementary materials included in this article.


