Abstract
In vivo optical imaging to enhance the detection of cancer during endoscopy or surgery requires a targeted fluorescent probe with high emission efficiency and high signal-to-background ratio. One strategy to accurately detect cancers is to have the fluorophore internalize within the cancer cells permitting non-bound fluorophores to be washed away or absorbed. The choice of fluorophores for this task must be carefully considered. For depth of penetration, near infrared probes are ordinarily preferred but suffer from relatively low quantum efficiency. Although green fluorescent protein has been widely used to image tumors on internal organs in mice, green fluorescent probes are suitable for imaging the superficial tissue because of the short penetration distance of green light in tissue but the highly efficient production of signal. While the fluorescence properties of green fluorophores are well known in vitro less attention has been paid to their fluorescence once they are internalized within cells. In this study, the emission efficiency after cellular internalization of 4 common green fluorophores conjugated to avidin (Av-fluorescein, Av-Oregon green, Av-BODIPY-FL, and Av-Rhodamine green) were compared after each conjugate was incubated with SHIN3 ovarian cancer cells. Using the lectin binding receptor system, the avidin-fluorophore conjugates were endocytosed and their fluorescence was evaluated with fluorescence microscopy and flow cytometry. While fluorescein demonstrated the highest signal outside the cell, among the four fluorophores, internalized Av-Rhodamine green emitted the most light from SHIN3 ovarian cancer cells both in vitro and in vivo. The internalized Av-Rhodamine green complex appeared to localize to the endoplasmic vesicles. Thus, among the four common green fluorescent dyes, Rhodamine green is the brightest green fluorescence probe after cellular internalization. This information could have implication for the design of tumor targeted fluorescent probes that rely on cellular internalization for cancer detection.
INTRODUCTION
In vivo optical imaging during endoscopy or surgery requires targeted fluorescence probes with high signal-to-background ratios to detect cancer on the surface of tissues such as the peritoneum or colon. Although green fluorescent protein has been used to image tumors on internal organs in mice (1,2), green fluorescent probes are ordinarily used less for in vivo imaging than near infrared probes because of their short penetration distance within tissue, however, when the surface is being imaged, green fluorophores hold considerable advantages over fluorophores that emit at higher wavelengths due to their higher emission efficiency and the ability to distinguish them from the background autofluorescence. There is a growing list of green fluorophores available for probe development (3,4). Fluorescein, a well established bright green fluorescence dye, is approved for human use to perform retinal angiography and therefore has advantages based on its known safety profile in humans (5). More recently, three other green fluorescence dyes, Oregon Green (OreG), Rhodamine Green (RhodG), and 4,4-difluoro-4-bora-3a,4a-diaza-s-indacene (BODIPY; BODIPY-FL), have been developed and are commercially available (Figure 1). Each of these has similar emission spectra to fluorescein and it is not immediately clear which of these agents is preferred.
Figure 1.
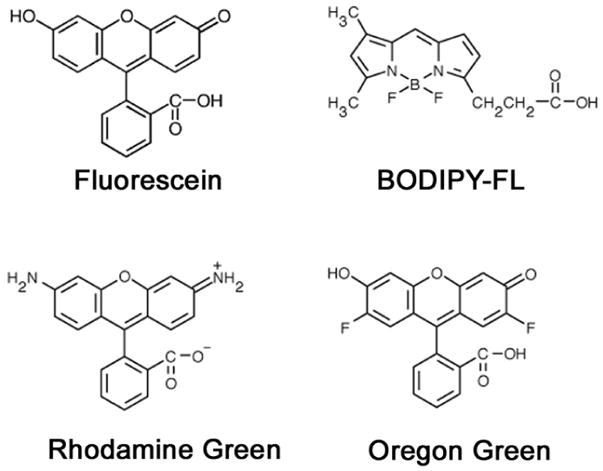
The chemical structures of the four green fluorescence dyes compared in this study.
In theory, one has only to look at the relative brightness of these fluorophores in vitro to determine which is the most desirable from the standpoint of optical probe development. However, it has recently been shown that there are considerable advantages if the fluorophore can be internalized within the cancer cell rather than simply remain on its surface. For internalizing probes, non-internalized fluorophores are either washed away or absorbed leading to very high signal emanating from the cells and negligible background signal. For instance, when avidin-conjugated fluorescein was instilled in the peritoneum of mice bearing implanted ovarian cancers it was either internalized within the cancers or absorbed through the peritoneum making it possible to detect sub-millimeter cancer implants (6). The specific uptake of avidin was based on its affinity for asialo-receptors found in abundance on the cell surface of various cancers, especially which can form metastatic implants in the peritoneal space such as ovarian, colorectal, gastric and pancreatic cancers (7). However, it is uncertain if the optical properties of fluorophores change in the unique chemical environment of the cell (e.g. acidic pH, oxidation, aggressive proteolysis) and it is possible that the newer dyes might yield greater signal within cancer cells than fluorescein. This could impact the detectability of minute cancer implants at a time when they are most curable. In the present study, we conjugated four widely available green fluorescent dyes to avidin to study them both in vitro and in vivo before and after uptake into ovarian cancer cells and compared their emission efficiency and brightness.
EXPERIMENTAL PROCEDURES
Synthesis of avidin-conjugated green fluorescence dyes
Avidin was purchased from Pierce Biochemical Inc. (Milwaukee, WI, USA), amido-reactive fluorescein, BODIPY (BODIPY-FL), OreG and RhodG were purchased from Molecular Probes Inc. (Eugene, OR, USA). At room temperature, 400 μg (5.9 nmol) of avidin in 198 μL of Na2HPO4 was incubated with 12 nmol (2 μL/6mM) of isothiocyanatobenzyl-fluorescein, or BODIPY-, OreG- or RhodG-succinoimidyl ester, respectively, in DMSO for 15 min. The mixture was purified with Sephadex G50 (PD-10; GE Healthcare, Milwaukee, WI, USA). Avidin-conjugated fluorescein, BODIPY, OreGr and RhodG samples (Av-FITC, Av-BODIPY, Av-OreG and Av-RhodG, respectively) were kept at 4ºC in the refrigerator as stock solutions.
The protein concentration of Av-FITC, Av-BODIPY, Av-OreG and Av-RhodG samples was determined with Coomassie Plus protein assay kit (Pierce Chem Co., Rockford, IL, USA) by measuring the absorption at 595 nm with a UV-Vis system (8453 Value UV-Bis system, Agilent Technologies, Palo Alto, CA, USA) using standard solutions of known concentrations of avidin (100, 200 and 400 μg/mL). Then, the concentration of fluorescein, BODIPY, OreG and RhodG were measured by the absorption at 497, 508, 500 and 503 nm respectively with a UV-Vis system (8453 Value UV-Bis system, Agilent Technologies, Palo Alto, CA, USA) to confirm the number of fluorophore molecules conjugated with each avidin molecule. By changing the concentration of avidin solution, the number of fluorophore molecules per avidin was adjusted to be approximately 0.8.
Cell culture
An established ovarian cancer cell line SHIN3 (8) was used for in vitro fluorescence microscopy, flow cytometry and in vivo optical imaging for intraperitoneal disseminated cancer implants. The cell lines were grown in RPMI 1640 medium (Gibco, Gaithersburg, MD, USA) containing 10% fetal bovine serum (FBS) (Gibco, Gaithersburg, MD, USA), 0.03% L-glutamine at 37°C, 100 Units/mL Penicillin and 100 μg/mL Streptomycin in 5% CO2.
Fluorescence microscopy
SHIN3 cells (1 × 10⁴) were plated on a cover glass bottom culture well and incubated for 16 hours. Av-FITC, Av-BODIPY, Av-OreG or Av-RhodG was added to the medium (30 μg/mL) and the cells were incubated for 1 hour. Cells were washed one time with PBS and fluorescent microscopy was then performed immediately and at 4 and 8 hours after washing with PBS. Cells were incubated in RPMI 1640 medium without dyes after wash with PBS. Fluorescence microscopy was performed using an Olympus BX51 microscope (Olympus America Inc., Melville, NY, USA) equipped with the following filters: excitation wavelength 470–490 nm, emission wavelength 515 nm long pass.
Flow cytometry
One-color flow cytometry was performed for the assessment of fluorescing capability of Av-FITC, Av-BODIPY, Av-OreG and Av-RhodG in SHIN3 cancer cells. SHIN3 cells (1 × 10⁴) were plated on a 12-chamber culture well and incubated for 16 hours. Av-FITC, Av-BODIPY, Av-OreG or Av-RhodG was added to the medium (30 μg/mL) and the cells were incubated for 96 hours. Cells were washed twice with PBS and incubated in RPMI 1640 medium without fluorophores. Cells were washed once with PBS, trypsinized and flow cytometry was performed immediately and at 24 hours after washing with PBS. The argon ion 488 nm laser was employed for excitation. Signals from cells were collected using a 530/30 nm band-pass filter. Cells were analyzed in a FACScan cytometer (Becton Dickinson, Franklin Lakes, NJ, USA) and all data were analyzed using CellQuest software (Becton Dickinson, Franklin Lakes, NJ, USA). The fluorescing capability of each fluorophore was referred as Mean Fluorescence Index (MFI).
Fluorescence intensity of 4 dyes before intraperitoneal injection
To compare the fluorescing capability of the 4 fluorophore-conjugates before intraperitoneal injection, fluorescence intensity and emission spectra of Av-BODIPY, Av-FITC, Av-OreG and Av-RhodG were measured by the Maestro™ In-Vivo Imaging System (CRi Inc., Woburn, MA, USA) in arbitrary units. Av-BODIPY, Av-FITC, Av-OreG and Av-RhodG (5 μg/390 μL PBS) were put in a nonfluorescent 96-well plate and spectral fluorescence imaging was performed. The ratio of BODIPY, fluorescein, OreG or RhodG molecules to avidin molecules was 0.8. To study the fluorescing capability under the acidic condition, 5 μg Av-BODIPY, Av-FITC, Av-OreG and Av-RhodG were diluted in 390 μL buffer mixture consisting of sodium dihydrogen phosphate and phosphate (pH 3.3). A band pass filter from 445 to 490 nm and a long pass filter over 515 nm were used for emission and excitation light respectively. The tunable filter was automatically stepped in 10 nm increments from 500 to 800 nm while the camera captured images at each wavelength interval with constant exposure. Spectral unmixing algorithms were applied to create the unmixed image of the 4 green dyes distinguished from background autofluorescence. A region of interest (ROI) as large as each well was drawn to determine the fluorescence intensity as well as the emission spectra of each of the 4 dye-conjugates in order to exclude a dye that had the emission peak different from the fluorescein peak.
Tumor model
All procedures were carried out in compliance with the Guide for the Care and Use of Laboratory Animal Resources (1996), National Research Council, and approved by the local Animal Care and Use Committee. The intraperitoneal tumor implants were established by intraperitoneal injection of 2 × 10⁶ cells suspended in 200 μL of PBS in female nude mice (National Cancer Institute Animal Production Facility, Frederick, MD, USA). Experiments with tumor-bearing mice were performed at 14 days after injection of the cells.
In vivo spectral fluorescence imaging
50 μg each of Av-BODIPY, Av-FITC, Av-OreG and Av-RhodG were diluted in 300 μL PBS and injected into the peritoneal cavities of mice with peritoneally disseminated cancer implants. Three hours after injection of each dye, each mouse was sacrificed at a time with carbon dioxide. Immediately after sacrifice, the abdominal cavity was exposed and the 4 mice, each with a different fluorophore instilled in the peritoneum, were placed side-by-side on a nonfluorescent plate to compare the fluorescence intensity of tumors simultaneously. Spectral fluorescence images were obtained using the Maestro™ In-Vivo Imaging System (CRi Inc., Woburn, MA, USA). Whole abdominal images as well as close-up peritoneal membrane images were obtained. A band pass filter from 445 to 490 nm and a long pass filter over 515 nm were used for emission and excitation light, respectively. The tunable filter was automatically stepped in 10 nm increments from 500 to 800 nm while the camera captured images at each wavelength interval with constant exposure. The spectral fluorescence images consisting of autofluorescence spectra and a spectrum from each of the four green dyes were obtained, and then, unmixed based on their spectral patterns using commercial software (Maestro software, CRi Inc. Woburn MA USA). The experiment was repeated three times (n = 3 mice per fluorophore).
Using the unmixed fluorescence images of the peritoneal membranes, fluorescence intensity of the cancer implants was semi-quantitatively compared among the four dyes. An ROI as large as the peritoneal membrane was drawn inside the bowel, and a histogram (number of pixels at specific fluorescence intensity) was created using ImageJ software (http://rsb.info.nih.gov/ij/plugins/mri-analysis.html). Then, a threshold was set in the fluorescence intensity above which a pixel is counted. The total number of pixels (N) within the threshold range was calculated at a threshold value of t [Eq. 1].
| [Eq. 1] |
where i is the fluorescence intensity in arbitrary units, n is the number of pixels at the fluorescence intensity of i, t is the threshold value, and N is the total number of pixels within the threshold range (i > = t). The common logarithm (Log) values of N were calculated and plotted as a function of t. The regression line and the correlation coefficient (r) were calculated from these data sets (t and LogN) by the Microsoft Excel 2003 (Microsoft, Redmond, WA, USA). For comparison of the fluorescing capability or the “brightness” of each dye, the slope of the regression line was compared among the four dyes. If the absolute value of r was less than 0.9, then slope values were not included.
RESULTS AND DISCUSSION
Optical characteristics of avidin-conjugated dyes
To investigate the optical characteristics of Av-BODIPY, Av-FITC, Av-OreG and Av-RhodG ex vivo, fluorescence intensity and emission spectra were measured under the same conditions: total dose, concentration of the solution, number of fluorophore conjugated per avidin, excitation/emission filters and exposure time. All 4 spectra contained an emission peak at a wavelength of 550 nm when stepped in 10 nm increments at pH 7.4 (Figure 2a). The fluorescence intensities of Av-BODIPY, Av-FITC, Av-OreG and Av-RhodG were 28, 238, 170 and 159 in arbitrary units, respectively (Figure 2b). Thus, ex vivo the Av-FITC demonstrated the highest signal and the Av-BODIPY the lowest in PBS solution at pH 7.4. When these 4 dyes were put into the phosphate buffer at pH 3.3, the fluorescence intensities of Av-BODIPY, Av-FITC, Av-OreG and Av-RhodG were 35, 33, 122 and 199 in arbitrary units, respectively (Figure 2b). That is, when the pH changed from 7.4 to 3.3, the fluorescence intensities of Av-BODIPY and Av-RhodG increased by 25% and 25%, respectively, although BODIPY emitted over 1/5-fold less fluorescence than other three dyes, when conjugated with avidin. In contrast, Av-FITC and Av-OreG decreased by 86% and 28%, respectively.
Figure 2.
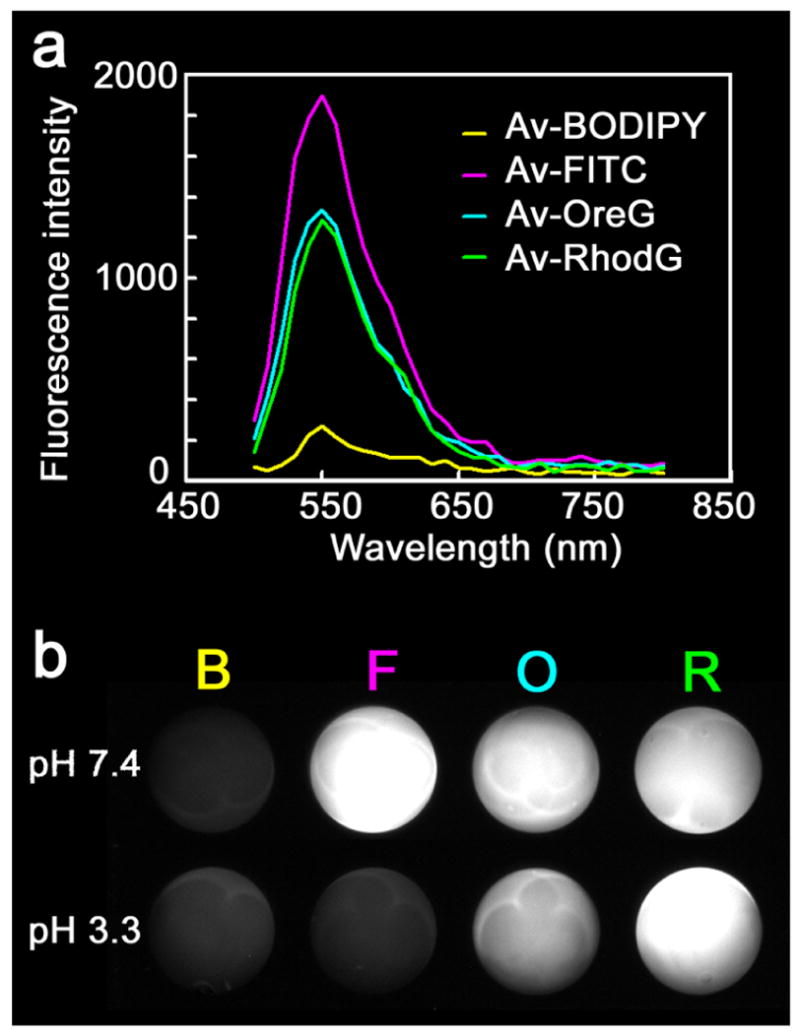
Optical characteristics of avidin-conjugated BODIPY, FITC, OreG and RhodG. 5 μg Av-BODIPY, Av-FITC, Av-OreG or Av-RhodG in 390 μL PBS (pH 7.4) or the mixture of sodium dihydrogen phosphate and phosphate (pH 3.3) were placed in a nonfluorescent 96-well plate and spectral fluorescence image was obtained. The ratio of BODIPY, FITC, OreG or RhodG molecules to avidin was 0.8 in all cases a: Emission spectra. All 4 dyes had the same emission peak at a wavelength of 550 nm but the fluorescence intensity was different with Av-FITC the highest followed by Av-OreG, Av-RhodG and Av-BODIPY. b: Fluorescence intensities of Av-BODIPY (B), Av-FITC (F), Av-OreG (O) and Av-RhodG (R) were 28, 238, 170 and 159, respectively, in arbitrary units (a.u.) with Av-FITC the highest and Av-BODIPY the lowest under pH 7.4. However, under the acidic condition (pH 3.3), fluorescence intensities of Av-BODIPY, Av-FITC, Av-OreG and Av-RhodG were 35, 33, 122 and 199 (a.u.), respectively, with Av-FITC the lowest and Av-RhodG the highest.
Intracellular Av-RhodG demonstrates progressive fluorescence after internalization
SHIN3 cells were incubated with each of the four fluorophores for 1 hour and fluorescent microscopy was then performed immediately and at 4 and 8 hours after washing with PBS (Figure 3). No visual differences were seen among the different fluorophores at any of these time points except for the 8 hour image obtained using Av-RhodG, which showed very bright fluorescent dots within the cytoplasm and was so intense that exposure times were halved to create the image to avoid overwhelming the dynamic range of the camera (Figure 3). The images also revealed that the Av-RhodG was clearly internalized within the endoplasmic vesicles within the cytoplasm. These data suggest that Av-RhodG behaves differently than the other 3 dyes regarding fluorescent intensity and the stability within the cells.
Figure 3.
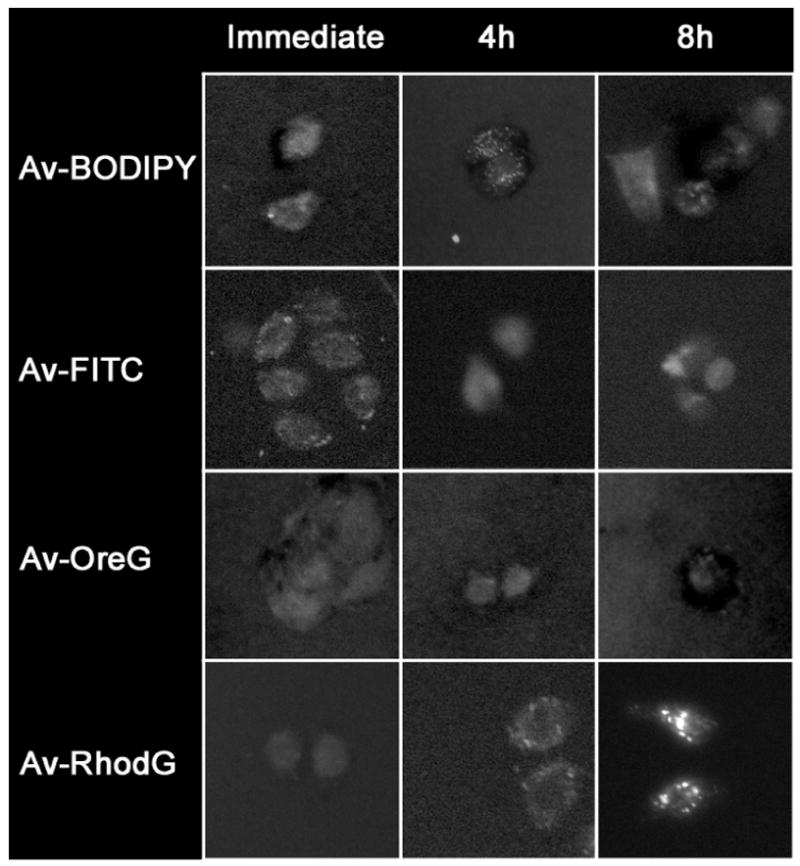
Serial fluorescence microscopy images of SHIN3 ovarian cancer cells. SHIN3 cells were incubated with each of the four fluorophores for 1 hour and fluorescent microscopy was then performed immediately and at 4 and 8 hours after washing with PBS. Av-RhodG showed that the size of intracellular fluorescent dots as well as the fluorescence intensity progressively increased with time, while the other 3 dyes showed a minimal change. Original magnification: x200. Photographic exposure time: Av-BODIPY, Av-FITC and Av-OreG (immediate, 4 and 8 hours) = 2s, Av-RhodG (immediate and 4 hours) = 2s, Av-RhodG (8 hours) = 1s.
Intracellular Av-RhodG demonstrates significantly higher fluorescence on FACS than other fluorophores
After 96 hours incubation with each of the fluorophores, flow cytometry was performed immediately and 24 hours following washing on SHIN3 cells. Immediately after washing, Av-BODIPY, Av-OreG and Av-RhodG showed a significant shift (>one order shift) as compared with unstained SHIN3 control cells (Figure 4). Among the 4 agents Av-RhodG showed significantly higher mean fluorescence intensity (MFI) despite suboptimal excitation wavelength for Av-RhodG (p < 0.001). However, Av-FITC demonstrated minimal rightward shift (from 0.4% to 9.7%) and the MFI did not increase significantly. The cells were evaluated 24 hours later for MFI and Av-RhodG still demonstrated the highest fluorescence among the 4 fluorophores.
Figure 4.
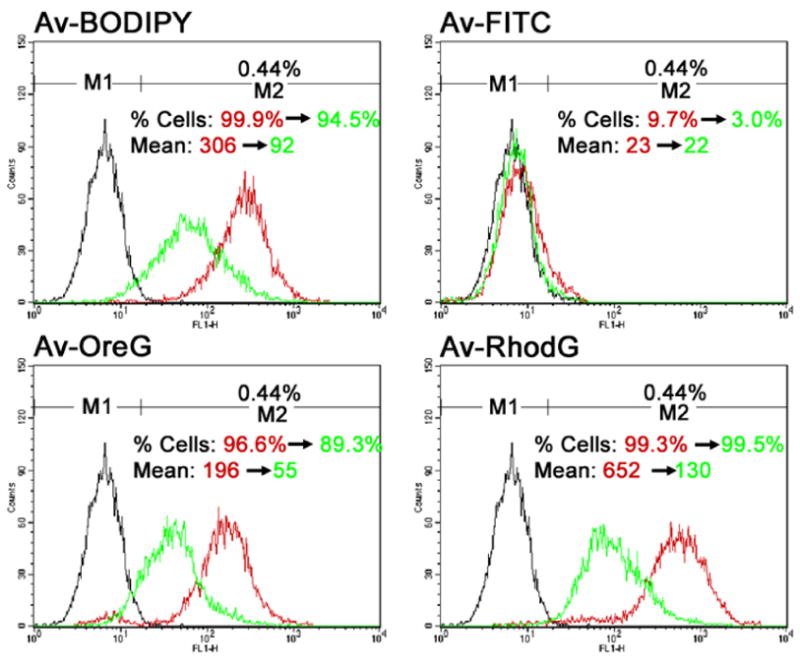
Histograms for flow cytometric analysis of SHIN3 cancer cells immediately (red) and at 24 hours (green) after washout of each of the 4 green dyes as well as the control SHIN3 cells without treatment with dye (black). Samples with Av-BODIPY, Av-OreG and Av-RhodG showed a significant rightward shift both immediately and at 24 hours after washing dyes compared with the untreated control samples. Av-RhodG demonstrated the highest fluorescence both immediately (MFI 652) and 24 hours after (MFI 130) washing. The percent cells in M2 increased from 0.44% to 99.9% for Av-BODIPY, 96.6% for Av-OreG and 99.3% for Av-RhodG after 96-hour incubation with each of the 4 dyes. Av-FITC did not show a significant rightward shift with percent cells in M2 from 0.44% to 9.7%.
Av-RhodG demonstrated the highest fluorescence on in vivo spectral fluorescence imaging
Three hours after intraperitoneal injection of 50 μg Av-BODIPY, Av-FITC, Av-OreG and Av-RhodG, spectral fluorescence images of the whole abdominal cavity as well as closeup images of the peritoneal membranes were obtained by placing 4 mice, each with a different fluorophore, side-by-side on a nonfluorescent plate. Using spectral unmixing algorithm, the fluorescence signals of tumors were clearly distinguished from the autofluorescence from the intestine and the other organs. Unmixed images of the peritoneal cavities demonstrated that Av-BODIPY, Av-OreG and Av-RhodG depicted the tumor foci, however, Av-FITC failed to visualize the tumors due to the insufficient fluorescence intensity compared to the other fluorophores at the same exposure times (Figure 5). Unmixed images of the peritoneal membranes clearly visualized lesions as small as 1 mm in diameter in all mice (Figure 5). However, the fluorescence intensity of Av-RhodG was the highest and that of Av-FITC was the lowest of all when compared visually.
Figure 5.
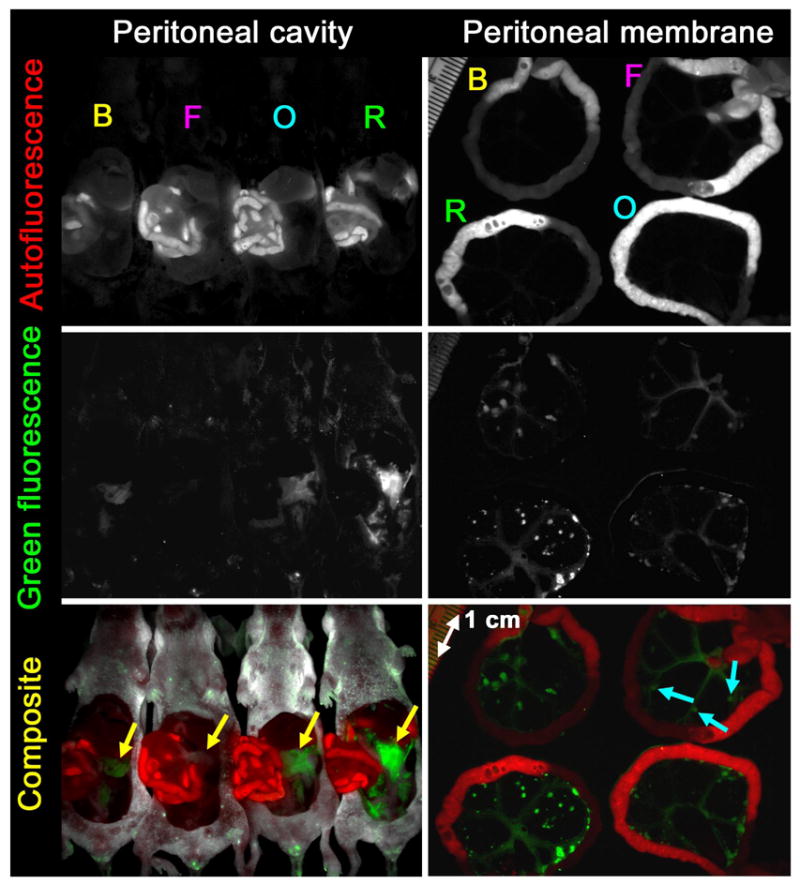
In vivo spectral fluorescence images of tumor-bearing mice 3h after intraperitoneal injection with Av-BODIPY (B), Av-FITC (F), Av-OreG (O) and Av-RhodG (R). Upper: Autofluorescence image. Middle: Green dye fluorescence image. Lower: Composite image (red: autofluorescence, green: green dye fluorescence). Spectral fluorescence image of the peritoneal cavities clearly visualized the disseminated tumor foci (yellow arrows) in mice incubated with Av-BODIPY, Av-OreG or Av-RhodG whereas Av-FITC failed to visualize tumor foci (yellow arrow) due to insufficient fluorescence intensity. Closeup image of the peritoneal membranes demonstrates peritoneal implants histologically confirmed to be metastatic deposits as small as 1 mm in diameter in all mice including Av-FITC injected mouse (blue arrows). The fluorescence intensity of Av-RhodG was the highest and that of Av-FITC was the lowest of all when compared visually.
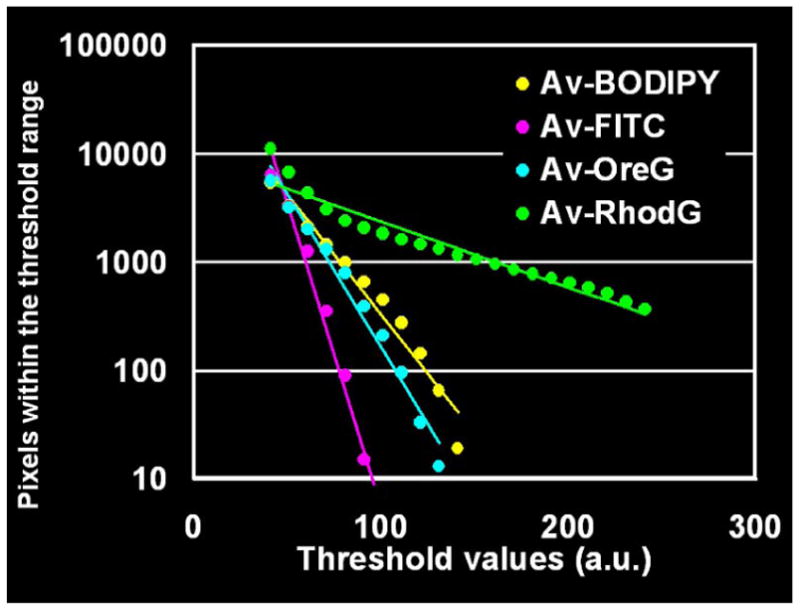
To make an objective comparison of fluorescence intensity of the peritoneal implants among the 4 dyes, an ROI encompassing the peritoneal membrane was drawn inside the intestine using the unmixed green fluorescence image (Figure 6a) and a histogram depicting the distribution of pixel intensities was created (Figure 6b). The dynamic range of signal intensity in the unmixed fluorescence image was set from 1 to 256 in arbitrary units (a.u.) and the threshold value (t) was changed from 41 to 241 in increments of 10, because the background signals, such as the normal peritoneal membrane excluding tumors and the nonfluorescent plate, were mostly less than 40 (a.u.). Then, the total number of pixels (N) within the threshold range was calculated as a function of threshold (t) and regression line was calculated in each ROI (Figure 6c). The correlation coefficients of Av-BODIPY, Av-FITC, Av-OreG and Av-RhodG were −0.982, −0.989, −0.989 and −0.965, respectively. The slopes of Av-BODIPY, Av-FITC, Av-OreG and Av-RhodG were −0.022, −0.056, −0.028 and −0.006, respectively. These results indicate that internalized Av-RhodG not only had the highest fluorescence and that above a specific threshold only Av-RhodG was capable of detecting tumors. Among the other fluorophore, Av-FITC had the lowest internalized fluorescence, and Av-BODIPY and Av-OreG had intermediate fluorescence in vivo. Contrary to the pre-injection fluorescence intensity where Av-FITC was the highest (Figure 2), internalized Av-RhodG demonstrated much higher fluorescence than Av-FITC in vivo indicating that the two agents had changed fluorescence properties after internalization. With the use of Av-RhodG, submillimeter SHIN3 ovarian cancer implants on the perioneum were depicted with intense green fluorescence, which was able to overwhelm the background auto fluorescence and allowed us to visualize tiny tumors in close-up views without the use of the wave length-resolved spectral imaging technique (Figure 7). Based on these in vitro and in vivo results, Av-RhodG was considered the most compelling choice for a cellular targeting optical probe.
Figure 6.
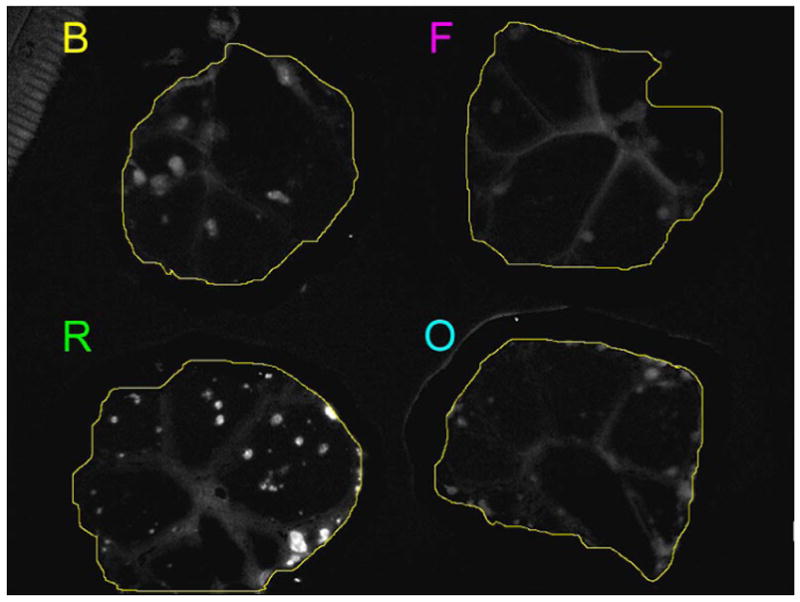
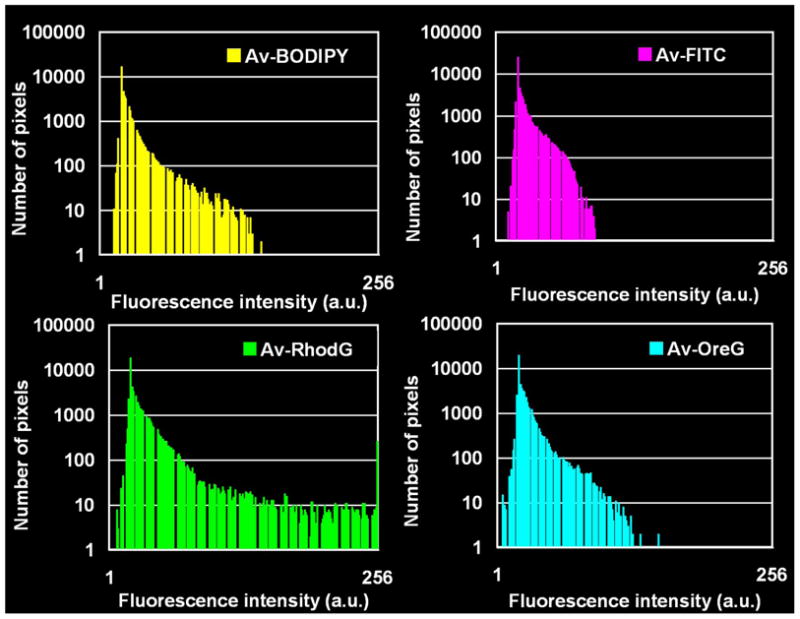
Semi-quantitative assessment of in vivo fluorescence intensity. a: ROI was drawn inside the intestine on the unmixed green fluorescence image (the same image as the unmixed green fluorescence image of Figure 5). B: Av-BODIPY. F: Av-FITC. O: Av-OreG. R: RhodG. b: Histogram of fluorescence intensity of an ROI drawn on each of the peritoneal membranes instilled with 4 green dyes, Av-BODIPY, Av-FITC, Av-OreG and RhodG. The dynamic range of the fluorescence intensity was split into equal-sized 256 bins (1–256). Then for each bin (horizontal axis), the number of pixels from the data set that fall into each bin (vertical axis) are counted. The shape of the plot distribution ≤40 in arbitrary unit (a.u.) is almost the same among the 4 histograms.
c: Regression lines of 4 green dyes. The regression lines were calculated from the data sets (fluorescence threshold values 41–241, total number of pixels within the threshold rage 10–100,000 in common logarithm). The slopes of Av-BODIPY, Av-FITC, Av-OreG and Av-RhodG were -0.022, −0.056, −0.028 and −0.006, respectively. Av-RhodG has the highest slope value consistent with it being the brightest fluorophore whereas, Av-FITC had the lowest slope value, and Av-BODIPY and Av-OreG were intermediate.
Figure 7.
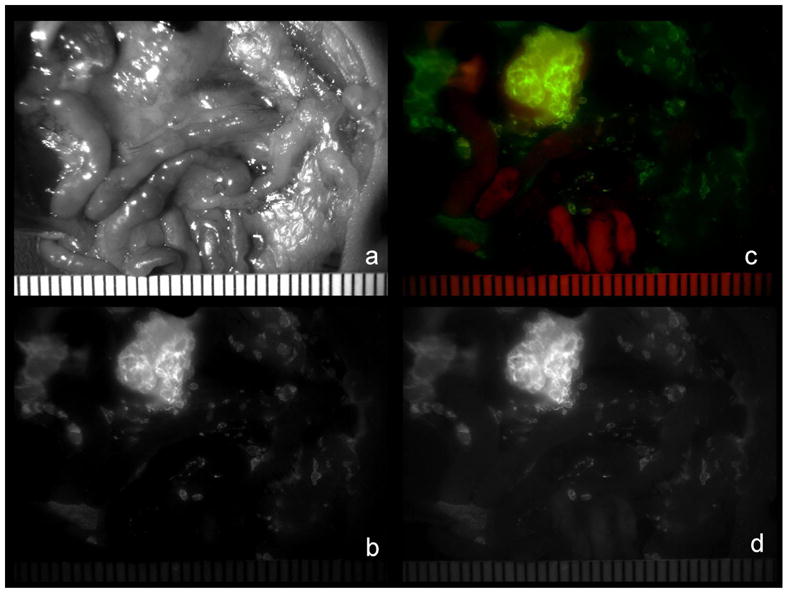
In vivo spectral fluorescence close-up images of a peritoneally disseminated SHIN3 ovarian cancer-bearing mouse 6h after intraperitoneal injection with Av-RhodG. A white light image (a), a green fluorescence image (b), a composite image of green fluorescence (green) and auto fluorescence (red) (c), and an uncalculated image obtained with a 545–555 nm band pass filter. Strong green florescence derived from Av-RhodG allows us to clearly show SHIN3 ovarian cancer submillimeter implants in an uncalculated image taken with a 545–555 nm band pass filter without the use of the wave length-resolved technique (d) as well as in a spectrally calculated green fluorescence image (b).
When the fluorescent dyes are conjugated with proteins, it is well-known that fluorescence emission of each dye is generally altered differently in each combination of dyes and proteins. Additionally, this study demonstrated that the in vivo characteristics of fluorophores, once internalized within cells, could be very different from their extracellular behavior. When four green dyes were conjugated with avidin, Av-BODIPY had the lowest signal intensity in the solution at physiological pH as well as at acidic pH. Av-FITC, which clearly had the highest signal intensity in the solution at physiological pH, demonstrated minimal fluorescence once it was internalized probably because of acidic pH in the endoplasmic vessicles. Conversely, Av-RhodG, which had modest fluorescence extracellularly, unchanged or even progressively increased in fluorescence once it had been internalized. Thus, in designing optical fluorescence probes it is important to consider whether the agent will end up intracellular or will remain in the extracellular environment.
Based on its biocompatibility and efficacy, fluorescein is the most feasible green dye for clinical translation since it has been used in clinical practice for the past three decades (9,10). Fluorescein emits in the green wavelength (fluorescence emission maximum around 520 nm) at physiological pH. However, fluorescein is known to decrease the emission signal at lower pH (11,12). Thus, when SHIN3 cancer cells were targeted by avidin conjugate (or another targeting ligand) conjugated to a fluorophore, the agent were internalized and catabolized. The low pH conditions found within the endosome and lysosome might rapidly compromise the signal of the fluorescein especially when we utilize a quickly internalizing ligand-receptor system such as avidin-lectin system. The other three dyes, BODIPY, OreG and RhodG, have been reported to emit photons in less pH-independent fashion than fluorescein. Therefore, we hypothesized that if pH-independent alternative dyes were used instead of pH-dependent fluorescein, we could achieve better targeting of the cancer due to the stronger signals from internalized reagents in cancer cells.
Non-FITC green fluorescent dyes were designed to resist the photobleaching associated with the fluorescein dyes (13,14). Since fluorescein is sensitive to photobleaching, RhodG and BODIPY-FL were synthesized as photobleaching resistant alternatives to fluorescein. However, to the best of our knowledge, the changes in fluorescence in vivo and their comprehensive comparison among green fluorophores in response to internalization have not been reported. In our results, RhodG is the most stuitable dye to be conjugated with quickly internalizing receptor-ligands or antibodies such as avidin or trastuzumab (Herceptin) (15), although the exact reason why Av-RhodG was brighter than Av-OreG or Av-BODIPY-FL in the endoplasmic vesicles is still unknown.
The rate at which Av-fluorophore complexes, such as Av-RhodG, are internalized and catabolized can be determined by examining the combined fluorescence of these agents. In theory, such agents could be used to measure internalization rates and the effect of various drugs and interventions on internalization could be measured using fluorescence to monitor the process (16,17).
CONCLUSION
Whereas Av-FITC demonstrated the brightest fluorescence in vitro, once the fluorophores were internalized Av-RhodG demonstrated the brightest fluorescence. Chemical change in the fluorophores induced by the low pH of the lysosome/endosome is one of the likely reasons. Therefore, RhodG is a suitable fluorescence dye for internalized in vivo spectral fluorescence imaging to detect cancer.
Acknowledgments
This research was supported by the Intramural Research Program of the NIH, National Cancer Institute, Center for Cancer Research.
This research was supported by the Intramural Research Program of the NIH, National Cancer Institute, Center for Cancer Research and funded in part with federal funds from the National Cancer Institute, National Institutes of Health, under contract N01-CO-12400. The content of this publication does not necessarily reflect the views or policies of the Department of Health and Human Services, nor does mention of trade names, commercial products, or organizations imply endorsement by the U.S. Government.
References
- 1.Yang M, Baranov E, Jiang P, Sun FX, Li XM, Li L, Hasegawa S, Bouvet M, Al-Tuwaijri M, Chishima T, Shimada H, Moossa AR, Penman S, Hoffman RM. Whole-body optical imaging of green fluorescent protein-expressing tumors and metastases. Proc Natl Acad Sci U S A. 2000;97:1206–1211. doi: 10.1073/pnas.97.3.1206. [DOI] [PMC free article] [PubMed] [Google Scholar]
- 2.Hoffman RM. The multiple uses of fluorescent proteins to visualize cancer in vivo. Nat Rev Cancer. 2005;5:796–806. doi: 10.1038/nrc1717. [DOI] [PubMed] [Google Scholar]
- 3.Bremer C, Ntziachristos V, Weissleder R. Optical-based molecular imaging: contrast agents and potential medical applications. Eur Radiol. 2003;13:231–243. doi: 10.1007/s00330-002-1610-0. [DOI] [PubMed] [Google Scholar]
- 4.Ntziachristos V, Bremer C, Weissleder R. Fluorescence imaging with near-infrared light: new technological advances that enable in vivo molecular imaging. Eur Radiol. 2003;13:195–208. doi: 10.1007/s00330-002-1524-x. [DOI] [PubMed] [Google Scholar]
- 5.Ciardella AP, Prall FR, Borodoker N, Cunningham ET., Jr Imaging techniques for posterior uveitis. Curr Opin Ophthalmol. 2004;15:519–30. doi: 10.1097/01.icu.0000144386.05116.c5. [DOI] [PubMed] [Google Scholar]
- 6.Hama Y, Urano Y, Koyama Y, Kamiya M, Bernardo M, Paik RS, Krishna MC, Choyke PL, Kobayashi H. In vivo spectral fluorescence imaging of submillimeter peritoneal cancer implants using a lectin-targeted optical agent. Neoplasia. 2006;8:607–612. doi: 10.1593/neo.06268. [DOI] [PMC free article] [PubMed] [Google Scholar]
- 7.Hama Y, Urano Y, Koyama Y, Choyke PL, Kobayashi H. Targeted optical imaging of cancer cells using lectin-binding BODIPY conjugated avidin. Biochem Biophys Res Commun. 2006 doi: 10.1016/j.bbrc.2006.07.169. (in press; published on the Web site on August 4, 2006. http://www.sciencedirect.com/science/journal/0006291X) [DOI] [PubMed]
- 8.Imai S, Kiyozuka Y, Maeda H, Noda T, Hosick HL. Establishment and characterization of a human ovarian serous cystadenocarcinoma cell line that produces the tumor markers CA-125 and tissue polypeptide antigen. Oncology. 1990;47:177–184. doi: 10.1159/000226813. [DOI] [PubMed] [Google Scholar]
- 9.Brancato R, Trabucchi G. Fluorescein and indocyanine green angiography in vascular chorioretinal diseases. Semin Ophthalmol. 1998;13:189–198. doi: 10.3109/08820539809056052. [DOI] [PubMed] [Google Scholar]
- 10.Kelley JS. Fluorescein angiography: techniques and toxicity. Int Ophthalmol Clin. 1977;17:25–33. doi: 10.1097/00004397-197701720-00005. [DOI] [PubMed] [Google Scholar]
- 11.Chen Y, Arriaga EA. Individual acidic organelle pH measurements by capillary electrophoresis. Anal Chem. 2006;78:820–826. doi: 10.1021/ac051513x. [DOI] [PubMed] [Google Scholar]
- 12.Sklar LA, Jesaitis AJ, Painter RG, Cochrane CG. Ligand/receptor internalization: a spectroscopic analysis and a comparison of ligand binding, cellular response, and internalization by human neutrophils. J Cell Biochem. 1982;20:193–202. doi: 10.1002/jcb.240200210. [DOI] [PubMed] [Google Scholar]
- 13.Lichtman JW, Conchello JA. Fluorescence microscopy. Nat Methods. 2005;2:910–919. doi: 10.1038/nmeth817. [DOI] [PubMed] [Google Scholar]
- 14.Terasaki M. Fluorescent labeling of endoplasmic reticulum. Methods Cell Biol. 1989;29:125–135. doi: 10.1016/s0091-679x(08)60191-0. [DOI] [PubMed] [Google Scholar]
- 15.Coussens L, Yang-Feng TL, Liao YC, Chen E, Gray A, McGrath J, Seeburg PH, Libermann TA, Schlessinger J, Francke U, Levinson A, Ullrich A. Tyrosine kinase receptor with extensive homology to EGF receptor shares chromosomal location with neu oncogene. Science. 1985;230:1132–1139. doi: 10.1126/science.2999974. [DOI] [PubMed] [Google Scholar]
- 16.Padari K, Saalik P, Hansen M, Koppel K, Raid R, Langel U, Pooga M. Cell transduction pathways of transportans. Bioconjug Chem. 2005;16:1399–13410. doi: 10.1021/bc050125z. [DOI] [PubMed] [Google Scholar]
- 17.Marecos E, Weissleder R, Bogdanov A., Jr Antibody-mediated versus nontargeted delivery in a human small cell lung carcinoma model. Bioconjug Chem. 1998;9:184–191. doi: 10.1021/bc970146w. [DOI] [PubMed] [Google Scholar]


