

Abstract
The dynamic processes impacting the size distributions of lipid-encapsulated microbubbles formed by flow-focusing were observed by video optical microscopy. Parameters studied included the filling gas, gas saturating the surrounding solution, and microbubble size (initial size 2–12 μm) to simulate typical laboratory conditions. Typically, dissolution or growth, followed by Ostwald ripening at a collection cover glass, were observed and quantified. However, in the case of small nitrogen-filled microbubbles surrounded by an air-saturated solution, Ostwald ripening was avoided for at least 9 h. These bubbles had a final size distribution of 1.5 ± 0.1 μm. This work suggests that lipid-encapsulated microbubbles formed by flow-focusing should be given sufficient time to reach a terminal size before coming into contact with each other. These long-lived mondisperse microbubbles should be of interest in ultrasound contrast agents, microfabrication, food, and research applications.
Introduction
The flow-focusing technique can be used to generate micrometer-scale gas bubbles in liquid (microbubbles) with a monodisperse size distribution.1–2 This technique utilizes the focusing of a gas stream by a liquid stream driven by a pressure drop. The gaseous thread breaks at the orifice to release a bubble into the outlet channel. The size of these microbubbles can be controlled primarily by gas and liquid flowrates and the orifice size. Lipid-encapsulated microbubbles, formed by flow-focusing, were developed in our previous studies.3–5 Lipid coatings are useful because they can reach a near zero surface tension when maximally compressed. However, lipid coatings are not maximally compressed when microbubbles are initially formed by any method, including flow-focusing.4,6–7 Therefore, a Laplace overpressure exists that can drive gas exchange between microbubbles and the accompanying process of disproportionation (Ostwald ripening) (i.e., polydispersity). In addition, gas exhange with the surrounding solution can result in growth or shrinkage of microbubbles and contribute to the Ostwald ripening process.
Maintenance of a monodisperse microbubble population should benefit many scientific and technological applications of microbubbles. Medical applications of microbubbles include ultrasound contrast agents (UCAs), targeted UCAs, blood substitutes, targeted drug and gene delivery vehicles, and clot destruction.8 We have previously demonstrated9 by experiment that monodisperse lipid-encapsulated microbubble UCAs (diameter distribution of ~3.7 ± 0.2 μm) provide an improvement in signal correlation during ultrasound imaging as compared to polydisperse UCAs. Monodisperse ultrasound contrast agents can have a substantially greater percentage of their population optimized for imaging due to their nearly identical echo signatures. In other applications, the surfaces of microbubbles of a chosen size could serve as microtemplates, microsubstrates, or micro–catalyst supports.10–12 Maintenance of monodispersity ensures that the characteristics of the assembly or process are maintained with time and space. Microbubbles have been shown to improve a range of desired properties in a dispersed food system, including texture, digestibility, and flavor intensity.13–15 These properties could be controlled and maintained during food production by monodisperse microbubbles with a long-term stability produced by flow-focusing. Research applications include studies of the rheological and optical properties of dispersions or films of monodisperse microbubbles with uniform coatings.
In this work, our goal was to be able to maintain, for hours, a monodisperse size distribution of lipid-encapsulated microbubbles formed by flow-focusing. We varied the filling gas, gas saturating the surrounding solution, and microbubble size to represent typical laboratory conditions used in forming microbubbles and found a condition that preserved the monodispersity that was present as microbubbles exited the flow-focusing orifice. Growth and Ostwald ripening accompanied other conditions that were tried presumably through gas exchange with the solution and between microbubbles. High-speed optical microscopy was primarily utilized in this work to track dissolution, growth, and Ostwald ripening of individual microbubbles and microbubble populations. On the basis of our results, we discuss how to avoid Ostwald ripening and growth in microbubbles formed by flow-focusing for use as UCAs or other technological applications.
Materials and Methods
Flow-Focusing Chamber
Monodisperse microbubbles on the order of 1–12 μm in diameter were produced via a flow-focusing device made of PDMS. Microfabrication of the PDMS chamber with 35 μm and 50 μm channel widths for gas and liquid, respectively, and a 10 μm orifice diameter was previously illustrated by Hettiarachchi et al.5 The channels were filled with water from a Milli-Q system (Millipore, Billerica, MA) immediately after sealing to ensure the hydrophilic character of the walls of microchannels. Nitrogen (Air Arc Supply, Inc., Sacramento, CA) or perfluorobutane (PFB) (SynQuest, Alachua, FL) gas was introduced from a pressurized cylinder via a low-pressure regulator accurate within 0.2 psi. A continuous liquid flowrate was provided by a high precision Harvard Apparatus (Holliston, MA) syringe pump calibrated to within ±0.35%.
Microbubble Preparation
The lipids, 1,2-distearoyl-sn-glycero-3-phosphocholine (DSPC) and 1,2-distearoyl-sn-glycero-3-phos-phoethanolamine-N-[methoxy(polyethyleneglycol)-2000] (DSPE-PEG2000) were purchased from Avanti Polar Lipids (Alabaster, AL). These lipids were dissolved and mixed in chloroform, dried on the wall of a vial by nitrogen gas and a vacuum oven, and then resuspended in 1 vol % glycerin (Sigma-Aldrich, St. Louis, MO), 1 vol % propylene glycol (Sigma-Aldrich, St. Louis, MO), and 98 vol % Milli-Q water. Resuspension was aided by placing the vial in a sonication bath for 30 min, which was heated up to 60 °C. The resulting lipid solution contained 0.5 mg/mL DSPC with 90 mol % DSPC and 10 mol % DSPE-PEG2000. The fluorescent probe, 3H-indolium,2-[3-(1,3-dihydro-3,3-dimethyl-1-octadecyl-2H-indol-2-ylidene)-1-propenyl]-3,3-dimethyl-1-octadecyl-perchorate (DiI), was purchased from Molecular Probes (Eugene, OR). When fluorescence imaging was performed, DiI was added to the DSPC/DSPE-PEG2000 solution at a concentration of 0.4 μL/mL before the production of microbubbles.
Each lipid solution prepared for making air-surrounded microbubbles was stirred overnight in a 1 atm air environment to ensure air saturation. Each lipid solution prepared for making PFB-surrounded microbubbles was first degassed by being placed in a vacuum oven at 25 °C in Hg overnight (Microprocessor-Controlled Vacuum Oven, VWR International, So. Plainfield, NJ). Then, the lipid solution was put into three or four 2 mL capped vials and stirred continuously. A 20 gauge 1 in. needle attached by a valve to provide vacuum (25 in. Hg) or pressure regulated (~5 psi) PFB was inserted through the cap of each vial. The tip of the needle remained well above the surface of the lipid solution. Each vial was under vacuum for 30 min followed by 5 cycles of vacuum for 5 s, filling the vial head space continually with PFB for 1 min, and waiting for 5 min. The desired gas-saturated lipid solution was placed into the syringe pump attached to the flow-focusing chamber. As the gas and liquid flows were initiated, the microbubbles exited the flow-focusing chamber into a ~2 mm gap between two horizontal glass microscope cover glasses and were held between this gap by surface tension after about a minute. Therefore, the microbubbles were surrounded by the desired gas-saturated solution continuously.
Size Characterization and Stabilization
A high-speed camera system (APS-RX, Photron, Inc., San Diego, CA) connected to an inverted microscope (IX71, Olympus, Tokyo) was used to study the microbubbles exiting the flow-focusing chamber as well as microbubble dissolution, growth, and Ostwald ripening. Size distribution data were analyzed by the Scion Image program. A minimum of 500 microbubbles was analyzed for distribution data using the Scion Image program. For 1 μm scale bubbles observed in one case, more accurate size data were obtained by an Accusizer (Particle Sizing Systems, Santa Barbara, CA). Diameter data were presented in terms of mean ± standard deviation.
Fluorescence images were captured with a Cascade camera (512b, Photometrics, Tucson, AZ) on a microscope (IV600L, Mikron Instruments, San Diego, CA) and processed with SimplePCI (C-Imaging, Cranberry Township, PA).
Results
Microbubbles were encapsulated in DSPC and DSPE-PEG2000 using the flow-focusing device. This shell composition is similar to the composition used for clinical ultrasound contrast agents and those described by other researchers.4,6,8,16–17 We monitored the diameter of microbubbles as they exited the orifice of the flow-focusing chamber and with time after rising to a microscope cover glass approximately 2 mm above the exit orifice. The gas and liquid flows were stopped during the timed studies. At least three separate runs were observed for each gas combination with similar results for the same combination. Presented next are results from one of the runs for each combination.
Nitrogen-Filled Microbubbles–Air-Saturated Solution (Nitrogen–Air)
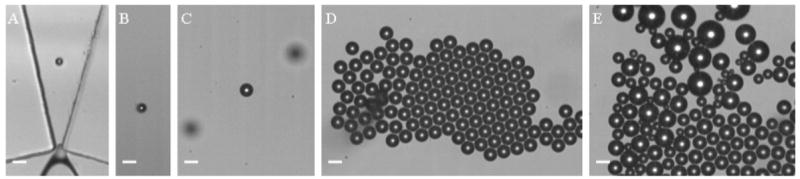
The lipid solution was saturated with air, and nitrogen was used as the microbubble filling gas. Two differently sized microbubbles were produced using the flow-focusing device. The smaller sized microbubbles were produced at a liquid flowrate of 30 μL/min and a gas pressure of 2.6 psi. The initial diameter of microbubbles as they exited the orifice was 5.0 ± 0.2 μm by analysis of images such as the one shown in Figure 1A. As recorded in Figure 1B,C, the microbubble diameter decreased significantly as the bubbles rose to the cover glass. When each microbubble reached the cover glass, a diameter of approximately 1.5 μm was measured. Figure 1D,E demonstrates the mono-dispersity of these microbubbles, taken after microbubbles collected on the cover glass for approximately 1 min. As can be seen in Figure 2, the size distribution is stable over a period of 9 h: 1.7 ± 0.2 μm at 0 h and 1.8 ± 0.2 μm at 9 h. Therefore, the microbubbles underwent dissolution to their terminal size as they were rising to the cover glass. These microbubbles were harvested after the 9 h observation period to perform sizing by a particle sizer (Accusizer) accurate to ±0.1 μm. The microbubble size distribution reported by the Accusizer was 1.5 ± 0.1 μm (Figure 3).
Figure 1.
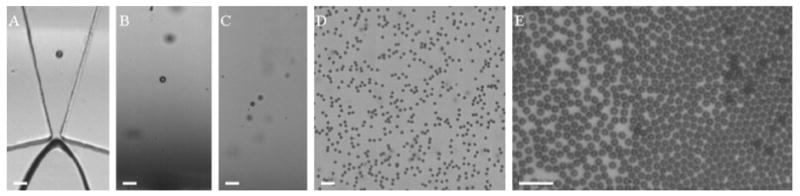
(A) Smaller nitrogen–air lipid-encapsulated microbubbles exiting the orifice of the flow-focusing device, (B and C) microbubbles rising to the microscope glass while dissolving, (D) microbubbles under the cover glass, 20× objective, and (E) microbubbles under the cover glass, 50× objective. Scale bar represents 10 μm.
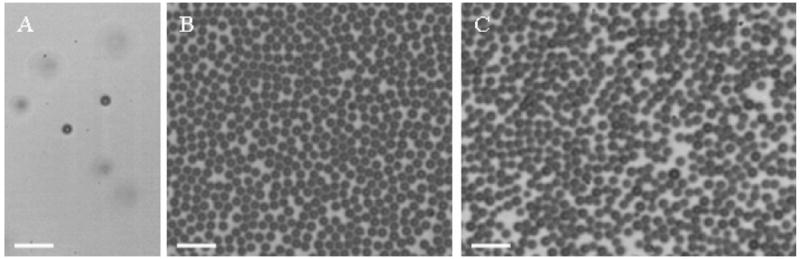
Figure 2.
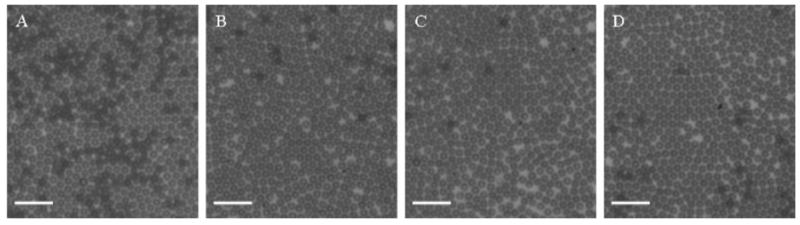
Microscope images of nitrogen–air lipid-encapsulated microbubbles recorded at different times showing stability: (A) t = 0, (B) t = 3 h, (C) t = 6 h, and (D) t = 9 h.
Figure 3.
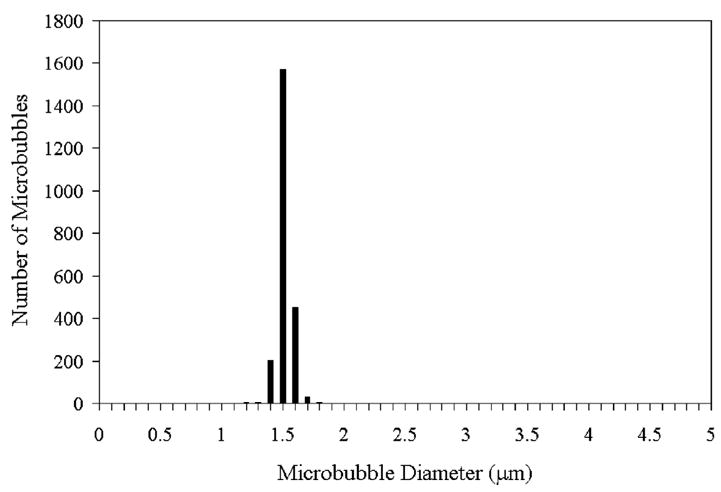
Size distribution data taken by the accusizer of nitrogen–air lipid-encapsulated microbubbles 9 h after the production. The mean diameter was 1.5 μm with a standard deviation of 0.1 μm.
The larger sized microbubbles were produced at a liquid flowrate of 50 μL/min and a gas pressure of 3.2 psi. The initial diameter of microbubbles as they were exiting the orifice was 12.0 ± 0.2 μm (Figure 4A). Dissolution was observed for all of the microbubbles during their rise to the cover glass as demonstrated in Figure 4B by the smaller bubble size in comparison to Figure 4A. However, microbubble growth was seen for some microbubbles after they reached the microscope cover glass, while most shrunk to a terminal size of ±6 μm. Simultaneous growth and shrinkage in a population under surface tension is typical of Ostwald ripening.24–25 The Ostwald ripening occurred rapidly as demonstrated in Figure 4C, taken after collecting microbubbles on the cover glass for approximately 1 min. There is one sharp peak with a size distribution of 6.0 ± 0.2 μm followed by a wide size distribution of 16.4 ± 3.2 μm. A total of 48 s later as demonstrated in Figure 4D, the higher peak had shifted to 21.7 ± 5.4 μm. We could quite easily eliminate the larger microbubbles, as shown in Figure 4D, by tilting the cover glass slightly, allowing these larger bubbles to rise. Thereafter, a monodisperse size distribution of 6.0 ± 0.2 μm was obtained in this region and remained the same for several hours of monitoring.
Figure 4.
(A) Larger nitrogen–air lipid-encapsulated microbubbles exiting the orifice, (B) microbubbles rising to the microscope cover glass while dissolving, (C) microbubbles under the cover glass, (D) microbubbles under the cover glass after 48 s, and (E) microbubbles under the cover glass after the large bubbles rose. Scale bar represents 10 μm.
Fluorescence microscopy images of these monodisperse ~6 μm microbubbles were taken to observe the coating on the microbubble surface. Using a lipid dye, DiI, the coexistence of domains and expanded bright regions was observed on the microbubbles (Figure 5). For polydisperse microbubbles formed by shaking in the same lipid solution, a similar surface observation has been proven by lipid labeling to be DSPC-rich domains in coexistence with surrounding regions rich in DSPE-PEG2000.6
Figure 5.
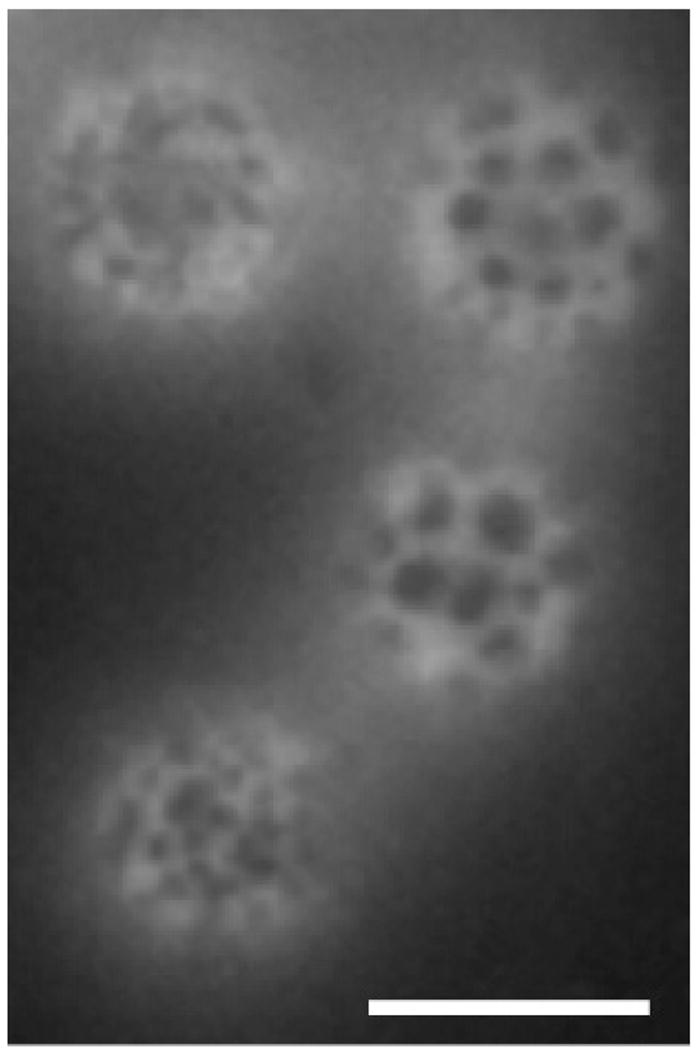
Fluorescent image of DSPC-PEG2000-coated nitrogen-filled microbubbles. Scale bar represents 5 μm.
PFB-Filled Microbubbles–Air-Saturated Solution (PFB–Air)
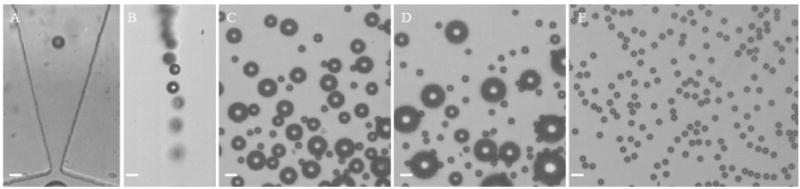
The lipid solution was saturated with air, and PFB was used as the microbubble filling gas. In comparison to air, heavy gases such as PFB are less water-soluble and possess a higher mass transfer resistance. Heavy gases are a useful option to decrease the transport of filling gas to the surroundings in medical applications.18–20 Two differently sized microbubble populations were studied. Their behaviors were generally the same, and thus, only results for the smaller sized population will be given. Microbubbles were produced at a liquid flowrate of 30 μL/min and a gas pressure of 2.6 psi. The initial diameter of microbubbles as they exited the orifice was 5.0 ± 0.2 μm by analysis of images such as the one shown in Figure 6A. As recorded in Figure 6B,C, the microbubble diameter increased as the bubbles rose to the cover glass, in opposition to microbubbles of the same size filled with nitrogen discussed previously. After collecting microbubbles on the cover glass for approximately 1 min, a diameter of 10.0 ± 0.2 μm was measured by the analysis of images such as is demonstrated in Figure 6D. Although the bubbles at the cover glass began with this monodisperse size distribution, they quickly underwent Ostwald ripening and continued to grow on average, although more slowly. The size distribution was noticeably polydisperse in a couple of minutes as illustrated in Figure 6E (size distribution of 13.2 ± 6.9 μm), which was taken 3 min after Figure 6D.
Figure 6.
(A) PFB–air lipid-encapsulated microbubbles exiting the orifice, (B and C) microbubbles rising to the microscope cover glass while growing, (D) microbubbles under the cover glass, and (E) microbubbles under the cover glass after 3 min. Scale bar represents 10 μm.
PFB-Filled Microbubbles–PFB-Saturated Solution (PFB–PFB)
The lipid solution was saturated with PFB, and PFB was used as the microbubble filling gas. Microbubbles were produced at a liquid flowrate of 30 μL/min and a gas pressure of 2.0 psi. The initial diameter of microbubbles as they exited the orifice was 2.3 μm ± 0.2 μm as shown in Figure 7A. This size was chosen to achieve a similar size of microbubbles at the microscope cover glass in comparison to the first nitrogen–air case. The microbubble diameter was decreasing as the bubbles rose to the cover glass. After collecting microbubbles on the cover glass for approximately 1 min, a diameter of 1.8 ± 0.2 μm was measured by the analysis of images such as demonstrated in Figure 7B. Very slow Ostwald ripening was observed for this population. At 120 min, approximately 10% of the bubbles had shrunk to a size of approximately 0.9 μm, likely to be the terminal size based upon extension of the results for nitrogen–air. Another 10% of the population had diameters centered at approximately 3.3 μm. Overall, the bubbles had shrunk in size (1.6 ± 0.8 μm), indicating that dissolution was not complete when these bubbles reached the microscope cover glass.
Figure 7.
(A) PFB–PFB lipid-encapsulated microbubbles rising after exiting the orifice, (B) microbubbles under the cover glass, and (C) microbubbles under the cover glass after 120 min. Scale bar represents 10 μm.
Discussion
By imaging lipid-encapsulated microbubbles formed by flow-focusing, we were able to observe the dynamic processes impacting the size distribution. After the microbubbles exited the orifice of the flow-focusing chamber, they all underwent an immediate size change through gas-exchange with the surrounding solution. Since the microbubbles were rising, they remained far from each other and did not undergo obvious gas exchange between microbubbles that would have resulted in Ostwald ripening and accompanying polydispersity. Nitrogen–air and PFB–PFB microbubbles dissolved under Laplace overpressure. However, PFB–air microbubbles grew despite concentration gradients that should have driven PFB out of and air into the microbubbles. The net transport was dominated by air transport into the microbubbles because the high molecular weight PFB has a higher mass transfer resistances and lower water solubility (solubility 0.021 mol/m3) as compared to air (solubilities of N2 and O2 are 0.63 and 1.32 mol/m3, respectively) at room temperature.20 Lipid-coated PFB-filled microbubbles can be used as blood substitutes with attractive oxygen carrying capabilities.8 We expect that similar rapid bubble expansion would be present in the blood where oxygen pressures can reach 1 atm.20
For the nitrogen–air case, the microbubbles that had dissolved to a uniform size remained at that size during the duration of viewing (hours). This behavior indicates that the microbubble–water interface had reached zero or near zero surface tension, thereby equalizing the internal and external pressure and halting the dissolution. Indeed, it has been observed that a monolayer of the binary mixture used here can be compressed to a high surface pressure (low surface tension).21 The small nitrogen–air microbubbles reached this terminal size while rising to the cover glass, and this characteristic was very important for prolonged monodispersity as will be discussed next. Because of their small size and filling with nitrogen, these microbubbles underwent rapid dissolution22–23 (Laplace pressure is inversely proportional to radius) and rose more slowly than the larger nitrogen–air microbubbles. The microbubble diameter at the terminal size (~1.5 μm) was similar to commercially available lipid-encapsulated microbubble contrast agents formed by shaking with more than an order of magnitude smaller standard deviation (±0.1 μm).
These small nitrogen–air microbubbles maintained the same diameter and remained monodisperse (diameter of 1.5 ± 0.1 μm) after rising to the cover glass where they were in close proximity with each other. Again, this observation is consistent with the monolayer shells of these microbubbles being at maximum compression (i.e., near zero surface tension) thereby near zero Laplace overpressure. Dissolution that results in local areas of supersaturation causing some microbubbles to grow simply was not occurring. These microbubbles may have maintained their monodispersity for significantly longer times than we monitored (9 h), barring chemical degradation of the lipids.
The remainder of the microbubble populations underwent Ostwald ripening24–25 after rising to a cover glass, where microbubbles were in close proximity. Here, microbubbles that continued to shrink or grow as they reached the cover glass formed locally supersaturated or saturated regions, respectively, causing neighboring bubbles to grow or shrink. In the case of the larger nitrogen–air microbubbles and small PFB–PFB microbubbles a longer rise-time, a taller chamber could be used to give the microbubbles an opportunity to dissolve to their terminal diameter before reaching the cover glass. For the PFB–PFB microbubbles, dissolution occurred much more rapidly when rising as compared to when they were stagnant at the cover glass. Presumably, the difference is from convective versus diffusive transport, respectively. We expect that a chamber of reasonable height could be designed to achieve the necessary rise-time for dissolution to a terminal size. For growing PFB–air microbubbles, a longer rise-time could have also been used to allow the microbubbles to reach their maximum size when their internal pressures equalized the external pressure. However, microbubbles would no longer possess a small size and low surface tension resistance to Ostwald ripening from small gradients in external pressure.
Acknowledgments
We are grateful to Prof. Katherine Ferrara and Prof. Alex Revzin for the use of their equipment and facilities at UC Davis. We also thank Prof. Mark Borden (UC Davis and Columbia University) for his thoughtful discussions and helpful insight regarding microbubble development. Funding for this work was provided by the National Institutes of Health through the NIH Roadmap for Medical Research (Grant R21 EB005325) and the Office of Naval Research Hydromechanics Program (Grant N000140610187).
References
- 1.Ganan-Calvo AM, Gordillo JM. Phys Rev Lett. 2001;87:274501/1–274501/4. doi: 10.1103/PhysRevLett.87.274501. [DOI] [PubMed] [Google Scholar]
- 2.Garstecki P, Ganan-Calvo AM, Whitesides GM. Bull Pol Acad Sci Technol Sci. 2005;53:361–372. [Google Scholar]
- 3.Talu E, Hettiarachchi K, Nguyen H, Lee AP, Powell RL, Longo ML, Dayton PA. IEEE Ultrasonics Proc. 2006:1568–1571. [Google Scholar]
- 4.Talu E, Lozano MM, Powell RL, Dayton PA, Longo ML. Langmuir. 2006;22:9487–9490. doi: 10.1021/la062095+. [DOI] [PMC free article] [PubMed] [Google Scholar]
- 5.Hettiarachchi K, Talu E, Longo ML, Dayton PA, Lee AP. Lab Chip. 2007;7:463–468. doi: 10.1039/b701481n. [DOI] [PMC free article] [PubMed] [Google Scholar]
- 6.Borden MA, Martinez GV, Ricker J, Tsvetkova N, Longo ML, Gillies RJ, Dayton PA, Ferrara KW. Langmuir. 2006;22:4291–4297. doi: 10.1021/la052841v. [DOI] [PubMed] [Google Scholar]
- 7.Borden MA, Pu G, Runner GJ, Longo ML. Colloids Surf, B. 2004;35:209–223. doi: 10.1016/j.colsurfb.2004.03.007. [DOI] [PubMed] [Google Scholar]
- 8.Unger EC, Porter T, Culp W, Labell R, Matsunaga T, Zutshi R. Adv Drug Delivery Rev. 2004;56:1291–1314. doi: 10.1016/j.addr.2003.12.006. [DOI] [PubMed] [Google Scholar]
- 9.Talu E, Hettiarachchi K, Zhao S, Powell RL, Lee AP, Longo ML, Dayton PA. Mol Imaging. 2007 in press. [PMC free article] [PubMed] [Google Scholar]
- 10.Hozumi A, Kojima S, Nagano S, Seki T, Shirahata N, Kameyama T. Langmuir. 2007;23:3265–3272. doi: 10.1021/la061405l. [DOI] [PubMed] [Google Scholar]
- 11.Cannon AH, Allen AC, Graham S, King WP. J Micromech Microeng. 2006;16:2554–2563. [Google Scholar]
- 12.Qi P, Vermesh O, Grecu M, Javey A, Wang Q, Dai H, Peng S, Cho KJ. Nano Lett. 2003;3:347–351. doi: 10.1021/nl034010k. [DOI] [PubMed] [Google Scholar]
- 13.Campbell GM. Bubbles in Food. Eagan Press; St. Paul, MN: 1999. [Google Scholar]
- 14.Lau CK, Dickinson E. Food Hydrocolloids. 2005;19:111–121. [Google Scholar]
- 15.Wildmoser H, Scheiwiller J, Windhab EJ. Lebensm-Wiss Technol. 2004;37:881–891. [Google Scholar]
- 16.Klibanov AL. Adv Drug Delivery Rev. 1999;37:139–157. doi: 10.1016/s0169-409x(98)00104-5. [DOI] [PubMed] [Google Scholar]
- 17.Villanueva FS, Wagner WR, Wannan MA, Narula J. Cardiol Clin. 2004;22:283–298. doi: 10.1016/j.ccl.2004.02.008. [DOI] [PubMed] [Google Scholar]
- 18.Peyman GA, Schulmann JA. Vitreous Substitutes. Appleton and Lange; East Norwalk, CT: 1995. [Google Scholar]
- 19.Schneider M, Arditi M, Barrau M, Brochot J, Broillet A, Ventrone R. Invest Radiol. 1995;30:451–457. doi: 10.1097/00004424-199508000-00001. [DOI] [PubMed] [Google Scholar]
- 20.Riess JG. Angew Chem, Int Ed. 2003;42:3218–3235. doi: 10.1002/anie.200200550. [DOI] [PubMed] [Google Scholar]
- 21.Chou TH, Chu IM. Colloids Surf, B. 2003;27:333–344. [Google Scholar]
- 22.Borden MA, Longo ML. Langmuir. 2002;18:9225–9233. [Google Scholar]
- 23.Liebermann L. J Appl Phys. 1956;28:205–211. [Google Scholar]
- 24.Kabalnov AS. Langmuir. 1994;10:680–684. [Google Scholar]
- 25.Taylor P. Adv Colloid Interface Sci. 1998;75:107–163. [Google Scholar]