
FIGURE 2.
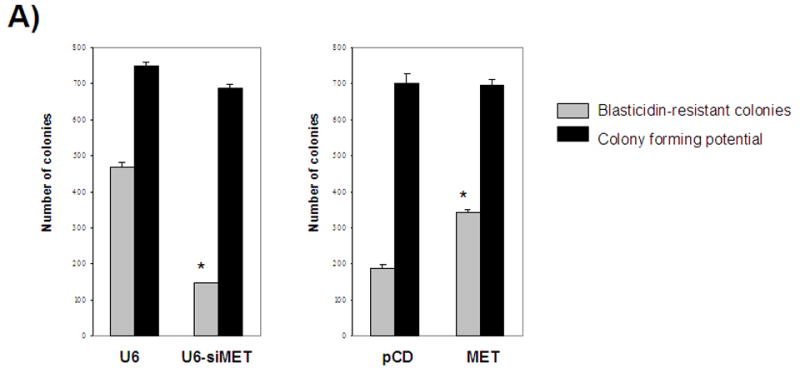
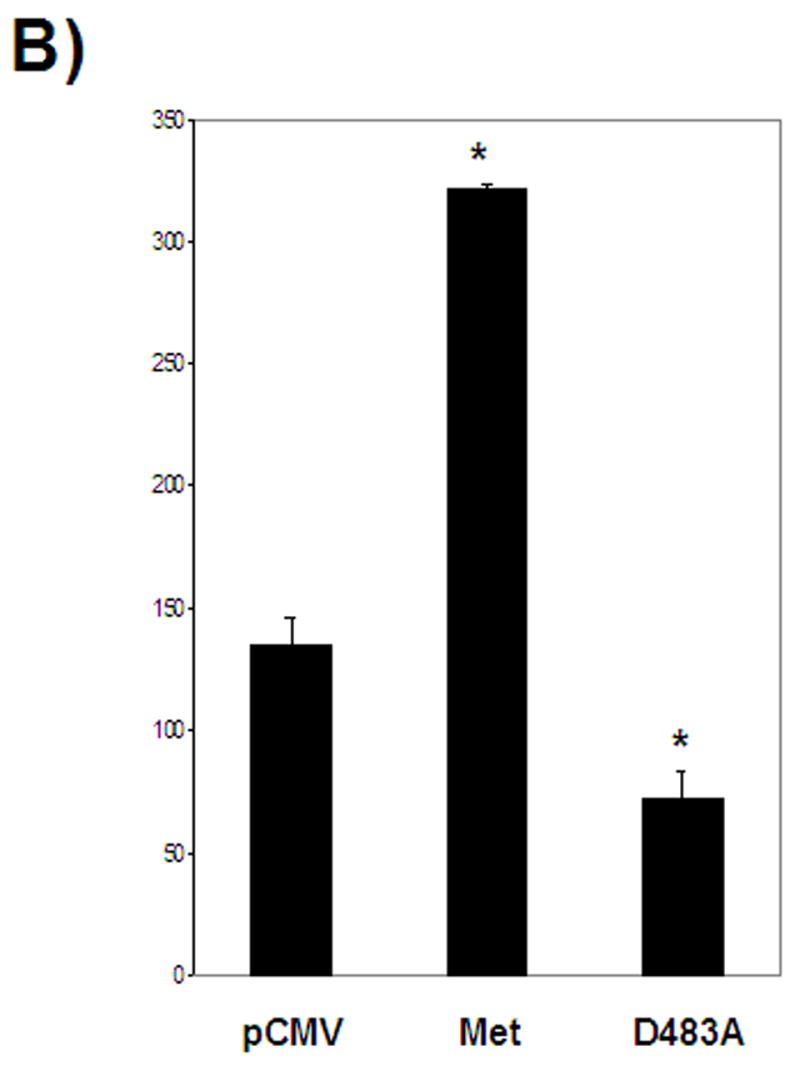
A- Selection for lentiviral genomic integration with blasticidin indicates a correlation between Metnase expression and the number of blasticidin-resistant colonies. B- Mutation of an essential residue in the transposase domain leads to decreased viral integration compared to wild-type Metnase U6- vector control, siMET- Metnase under-expressors, pCD- vector control, MET- Metnase over-expressors, D438A- over-expression of Metnase mutated in the transpose domain. *- statistically significant at p<0.05. All cell lines have the same colony forming potential without blasticidin selection.