

Abstract
Atherosclerosis is a leading cause of death in the U.S. Because there is a potential to prevent coronary and arterial diseases through early diagnosis, there is a need for methods to image arteries in the sub-clinical stage as well as clinical stage using various non-invasive techniques, including Magnetic Resonance Imaging (MRI). We describe a development of a novel MRI contrast agent targeted to plaques that will allow imaging of lesion formation. The contrast agent is directed to macrophages, one of the earliest components of developing plaques. Macrophages are labeled through the macrophage scavenger receptor A, a macrophage specific cell surface protein, using an MRI contrast agent derived from scavenger receptor ligands. We have synthesized and characterized these contrast agents with a range of relaxivities. In vitro studies show that the targeted contrast agent accumulates in macrophages and solution studies indicate that micromolar concentrations are sufficient to produce contrast in an MR image. Cell toxicity and initial biodistribution studies indicate low toxicity, no detectable retention in normal blood vessels, and rapid clearance from blood. The promising performance of this contrast agent targeted towards vascular inflammation opens doors to tracking of other inflammatory diseases such as tumor immunotherapy and transplant acceptance using MRI.
Keywords: Atherosclerosis, restenosis, mal-BSA, Gd-DOTA, magnetic resonance imaging, inflammation
Introduction
Atherosclerosis-related diseases are a leading cause of death and impairment in the United States. According to the American Heart Association cardiovascular disease affects over 70 million people and was the cause of 38.0 percent of all deaths in 2002. Over half of these deaths were due to coronary disease, which is primarily diagnosed by x-ray angiography. Researchers are investigating use of MRI angiography as a nonionizing alternative.(1, 2) Non-targeted roentgen graphic visualization of the blood vessels after injection of a radioopaque substance, or MR angiogram with blood pool contrast agents can reveal only the vessel lumen and silhouette of lesions that impinge upon the lumen.(3) The appreciation that a considerable atherosclerosis burden, including plaques vulnerable to rupture or susceptible to erosion, can be accommodated in the vessel wall without impingement on the lumen has lead to a new imperative for direct plaque imaging.(4) In fact, 4-16% of patients suffer from “silent” lesions that do not restrict blood flow but are still vulnerable to rupture(5).
One of the earliest cellular components of plaques are macrophage(6). Macrophages are attracted to lesions where they take up and accumulate oxidized and other modified low density lipoproteins (LDLs) from the bloodstream. Over time they become filled with lipid-laden droplets so as to appear foamy under microscope, and they are then termed “foam cells”.(2) The formation of foam cells is a key event in atherogenesis and the massive uptake of modified LDLs by macrophages is believed to be mediated by scavenger receptors.(7, 8) The scavenger receptors are a diverse family of receptors, one of the best studied has been the class A receptor(9-11). SR-A is primarily expressed by mature macrophages, including Kupffer cells, and alveolar, splenic and some other tissue macrophages. Class A scavenger receptors are present in high numbers on macrophages, and in vessel lumens are unique to macrophages—they are not expressed by endothelial cells lining normal vessels.(12, 13) SR-A is expressed on the endothelial lining of the liver, adrenal sinusoids and on the high endothelial cells of the post-capillary venules in the lymph nodes; but, immunohistochemical staining analysis could not detect SR-A expression in the aortic endothelium of cows, mice and humans.(13) SR-A are strongly localized in the cap and interiorly in lesions at all stages(14, 15). This makes the receptors an attractive target for a diagnostic or therapeutic agent.
SR-A has broad ligand specificity for a diverse array of polyanionic macromolecules, such as maleylated BSA, oxidized LDL, malondialdehyde modified LDL and polyinosinic acid.(7, 16-20) Recognition is not dependent upon specific amino acid sequence or carbohydrate structures. Because of their role in inflammation, SR-A receptors are not down regulated with ligand concentration, mediate very efficient and rapid internalization of bound ligand, and repeatedly recycle through the endosomal compartment(21, 22)- illustrating desirable traits as targets for labeling. Potentially efficient delivery of the contrast agent to these plaque sites is also suggested by the significantly increased vascular permeability in the sites of plaque inflammation and relatively small size of the maleylated BSA macromolecule (8nM(23)). We here describe the synthesis and characterization of MRI contrast agents based on scavenger receptor ligands conjugated to multiple Gd-DOTA groups. The ligand maleylated BSA was selected due to its strong affinity and specificity for the SR-A receptor.(20, 24, 25) The results presented here demonstrate targeting of macrophages in culture using the contrast agents, low toxicity on cells, and negligible labeling of normal arteries.
Experimental Procedures
Synthesis of mal-BSA (Gd-DOTA)n
Covalent linkage coupling of Protein to p-isothiocyanatobenzyl-1,4,7,10-tetraazacyclododecane-1,4,7,10-tetraacetic acid (p-SCN-Bz-DOTA) follows closely as described in Mirzadeh et al.(26). A typical preparation proceeded as follows: a suspension of bovine serum albumin (10mg/ml solution, Acros Organics, Belgium, distributed by Fisher Scientific) was dissolved in 16ml of 0.1mM of sodium bicarbonate (pH 8.5). To this albumin solution a 60 molar excess of p-SCN-Bz-DOTA · 4HCl (20mg/ml, Macrocyclics, TX) suspended in DMSO was added in 100μl to 200μl aliquots with rapid stirring at room temperature. The pH was monitored continuously during the additions and adjusted by drop wise addition of 1M sodium bicarbonate (pH 9.0). Once the reaction had reached completion, as shown by no further change in pH, the mixture was stirred an additional 36h at room temperature, yielding 18 DOTA per BSA molecule. An aliquot was removed, exhaustively dialyzed in ddH2O and lypophilized for analysis by ionized matrix assisted laser desorption ionization mass spectrometry (MALDI-MS). The same 36 hr incubation with decreasing DOTA:BSA ratios (45:1, 30:1, 15:1) yielded 15, 10 and 5 DOTA per BSA respectively. In addition, increasing incubation time to 47h for the 60:1 synthesis resulted in 22 DOTA per BSA. The remaining solution was dialyzed in 50,000 MW pore bags (SpectraPor 6) for 12 hours, in 0.1M of sodium bicarbonate (pH 8.5) at 4°C and then maleylated following the method of Butler and Hartley(27). Maleyl groups were incorporated into the BSA molecule using the remaining free lysyl amines. The reaction of maleic anhydride with amines is competitive with hydrolysis of the reagent in water, therefore 600 molar excess of solid maleic anhydride was added in small quantities to the buffered well stirred BSA (Gd-DOTA)n protein solution. The pH was monitored continuously and adjusted by the addition of solid sodium carbonate. Reaction was complete when no further acid is liberated and the maleylated protein was recovered by dialysis. An aliquot of product was removed for analysis by MALDI-MS. Typically this yielded maximal coverage of maleic blocking groups on the protein molecule in excess of the 37 groups needed for its activation as a recognized ligand.
The resulting solution was dialyzed in 50,000 MW pore bags and exchanged to 0.1M of sodium citrate (pH 6.6) no more than 9 hours at 4°C, with minimum of 4 changes of buffer. The dialyzed maleylated albumin-DOTA solution was then treated with 1.2 molar excess (Gd:DOTA) of gadolinium chloride solution added drop wise while stirred. The pH was maintained between 6.6 and 7.0 using aliquots of 1M sodium citrate. After pH was stabilized, the sample was stirred for an additional 24 hours at room temperature. The mal-BSA (Gd-DOTA)n complex was purified by an exhaustive dialysis (SpectraPor 6) at 4°C with minimally six changes of ddH2O water within a 36 hour period at 4°C. The purified solution of mal-BSA (Gd-DOTA)n was then lyophilized and stored, dessicated, at 4°C. Gadolinium content was determined using ICP-MS. We have found that similar results can be obtained by purification using standard desalting columns (Bio-Rad, Dallas TX) rather than dialysis, with less loss of product. The protein solution then is decanted and desalted.
Synthesis of FITC-mal-BSA
BSA was maleylated by the method of Butler and Hartley(27), desalted to remove unreacted maleic anhydride, then lyophilized. The product was resuspended in PBS, pH 7.4. Extent of acylation of the protein amino groups was determined using o-phthalaldehyde (OPA) fluorescent protein assay according to a method modified from Roth.(28, 29) FITC labeling followed a modified protocol from Molecular Probes. Due to differential accessibility of lysines on the BSA molecule and the increased blocking of free amines by maleyl groups, fluorescent labeling required increasing stoichiometric ratios of FITC to mal-BSA with higher degree of maleylation. Therefore FITC:protein ratios of 2:1, 5:1, 10:1, 20:1 and 30:1 were employed for BSA maleylated at 0%, 8-20.5%, 29-69%, 82%, and 89%, respectively. Briefly, FITC (10mg/ml in DMSO) was added to mal-BSA in small aliquots over the course of 1 hour at room temperature while stirred. The pH was maintained at 8.5 using aliquots of fresh 1M sodium bicarbonate solution. After completion of the reaction as indicated by no further changes in pH, unreacted FITC was removed using a standard desalting column. Absorbance spectroscopy against a BSA standard was used to determine the protein concentration and fluorophore:protein ratio, using 68000cm-1M-1 as the molar extinction coefficient of the dye at pH 8.0 at 494nm. Resulting fluorophore to protein ratios (f/p) were as follows: 1.14 for BSA, 1.85 for 8% maleylated, 1.09 for 20.5% maleylated, 1.15 for 29% maleylated, 1.24 for 43% maleylated,1.04 for 54% maleylated,1.57 for 69% maleylated, and 1.34 for 89% maleylated.
Mass spectrometry
Mass Spectrometery (Finnigan LCQ Deca XP Plus Ion Trap Mass Spectrometer) was used to identify the proportion of chelates to maleyl groups conjugated to the protein molecule, and to determine final molecular weight of the contrast agent. Samples were ionized by matrix assisted laser desorption ionization (MALDI) and the resulting ions analyzed by a mass analyzer hybrid of quadrupole and time of flight (TOF). Serum albumin, which is characterized by a broad, low intensity peak susceptible to noise, reduces the method accuracy to an estimated +/-500Da.
ICP-MS
To verify the incorporation of gadolinium to DOTA chelators and purification success, inductively coupled plasma mass spectrometry (ICP-MS) was utilized for analysis of gadolinium content. Quadrupole ICP-MS (Agilent Technologies 7500a) is capable of analyzing a large number of elements with detection sensitivity at the ppb-ppt level. Samples were prepared in 10ml vials of 3% nitric acid. All samples were prepared in triplicate. Indium solution was spiked into all solutions (i.e. calibration standards and samples) as an internal standard in order to correct instrumental drift during analysis. Isotopes 157Gd and 115In were used for determination.
Magnetic Resonance Measurements
Relaxivity at 0.6T
Relaxivity data was measured using a GE-NMR CSI-2 system with a Tecmag console and a 450mm clear bore horizontal magnet operating at 0.6T. Experiments were performed at room environment (25°C). A typical 180° pulse was 15μs and the reproducibility of the T1 data was within 3%. Spin-lattice relaxation times were measured using an inversion recovery technique with least-squares fitting applied to the semilog representation of 10 to 12 inversion times ranging from 50 to 3000ms in an exponential fashion. In all samples, the region of interest was evaluated for a 100μl NMR tube volume containing contrast agent, typically ranged between 0.1mM to 1mM gadolinium, dissolved in distilled, deionized water, pH 7.0 (Gibco, Ultra Pure).
Imaging and Relaxivity at 7T
Relaxivity and MR cell studies were also performed using Bruker Avance Biospec system (Billericia, MA) equipped with a 95mT/m max gradient set and 72mm ID coil operating at 300MHz, at ambient temperature (25°C). MR measurements were carried out using freshly harvested lysed cells in suspensions of distilled water. Imaging was performed with a T1-weighted saturation recovery sequence with differing repetition times, an echo delay time of 16ms and a flip angle of 90° was used for imaging. The T2 effects are minimized through the use of a short TE. In all experiments, the FOV was 6cm × 6cm, matrix size was 256 × 256 and slice thickness was 1mm. From the images a T1 map was calculated using Paravision System software.
Cell Studies
Agents were prepared as described and employed in cell assays. All agents used for cell studies were 60% maleylated unless otherwise noted and number of gadolinium per molecule of agent is indicated by the subscript ‘n’ in (Gd-DOTA)n. Although the gadolinium content for the probes used may differ from figure to figure, all controls were matched to the gadolinium content of the experiment group, so the data are self consistent.
Dependence of cellular uptake on degree of maleylation
P388 D1 cells (ATCC.com) were maintained in RPMI 1640 supplemented with L-Glutamine and 10% fetal bovine serum (FBS). For the uptake experiments cells at 70-80% confluency in 35 well dishes were incubated with 100μg/ml FITC-mal-BSA in medium supplemented with lipid deprived protein serum (LPDS) for 1 hour at 37°C. Lipid protein deprived bovine serum (LPDS) was substituted for fetal bovine serum to remove competing modified lipoproteins (e.g. oxidized LDL) and maximize the cell's SR-A receptor expression during experimentation. All samples were prepared in triplicate unless otherwise noted. After incubation cells are washed three times with PBS and placed in warmed PBS for confocal imaging. Cells dishes were imaged using a BioRad upright confocal microscope.
Cellular uptake
P388D1 cells on 48 well plates were incubated with increasing concentrations of mal-BSA(Gd-DOTA)n where n = 10 or 15 for one hour. After incubation the wells were washed twice and then cells were lysed by addition of ddH2O and imaged by MRI at 7T. Typical preparations consisted for 3 × 10⁵ cells lysed in 150μl water. Gd content for each well was assessed by ICP-MS.
Specificity of Uptake
To verify that uptake was specific, cells were incubated with either mal-BSA or control of BSA labeled with Gd-DOTA. BSA is not recognized by the scavenger receptor. The mal-BSA and BSA agents used here were prepared as matched pair, with synthesis proceeding through the addition of Gd-DOTA, and then splitting the product to two samples, one of which was subjected to maleylation (for mal-BSA). Equal Gd-DOTA load was confirmed by mass spec and ICP-MS. Cells were incubated for one hour at 37°C and then washed twice and lysed for imaging as described above.
To verify that cellular uptake was receptor specific, competition experiments were conducted and characterized by MRI and ICP-MS. Cells in 48 well plates were incubated with 200μM contrast agent (n = 22) in the presence of unlabeled maleylated BSA (mal-BSA) or BSA as control in 0, 0.1, 1, 10, and 20 fold excess concentrations. BSA was used as non-targeted control in a separate set of wells.
Cytotoxicity Studies
Cell Culture
Mouse fibroblast 3T3 cells were cultured as a monolayer in high glucose DMEM (Cellgro) and supplemented with 10% calf bovine serum (v/v) and 5mM L-Glutamine. Exponentially growing cultures were maintained in a humidified atmosphere of 5% CO2 at 37°C.
MTT Assay
The MTT assay performed in this study was a modification of the procedure described by Carmichael(30). Increasing numbers of 3T3 cells from 780 to 100,000 cells/well were plated in a 96-well plate. The MTT assay was performed after a 24-hour adhesion time. Cytotoxicity was then assessed for mal-BSA (Gd-DOTA)15 and chlorpromazine, for comparison. The assays were carried out in parallel and in triplicate. Cells were counted and plated evenly in a 96-well plate. After a 24-hour adhesion time, varying concentrations of mal-BSA (Gd-DOTA)15 (0, 45, 90, 225 and 445μM) or chlorpromazine (0, 10, 25, 50 and 100μM) were placed on the cells. After a 4- and 24-hour agent exposure time at 37°C the MTT assay was performed. After the appropriate incubation times, media was removed from the wells, replaced with 100μl of fresh media containing 1.0mM MTT (Invitrogen), and incubated for 3 hours at 37°C. To dissolve the insoluble MTT formazan crystals, 75μl of media was removed and 50μl of dimethyl sulfoxide (DMSO) was added to the wells. The plate was incubated at 37°C for an additional 10 minutes. Well solutions were mixed thoroughly just before absorbance measurement with a Tecan Safire2 UV/Vis spectrophotometer. Triplicate assays were performed at all drug concentrations. Chlorpromazine was obtained from MP Biomedicals Inc. Mal-BSA (Gd-DOTA)15 was synthesized in the lab as previously described. To determine the relationship of cell number to MTT formazan crystal formation, a preliminary test of the MTT assay was performed as well.
Bio-distribution studies
In order to determine in vivo accumulation sites of the agent and to study the blood clearance dynamics mal-BSA (Gd-DOTA)15 was labeled with a positron emitter, i.e.64Cu (T1/2 = 12.7h: β+: 0.653MeV, 17.4%; β-: 0.578MeV, 39%), and bio-distribution studies on rats were performed by positron emission tomography (PET).
Under isoflorane anaesthesia three male rats (Sprague-Dawley and Fisher), ∼200-230g, were injected via the tail vein with 889, 1045 and 816μCi respectively of the 64Cu-labeled compound in 0.3ml PBS buffer followed by a 0.5ml saline flush. Blood samples were drawn at five approximate time points between 2 and 200min post-injection and activity was measured. At 1, 4, 24 and 48h post-injection the animals were scanned on a MicroPET II (developed at UCD) or a Siemens Preclinical Imaging Focus 120. An 18FDG calibration scan was also performed in order to determine the absolute values of the radioactive dose in affected organs. At 2, 15, 33, 60 and 200 minutes post injection blood samples (mass between 0.013-0.089g) were collected via tail nicking and activity counted by a Perkin-Elmer Wizard 1470 Automatic Gamma Counter with an energy window setting of 425-640keV. The raw data is acquired and the unreconstructed images produced by the software MicroPET Manager 2.2.4.0 (MPM) (Concorde Microsystems Inc. (now Siemens Preclinical Solutions)). The emission images (128×128×359; pixel size 0.60mm) were then iteratively MAP reconstructed (field of view 3.85cm) using the MPM plus the MicroPET MAP Files 1.0.3.0. For analysis of the images ASIPro 6.0.5.0 was used.
Synthesis of 64Cu-labeled mal-BSA (Gd-DOTA)15
A typical procedure incorporated 1mCi of activity to 0.1mM of contrast agent: the mal-BSA (Gd-DOTA)15 and required amount of 64Cu2+-solution was dissolved in 0.25M NH4OAc (pH 7) separately. The solutions were added together and incubated at 40°C for 30min. The resulting solution was then purified according to Penefsky(31).
Results and Discussion
There are theoretically 60 free amines on BSA through which Gd-DOTA could be conjugated; however some fraction of these must be occupied by maleyl groups for recognition by the scavenger receptor. The number of maleyl groups incorporated, however, must be balanced with the number of Gd-DOTA that must be attached to achieve significant contrast enhancement. To evaluate the minimum number of maleyl groups to satisfy receptor recognition we synthesized a series of mal-BSA molecules with varying degrees of maleylation. Significant conformation changes with maleylation are believed to facilitate access to lysines that are buried in unmodified BSA.(32) These molecules were also tagged with FITC and applied to macrophages in culture to assess uptake. As shown in Figure 1 optimal uptake is achieved with greater than 80% of the free amines modified by maleyl groups. Figure 1 present confocal images for cells incubated for one hour with mal-BSA from 0 to 89% maleylation carrying ∼1 FITC per molecule. Confocal images were obtained on a BioRad system using 488nm excitation. Significant increases in fluorescence intensity are observed as the degree of maleylation is increased, indicating increased uptake. Although optimal at 80% maleylation, cellular internalization is still significant for 40-80% maleylated molecules. These results are consistent with previous studies performed using radiolabeled ligands.(33) In a study with rat endothelial sinusoidal liver cells, SRA uptake activity correlated with different degrees of BSA modification labeled with 125I(33). Scavenger receptor mediated endocytosis (uptake) of maleylated BSA indicated that 60% maleylation, or >37 lysyl amino residues, sharply increased ligand activity. Radioligand data supported that all lysyl amino groups are accessible for maleylation or DOTA conjugation. Based on the results of Figure 1, subsequent labeling with Gd-DOTA was performed on 60% maleylated BSA in order to maximize the number of free-amines for Gd-DOTA conjugation. At 60% maleylation, there should be up to 24 available free amines for conjugation of Gd-DOTA groups.
Figure 1.
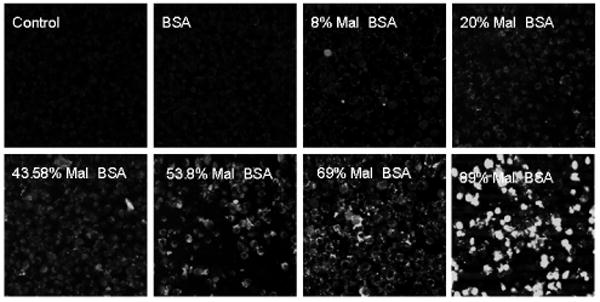
Macrophage uptake is dependent on degree of maleylation. Cells were incubated with FITC labeled derivatives of mal-BSA bearing different numbers of maleyl groups. Signal intensity increases with increasing maleylation, with significant uptake at greater than 50% maleylation. Optimal uptake is observed for 80% maleylation and above.
Additions of increasing numbers of DOTA groups to mal-BSA (Gd-DOTA)n increased the number of paramagnetic centers, improving the relaxivity of the contrast agent as shown in Table 1. Observed relaxivities for the mal-BSA contrast agents are summarized in Table 1. Incorporation of DOTA groups was verified by mass spectrometry and Gd content was analyzed by ICP-MS. Close agreement between the DOTA:BSA ratio, determined by mass spec, and Gd:BSA ratio, determined by ICP-MS, suggests formation of the Gd:DOTA chelate with no non-specific binding to the protein despite reported affinity sites for gadolinium on the BSA molecule.(34) Relaxivity of Mal-BSA(GdDOTA) increases with increasing Gd-DOTA per molecule then plateaus at >15 Gd/molecule, attaining a maximum of 33mM-1s-1. The relaxivity values are comparable to those for literature reported and commercial agents such as isothiocyanato-benzyl-diethylenetriamine-pentaacetic acid (ITCB-DTPA-Gd) albumin (30.3mM-1s-1 at 29Mhz, 24°C)(35), and MS-325, a Gd chelate that reversibly and non-covalently binds native albumin with relaxivity at maximum loading of albumin equal to 33mM-1s-1 and relaxivity under in vivo conditions of 17.3mM-1s-1.(36) Relaxivities for Mal-BSA(GdDOTA)>15 are significantly higher than those reported for a related albumin-(Gd-DTPA)19 (14.9mM-1s-1 at 10.7Mhz, 37°C)(37) or for Magnevist, a small molecule gadolinium chelate (3.4mM-1s-1 at 42MHz, 37°C). The reported values for the albumin compounds were obtained a slightly higher temperature and with different field strength instruments, so the values are not directly translatable. However, these results show that the relaxivities for the prepared agents are on the order or better than expected values. R1 values are also improved over free Gd-DOTA preparations such as Magnevist. Conjugation of Gd-DOTA to larger molecules is known to increase relaxivity by reducing rotational correlation time.(38) This has been observed for lipophilic Gd-DOTP and Gd-DOTA complexes that bind to albumin(39, 40), as well as for other Gd-DOTA conjugates(41, 42).
Table 1.
Relaxivities of prepared agents compared to other reported agents. Relaxivities increase with increasing Gd-DOTA incorporation, reaching an apparent plateau above 15 Gd/molecule.
| Contrast Agent | r1 per Gd (mM-1 s-1) | Temp. and Field Strength | Molecular Weight BSA-DOTA only (Da) | Final Molecular Weight (Da) | Gd ion per DOTA |
|---|---|---|---|---|---|
| Mal-BSA (Gd-DOTA)22 | 29.1 | RT, 26MHz | 79142 | 85898.7 | 19.8 |
| Mal-BSA (Gd-DOTA)18 | 33.4 | RT, 26MHz | 76607.5 | 82317.2 | 11.9 |
| Mal-BSA (Gd-DOTA)15 | 31.2 | RT, 26MHz | 74844.5 | 82455 | 14 |
| Mal-BSA (Gd-DOTA)10 | 20.0 | RT, 26MHz | 71702.2 | 77490.6 | 6.7 |
| Mal-BSA (Gd-DOTA)6 | 12.2 | RT, 26MHz | 69535.6 | 75954.1 | 4.4 |
| Mal-BSA (Na-DOTA)6 | 0.09 | RT, 26MHz | 69535.6 | — | 0 |
MR images of solutions of the contrast agent at 7T demonstrated that these levels of labeling with Gd-DOTA were sufficient to affect contrast at physiologically reasonable concentrations. As shown in Figure 2 contrast was increased in a concentration dependent manner by the Gd-DOTA conjugates, with greater enhancement by more heavily labeled molecules. Figure 2 presents mal-BSA that has been conjugated to 18 or 10 Gd-DOTA, greater contrast is seen with 18 attached Gd-DOTA for top row of solutions, as expected. For the 18 Gd-DOTA molecule, significant contrast enhancement is seen for concentrations greater than 50μM.
Figure 2.
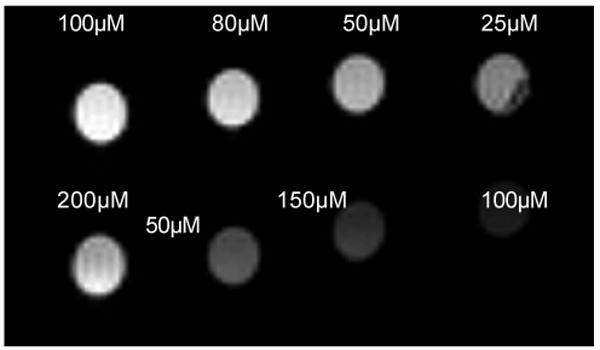
Contrast enhancement correlates with number of Gd-DOTAs bound. Solutions of mal-BSA (Gd-DOTA)n with n = 10 (bottom row) or 18 (top row) in distilled, deionized water, pH 7.0 were imaged at 7T at ambient temperature (25°C). Signal intensity increases as concentration increases (from right to left) and greater signal intensity is observed for the more heavily labeled agent. Contrast enhancement is observed for concentrations greater than 25-50μM.
Uptake by cells was assessed on P388D1 macrophages in culture. Cells were incubated with 15 and 10 Gd-DOTA labeled mal-BSA for one hour and then lysed for MR imaging. As shown in Figure 3 macrophages show increasing contrast in an MRI image with increasing concentration of the Gd-DOTA labeled compounds. Incubation with greater than 50μM of either labeled agent was sufficient to produce observable contrast in the MR image. Results from ICP-MS indicate that femtomoles of gadolinium could be found inside a cell after one hour incubation.
Figure 3.
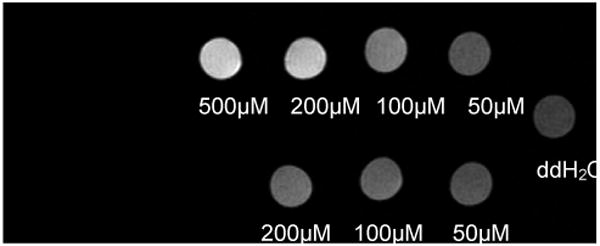
Mal-BSA (Gd-DOTA)n is taken up by macrophages. P388D1 cells were incubated with n = 15 (top row) or n = 10 (bottom row) mal-BSA (Gd-DOTA)n for one hour then imaged at 7T. Contrast increases in a concentration dependent manner (right to left) indicating uptake of the contrast agent by the cells. Contrast enhancement is observed for an application of as low as 50μM contrast agent to the cells (top row, rightmost column). Actual T1 values were, left-right: (top row) = 0.84s, 0.96s, 1.49s. 2.33s; (bottom row) = 1.79s, 1.96s, 2.51s; (water) = 3.44s
That uptake by cells is specific was confirmed by incubating cells with mal-BSA carrying 22 Gd-DOTA, or with a Gd-DOTA matched BSA control. These control molecules were prepared from the same batch of Gd-DOTA labeled BSA but were not maleylated for scavenger receptor recognition. Images at 7T, Figure 4, from incubated cells show that there is no uptake of the BSA compound (bottom row) while the maleylated partner is taken up in a concentration dependent manner (top row). Specificity of uptake was further confirmed by competition studies in which cells were incubated with a fixed concentration of mal-BSA (Gd-DOTA)15 and increasing excess of unlabeled mal-BSA. If uptake were receptor mediated the excess unlabeled ligand should compete away uptake. Nonspecific uptake is strictly concentration dependent and would not be affected by additional ligands in the solution. Receptor mediated uptake is confirmed by the results seen in Figure 5, increasing amounts from 0-20 fold excess competitor reduce uptake as expected for a receptor-mediated process.
Figure 4.
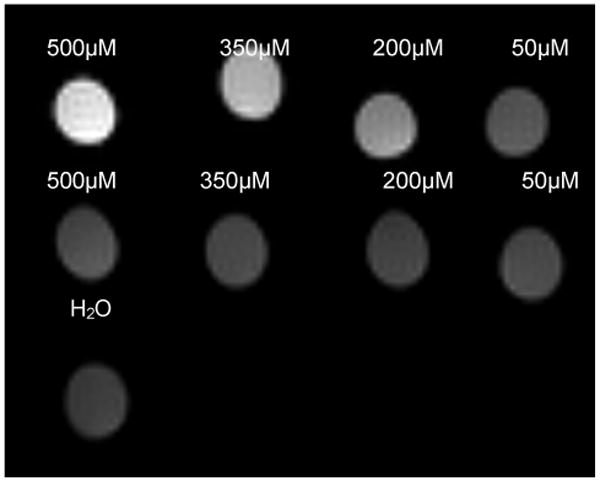
Uptake of mal-BSA (Gd-DOTA)n is specific. P388D1 cells were incubated with either mal-BSA (Gd-DOTA)n or a matched BSA control, n = 22 for both. Cells were imaged at 7T. Macrophages demonstrate uptake of the maleylated agent (top row) but do not recognize the non-maleylated control (middle row). Contrast enhancement after uptake of mal-BSA (Gd-DOTA)22 is observable for as little as 25μM of the agent applied to cells. Actual T1 values were, left-right: (top row) = 0.58s. 0.89s, 1.46s, 2.53s; (bottom row) = 2.81s, 2.90s, 3.09s, 2.85s; (water) = 3.50s
Figure 5.
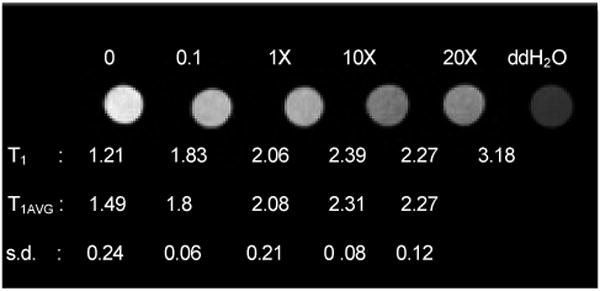
Uptake of mal-BSA (Gd-DOTA)n is receptor-mediated. P388D1 cells were incubated with a fixed concentration of mal-BSA (Gd-DOTA)15 and increasing molar excesses of unlabeled mal-BSA. Representative samples are shown with molar excesses of competitor as indicated above each sample. Actual T1 values for the image appear below each sample, as well as average and standard deviation T1 for triplicate repeats. All values are given in seconds. Cells were imaged at 7T. Increasing molar excess of unlabeled agent inhibits uptake of the labeled agent and reduced signal in the image. T1 decreases dramatically with molar excess of competitor. Competition by unlabeled ligand confirms that uptake of the contrast agent is receptor-mediated.
One of the primary concerns regarding the use of biomolecules labeled with gadolinium chelates as contrast agents is whether sufficient amounts of gadolinium can be accumulated in sites of interest to be visible on an MR image.(43) The final amount of contrast agent required to produce sufficient contrast in an MRI scan depends on a host of factors including the precise pulse sequence and parameters used for acquisition.(2, 23) Nevertheless, this issue has been studied by a number of investigators and estimations can be made. One of the earliest theoretical models for the minimum amount of Gd(III) complex, of a given relaxivity, to produce detectable contrast enhancement was tested against microinjections of Gd(III) in to Xenopus eggs(44). These trials established that measurable contrast was visualized when the concentration of agent in the egg is on the order of 10-100μM (at 500MHz). The Xenopus embryo system is unique, and while similar to some types of human tissue, the eggs are quite fatty and are different from many tissues of interest in mammals. More recent empirical results at 7T have shown that for contrast agents with relaxivities in the range of 5-7mM-1s-1 the minimum amount of Gd(III) to produce contrast is on the order of 2 × 10⁹ molecules per cell; while for an agent with relaxivity on the order of 80mM-1s-1 (20MHz) contrast is observed for concentrations on the order of 4 × 10⁷ Gd(III) per cell(45). These observations were made using apoferritin as a carrier for the Gd(III), which is taken up by receptors found on the cell surface at a density of 4 × 10⁴ per cell, Kd = 1nM.
Relaxivities are also field dependent. NMRD curves for Gd-DOTA show that relaxivity does not change much up to about 2MHz and then begins to fall off rapidly, so the relaxivity at typical clinical field strengths (1.5-3T) should actually be a bit higher than that observed on typical research instruments (4.7-11.7T)(40). Thus, the amount of Gd-DOTA required would be less at lower field strengths. We estimated that the relaxivity for our multi-labeled mal-BSA molecules would be similar to that observed for Gd-labeled albumin (26:1 Gd:albumin) = 192mM-1s-1 (per mM agent) at 4.7T(46). At 1.5T this value would be higher. With this estimate of relaxivity, based on the criteria just described, the amount of Gd(III) required to produce contrast at 1.5T should be less than 4 × 10⁷ molecules per cell.
The scavenger receptor is a high affinity (pM-nM, depending upon ligand) receptor present in high numbers on macrophages, on the order of 5 × 10⁵ receptors per cell I P388D1.(18, 25, 47, 48) Thus, ∼20-80 Gd(III) must be taken up per receptor during the course of incubation (depending on cell type used) to reach the concentrations required per cell. Scavenger receptors uptake and process modified lipoproteins through a classic coated pit pathway, similar to the LDL pathway, wherein the receptor takes up ligand, brings ligand into the cell, dissociates from the ligand, and recycles back to the surface in a highly efficient manner. The scavenger receptor has an estimated t1/2 for internalization of the ligand-receptor complex of 2.8-4min(22). Recycling of receptors in the scavenger receptor pathway has not been fully characterized; but in the LDL pathway receptors recycle on the order of 10 minutes(49-51). If this is similar for the scavenger receptor pathway then 500,000 receptors can uptake ∼3 × 10⁶ ligands per hour. Based on the values given above, this would be sufficient for contrast with 13:1 Gd:ligand complex and one hour incubation. As our results show, modification with ten and greater Gd-DOTA per mal-BSA was sufficient to produce contrast with micromolar applications to cells. Moreover, the cell densities used for these studies is on the order of that found for macrophages in isolated human plaques, indicating that these imaging results will be applicable to the in vivo case.(52-56)
There are number of examples in the literature of efficient cellular uptake of Gd(III) complexes using Gd-DOTA derived molecules(57-60). More recent efforts have sought to maximize the load of Gd delivered per receptor by tethering carrier molecules to dendridic polymers containing high numbers of Gd(III)(61), uptake through the folate receptor has been demonstrated by this means as has avidin-biotin antibody-based targeting(59, 62, 63). Again, definitive measurement of the amount of Gd required to produce contrast depends upon the imaging parameters employed and these must also be evaluated when testing the new contrast agents. But on the basis of the approximate calculations shown here, and these similar studies in the literature, we predicted that MRI contrast could be achieved for the scavenger receptor system using feasible ratios of Gd:ligand and this was confirmed by the results reported here.
Recent literature has investigated MRI contrast agents targeted to other molecular markers in plaque, but these tend to be geared for imaging of more advanced stages of disease. For example, 5-HT-DOTA(Gd) targets myeloperoxidase (MPO), a heme-containing enzyme secreted by a number of neutrophils, for selective imaging of MPO activity in a model system(64). Myeloperoxidase secretion has been correlated with plaque instability. The described agent is a serotonin derivative of Gd-DOTA that polymerizes after oxidation by myeloperoxidase-catalyzed reduction of hydrogen peroxide. Polymerization resulted in increased relaxivity attributed to decrease in rotational correlation time and demonstrated contrast enhancement in presence of at least 650U of enzyme. This agent is geared toward more advanced plaques that would have significant secretion of MPO and may be vulnerable to rupture. Other examples in the literature describe the use of Gd-DTPA labeled fibrin binding peptides to label thrombi in animal models(65, 66). Each agent carries four gadolinium chelates and binds to mural thrombi, rather than atherosclerotic plaque. Thrombosis occurs after plaque rupture and these agents are designed to aid in guiding thrombolytic therapy.
Fewer reports describe MRI agents able to detect earlier stages of disease. One example is low density lipoprotein (LDL) complexed with manganese-mesoporphyrin (MnMeso)(67). These agents are also targeted to macrophages in that the modified LDL was demonstrated to be taken up by foam cell cultures. However, the MnMeso is not covalently bound to the lipoprotein, and therefore may transfer off LDL to other plasma proteins and lipoproteins. In addition, there is concern about possible cardiotoxicity and accumulation of Mn2+ agents in the brain after intravenous injection(68, 69). Dextran coated iron oxide nanoparticles have also been observed to be taken up by macrophages in plaques, due to the phagocytic nature of the cells to engulf particles(70). However these rely on nonspecific uptake of the nanoparticles, which an inefficient process, outside of the liver, and the agent must be delivered in several fold excess of standard clinical doses in order to accumulate enough contrast agent in the plaque after clearance through by renal system.
A possible limitation to administering mal-BSA (Gd-DOTA)n in a clinical setting is possible humoral immune response to this macrocyclic chelated agent.(71, 72) By targeting macrophages, we are in effect aiming for increased recognition by these immune cells. However, our aim is for internalization of mal-BSA and removal from blood without negative systemic effects. Studies on methods to increase immunogenicity of antigens for vaccine development have examined maleylation(21). In those studies, immunogenicity, i.e. uptake by macrophages, of maleylated antigens was increased compared to unmodified antigens upon repeated injections in mice without adjuvants present(21). Upon repeated exposure, animals exposed to mal-BSA shows higher serum anti-immunogen antibody concentration than those exposed to BSA. In addition, maleylation disrupts native B cell epitopes on the antigens, for example, maleylated diphtheria toxoid (DT) is not recognized by antibodies to native DT. New epitopes seem to created that can cross-react between various maleylated proteins regardless of amino acid sequence. It is likely then that the epitopes are purely maleylation dependent. While mice produced antibodies against the antigen, no systemic toxicity was reported. Possible toxic or other negative immune responses of mal-BSA require further study. The scavenger receptor recognizes a number of different ligands(9-11, 13), these can also be investigated as carriers should mal-BSA prove undesirable in vivo.
From the MTT cell toxicity studies, dose response curves suggest that mal-BSA (Gd-DOTA)15 has a low toxicity when compared to chlorpromazine, as shown in Figures 6A and 6B. Chlorpromazine is a phenothiazine drug, primarily used as a psychotropic agent since the 1950's, with a low toxicity (73-75). Its toxicity has been well documented and therefore, it has been employed as a standard in toxicity assays(74-76). The EC50 can be interpolated from these plots and used to directly compare the toxicity of mal-BSA (Gd-DOTA)15 to chlorpromazine. From Figure 6A, EC50 is not reached at even the highest concentration tested for 4 hour incubations with mal-BSA (Gd-DOTA)15. For 24 hour incubations, EC50 was found to be 40μM. Both values are less toxic than those found for chlorpromazine, Figure 6B, which showed EC50= 84μM for 4 hour, and EC50 = 24μM for 24 hour incubations, respectively.
Figure 6.

Toxicity of mal-BSA. Cytotoxicity was assessed for mal-BSA (Gd-DOTA)15 and chlorpromazine as a positive control. The assays were carried out in parallel and in triplicate. Cells were counted and plated evenly in a 96-well plate. After a 24-hour adhesion time, varying concentrations of mal-BSA (Gd-DOTA)15 (0, 45, 90, 225, and 445μM) or chlorpromazine (0, 10, 25, 50, and 100μM) were placed on the cells. After a 4- and 24-hour agent exposure time at 37°C the MTT assay was performed. Dose response curves at 4- (black) and 24- (gray) hours are shown for mal-BSA (Gd-DOTA)15 (Figure 6A) and chlorpromazine (Figure 6B). For 4h mal-BSA incubation, toxic dose EC50 is not reached for the concentrations of agent tested (EC50 > 450μM). For the 24h mal-BSA EC50 = 40μM. This is in contrast with chlorpromazine with EC50 = 84μM for 4h incubation and EC50 = 24μM for 24h incubation. Toxicity of mal-BSA (Gd-DOTA) is less that that of the chlorpromazine standard. Error bars reflect standard error.
Bio-distribution studies show a very fast clearance from the blood stream, more than 97% of the injected dose of radio labeled contrast agent is cleared out within two minutes as seen in Figure 7. From the PET studies of biodistribution it was found that the main sites for accumulation are the liver, kidneys and the urinary bladder. The highest accumulation is in the liver. After one hour about 50% of the injected dose remains in the liver. During the next 3h the activity drops to 30% of the injected dose. This is equivalent to 30μM agent in the liver after one hour and 18μM after four hours. The activity then remains stable at 18μM. Comparing these accumulated concentrations to the concentrations from the cell toxicity studies, EC50 = 40μM for 24 hour incubation, suggests that in these experiments in vivo accumulation is at less than toxic levels. Accumulation observed in the other organs is even less, and thus, also below toxic EC50. For the kidneys, about 1% of the injected dose is found in each kidney and the levels are stable for the duration of the whole experiment. In the urinary bladder 2.5% of the injected dose remains after one hour; this clears to approximately 0.2-0.5% of injected dose during the first 24h and falls to undetectable levels after 48h. By comparison, the blood pool agent albumin(Gd-DTPA)30 is largely retained in the intravascular space with a half-life of 88min after intravenous injection and can remain in the bloodtstream and extravascular compartment two weeks after injection.(77, 78) These undesirably long retention times have precluded its use in the clinic.
Figure 7.

Blood clearance. Blood samples were collected by tail nicking at 2, 15, 33, 60 and 200 minutes post injection of contrast agent and quantitated by gamma counting. Clearance from the blood is rapid with ∼ 97% of the injected agent cleared out from the blood stream after 2 minutes; 0.5% of injected dose remaining after 30 minutes and undetectable levels in the blood after 1 hour. Error bars reflect standard error.
In conclusion, we describe the preparation, characterization and successful in vitro targeting of a paramagnetic contrast agent, mal-BSA (Gd-DOTA)n, for use in MRI. This novel contrast agent builds upon previously reported studies on anionic modifications of BSA and knowledge of the SR-A receptor. Mal-BSA (Gd-DOTA)n has physical properties that permit localization to the target and demonstrated high specific uptake of agent by macrophages, also low toxicity and fast clearance dynamics are shown. The synthesis process outlined here allows controllable degrees of maleylation and paramagnetic labeling of known lysines on the BSA molecule. Mal-BSA (Gd-DOTA)n demonstrated relaxation effects comparable to or better than similar commercial and experimental plaque-targeted or albumin-based agents. An optimal payload of 22 Gd-DOTA with mal-BSA (Gd-DOTA)22 showed contrast effects comparable to albumin (Gd-DTPA)30, which is used as a standard to evaluate performances of novel intravascular agents. (79-82)
Though further studies are required to evaluate immunogenicity of the agent, the high specificity of mal-BSA (Gd-DOTA)n shows promise for reducing dosage of administration and toxicity compared to high dose nonspecific contrast agents currently employed in the clinic. Future work includes isolating the regional domains of maleylated BSA that afford targeting in order to circumvent immune responses that may be provoked by full length protein. Through the modification with other diagnostic agents, such as the 64Cu positron emitter or fluorophores, this carrier system shows potential to act as a multimodality imaging agent for diagnosis and study of atherosclerotic and restenotic lesions.
Figure 8.

Biodistribution in the rat model. Primary sites of accumulation of the agent in normal tissues are in liver (black), kidneys (gray), and urinary bladder (white). Clearance from kidneys is rapid in first hour. Signal from bladder falls to negligible levels by 48h. Error bars reflect standard error.
Figure 9.

Liver pharmacokinetics. The clearance of the agent from the liver is initially rapid. The activity per tissue volume of the agent decreased over 60% the first four hours after injection. Calculated corresponding concentration of the agent falls to 18μM after 4h, well below the EC50 found for macrophages in culture (EC50 > 450μM for 1h, EC50 = 40μM for 24h). Error bars reflect standard error.
Acknowledgments
The authors thank National Institutes of Health (EB000993-01A1) and the Whitaker Foundation (RG-02-0740) for their support of this work; Dr. Jeff Walton for assistance with MRI, Dr. Ryoji Shiraki for assistance with ICP-MS, David Kukis for assistance with radioactive labeling, Chris Griesemer for assistance with animal studies, Lily Wong for her assistance with chemical coupling and tissue culture and Christina Takanishi and Edgar Sanchez for assistance with cell toxicity studies.
References
- 1.Desai MY, Bluemke DA. Atherosclerosis imaging using MR imaging: current and emerging applications. Magn Reson Imaging Clin N Am. 2005;13:171–80. vii. doi: 10.1016/j.mric.2004.12.005. [DOI] [PubMed] [Google Scholar]
- 2.Rogers WJ, Prichard JW, Hu YL, Olson PR, Benckart DH, Kramer CM, Vido DA, Reichek N. Characterization of signal properties in atherosclerotic plaque components by intravascular MRI. Arterioscler Thromb Vasc Biol. 2000;20:1824–30. doi: 10.1161/01.atv.20.7.1824. [DOI] [PubMed] [Google Scholar]
- 3.Fayad ZA. MR imaging for the noninvasive assessment of atherothrombotic plaques. Magn Reson Imaging Clin N Am. 2003;11:101–13. doi: 10.1016/s1064-9689(02)00023-5. [DOI] [PubMed] [Google Scholar]
- 4.Choudhury RP, Fuster V, Fayad ZA. Molecular, cellular and functional imaging of atherothrombosis. Nat Rev Drug Discov. 2004;3:913–25. doi: 10.1038/nrd1548. [DOI] [PubMed] [Google Scholar]
- 5.Ruygrok P, Webster M, deValk V, vanEs G, Ormiston J, Morel M, Serruys P. Clinical and angiographic factors associated with asymptomatic restenosis after percutaneous coronary intervention. Circulation. 2001;104:2289. doi: 10.1161/hc4401.098294. [DOI] [PubMed] [Google Scholar]
- 6.Ross R. The pathogenesis of atherosclerosis: a perspective for the 1990s. Nature. 1993;362:801–809. doi: 10.1038/362801a0. [DOI] [PubMed] [Google Scholar]
- 7.Platt N, Gordon S. Is the class A macrophage scavenger receptor (SR-A) multifunctional? -The mouse's tale. J Clin Invest. 2001;108:649–54. doi: 10.1172/JCI13903. [DOI] [PMC free article] [PubMed] [Google Scholar]
- 8.Van Berkel TJ, Van Eck M, Herijgers N, Fluiter K, Nion S. Scavenger receptor classes A and B. Their roles in atherogenesis and the metabolism of modified LDL and HDL. Ann N Y Acad Sci. 2000;902:113–26. doi: 10.1111/j.1749-6632.2000.tb06306.x. discussion 126-7. [DOI] [PubMed] [Google Scholar]
- 9.Sakai M, Kobori S, Miyazaki A, Horiuchi S. Macrophage proliferation in atherosclerosis. Curr Opin Lipidol. 2000;11:503–9. doi: 10.1097/00041433-200010000-00008. [DOI] [PubMed] [Google Scholar]
- 10.Silverstein R, Febbraio M. CD36 and atherosclerosis. Current Opinion in Lipidology. 2000;11:482–491. doi: 10.1097/00041433-200010000-00006. [DOI] [PubMed] [Google Scholar]
- 11.Trigatti B, Rigotti A, Braun A. Cellular and physiological roles of SR-BI, a lipoprotein receptor which mediates selective lipid uptake. Biochim Biophys Acta. 2000:276–286. doi: 10.1016/s1388-1981(00)00154-2. [DOI] [PubMed] [Google Scholar]
- 12.Hughes D, Fraser I, Gordon S. Murine macrophage scavenger receptor: In vivo expression and function as receptor for macrophage adhesion in lymphoid and non-lymphoid organs. Eur J Biochem. 1995;25:466–473. doi: 10.1002/eji.1830250224. [DOI] [PubMed] [Google Scholar]
- 13.de Winther MP, van Dijk KW, Havekes LM, Hofker MH. Macrophage scavenger receptor class A: A multifunctional receptor in atherosclerosis. Arterioscler Thromb Vasc Biol. 2000;20:290–7. doi: 10.1161/01.atv.20.2.290. [DOI] [PubMed] [Google Scholar]
- 14.Nakata A, Nakagawa Y, Nishida M, Nozaki S, Miyagawa J, Nakagawa T, Tamura R, Matsumoto K, Kameda-Takemura K, Yamashita S, Matsuzawa Y. CD36, a novel receptor for oxidized low-density lipoproteins, is highly expressed on lipid-laden macrophages in human atherosclerotic aorta. Arterioscler Thromb Vasc Biol. 1999;19:1333–9. doi: 10.1161/01.atv.19.5.1333. [DOI] [PubMed] [Google Scholar]
- 15.Linton M, Fazio S. Class A scavenger receptors, macrophages and atherosclerosis. Current Opinion in Lipidology. 2001;12:489–495. doi: 10.1097/00041433-200110000-00003. [DOI] [PubMed] [Google Scholar]
- 16.Krieger M, Herz J. Structures and functions of multiligand lipoprotein receptors-macropahge scavenger receptors and LDL receptor-related protein (LRP) Ann Rev Biochem. 1994;63:601–637. doi: 10.1146/annurev.bi.63.070194.003125. [DOI] [PubMed] [Google Scholar]
- 17.De Rijke YB, Biessen EA, Vogelezang CJ, van Berkel TJ. Binding characteristics of scavenger receptors on liver endothelial and Kupffer cells for modified low-density lipoproteins. Biochem J. 1994;304(Pt 1):69–73. doi: 10.1042/bj3040069. [DOI] [PMC free article] [PubMed] [Google Scholar]
- 18.Gough PJ, Gordon S. The role of scavenger receptors in the innate immune system. Microbes Infect. 2000;2:305–11. doi: 10.1016/s1286-4579(00)00297-5. [DOI] [PubMed] [Google Scholar]
- 19.Horiuchi S, Sakamoto Y, Sakai M. Scavenger receptors for oxidized and glycated proteins. Amino Acids. 2003;25:283–92. doi: 10.1007/s00726-003-0029-5. [DOI] [PubMed] [Google Scholar]
- 20.Ottnad E, Via DP, Frubis J, Sinn H, Friedrich E, Ziegler R, Dresel HA. Differentiation of binding sites on reconstituted hepatic scavenger receptors using oxidized low-density lipoprotein. Biochem J. 1992;281(Pt 3):745–51. doi: 10.1042/bj2810745. [DOI] [PMC free article] [PubMed] [Google Scholar]
- 21.Abraham R, Singh N, Mukhopadhyay A, Basu SK, Bal V, Rath S. Modulation of immunogenicity and antigenicity of proteins by maleylation to target scavenger receptors on macrophages. J Immunol. 1995;154:1–8. [PubMed] [Google Scholar]
- 22.Fong L, Le D. The processing of ligands by class A scavenger receptor is dependent on signal information located in the cytoplasmic domain. Journal of Biological Chemistry. 1999;274:26808–26816. doi: 10.1074/jbc.274.51.36808. [DOI] [PubMed] [Google Scholar]
- 23.Artemov D. Molecular magnetic resonance imaging with targeted contrast agents. J Cell Biochem. 2003;90:518–24. doi: 10.1002/jcb.10660. [DOI] [PubMed] [Google Scholar]
- 24.Rhainds D, Falstrault L, Tremblay C, Brissette L. Uptake and fate of class B scavenger receptor ligands in HepG2 cells. Eur J Biochem. 1999;261:227–35. doi: 10.1046/j.1432-1327.1999.00264.x. [DOI] [PubMed] [Google Scholar]
- 25.Haberland ME, Tannenbaum CS, Williams RE, Adams DO, Hamilton TA. Role of the maleyl-albumin receptor in activation of murine peritoneal macrophages in vitro. J Immunol. 1989;142:855–62. [PubMed] [Google Scholar]
- 26.Mirzadeh S, Brechbiel MW, Atcher RW, Gansow OA. Radiometal labeling of immunoproteins: covalent linkage of 2-(4-isothiocyanatobenzyl)diethylenetriaminepentaacetic acid ligands to immunoglobulin. Bioconjug Chem. 1990;1:59–65. doi: 10.1021/bc00001a007. [DOI] [PubMed] [Google Scholar]
- 27.Butler P, Hartley B. Maleylation of proteins. Methods in Enzymology. 1972;25:191–199. doi: 10.1016/S0076-6879(72)25016-9. [DOI] [PubMed] [Google Scholar]
- 28.Benson JR, Hare PE. O-phthalaldehyde: fluorogenic detection of primary amines in the picomole range. Comparison with fluorescamine and ninhydrin. Proc Natl Acad Sci U S A. 1975;72:619–22. doi: 10.1073/pnas.72.2.619. [DOI] [PMC free article] [PubMed] [Google Scholar]
- 29.Roth M. Fluorescence reaction for amino acids. Anal Chem. 1971;43:880–2. doi: 10.1021/ac60302a020. [DOI] [PubMed] [Google Scholar]
- 30.Carmichael J, Degraff WG, Gazdar AF, Minna JD, Mitchell JB. Evaluation of a tetrazolium-based semiautomated colorimetric assay: assessment of chemosensitivity testing. Cancer Res. 1987;47:936–942. [PubMed] [Google Scholar]
- 31.Penefsky HS. Reversible binding of Pi by beef-heart mitochondrial adenosine- triphosphatase. J Biol Chem. 1977;252:2891–2899. [PubMed] [Google Scholar]
- 32.Islam M, Qamar S, Tayyab S. Involvement of lysine residues of goat serum albumin in high-affinity binding of bilirubin. Biochim Biophys Acta. 1994;1205:171–7. doi: 10.1016/0167-4838(94)90230-5. [DOI] [PubMed] [Google Scholar]
- 33.Horiuchi S, Takata K, Araki N, Morino Y. Regional ligand domain is involved in scavenger receptor-mediated recognition of maleyl-albumin by rat sinusoidal liver cells. J Mol Recognit. 1989;2:56–62. doi: 10.1002/jmr.300020203. [DOI] [PubMed] [Google Scholar]
- 34.Ohyoshi E, Kohata S. The binding of Yb(III) and Gd(III) to bovin serum albumin by a competitive spectrophotometry. J Inorg Biochem. 1993;52:157–63. doi: 10.1016/0162-0134(93)80036-9. [DOI] [PubMed] [Google Scholar]
- 35.Niemi P, Koskinen S, Reisto T. Tissue relaxation enhancement after intravenous administration of (ITCB-DTPA)-gadolinum conjugated albumin, an intravascular magnetic resonance imaging contrast agent. Invest Radiol. 1991;26:674–80. doi: 10.1097/00004424-199107000-00012. [DOI] [PubMed] [Google Scholar]
- 36.Corot C, Violas X, Robert P, Gagneur G, Port M. Comparison of different types of blood pool agents (P792, MS325, USPIO) in a rabbit MR angiography-like protocol. Invest Radiol. 2003;38:311–9. [PubMed] [Google Scholar]
- 37.Ogan MD, Schmiedl U, Moseley ME, Grodd W, Paajanen H, Brasch RC. Albumin labeled with Gd-DTPA. An intravascular contrast-enhancing agent for magnetic resonance blood pool imaging: preparation and characterization. Invest Radiol. 1987;22:665–71. [PubMed] [Google Scholar]
- 38.Meyer D, Schaefer M, Bonnemain B. Gd-DOTA, a potential MRI contrast agent. Current status of physicochemical knowledge. Invest Radiol. 1988;23 Suppl 1:S232–5. doi: 10.1097/00004424-198809001-00048. [DOI] [PubMed] [Google Scholar]
- 39.Caravan P, Greenfield M, Li Z, Sherry A. The Gd3+ complex of a fatty acid analogue of DOTP binds to multiple albumin sites with variable water relaxivities. Inorg Chem. 2001;40:6580–6587. doi: 10.1021/ic0102900. [DOI] [PubMed] [Google Scholar]
- 40.Caravan P, Ellison J, McMurry T, Lauffer R. Gadolinium (III) chelates as MRI contrast agents: Structure, dynamics, and applications. Chem Rev. 1999;99:2293–2352. doi: 10.1021/cr980440x. [DOI] [PubMed] [Google Scholar]
- 41.Anelli P, Bertini I, Fragai M, Lattuada L, Luchinat C, Parigi G. Sulfonamide-functionalized gadolinium DTPA complexes as possible contrast agents for MRI: a relaxometric investigation. Eur J Biochem. 2000:625–630. [Google Scholar]
- 42.Nivorozhkin A, Kolodziej A, Caravan P, Greenfield M, Lauffer R, McMurry T. Enzyme-activated Gd3+ magnetic resonance imaging contrast agents with a prominent receptor-induced magnetization enhancement. Angew Chem Intl Ed. 2001;40:2903–2906. doi: 10.1002/1521-3773(20010803)40:15<2903::AID-ANIE2903>3.0.CO;2-N. [DOI] [PubMed] [Google Scholar]
- 43.Nunn AD, Linder KE, Tweedle MF. Can receptors be imaged with MRI agents? Q J Nucl Med. 1997;41:155–62. [PubMed] [Google Scholar]
- 44.Ahrens E, Rothbacher U, Jacobs R, Fraser S. A model for MRI contrast enhancement using T1 agents. PNAS. 1998;95:8443–8448. doi: 10.1073/pnas.95.15.8443. [DOI] [PMC free article] [PubMed] [Google Scholar]
- 45.Aime S, Furllano L, Crich S. Comparmentalization of a gadolinium complex in the apoferritin cavity: a route to obtain high relaxivity contrast agent for magnetic resonance imaging. Angew Chem Int Ed. 2002;41:1017–1019. doi: 10.1002/1521-3773(20020315)41:6<1017::aid-anie1017>3.0.co;2-p. [DOI] [PubMed] [Google Scholar]
- 46.Dafni H, Israely T, Bhujwalla Z, Benjamin L, Neeman M. Overexpression of vascular endothelial growth factor 165 drives peritumor interstitial convection and induces lymphatic drain: Magnetic Resonance Imaging, confocal microscopy, and histological tracking of triple-labeled albumin. Cancer Research. 2002;62:6731–6739. [PubMed] [Google Scholar]
- 47.Ward D, Ajioka R, Kaplan J. Cohort movement of different ligands and receptors in the intracellular endocytic pathway of alveolar macrophages. J Biol Chem. 1989;264:8164–8170. [PubMed] [Google Scholar]
- 48.Ottnad E, Via DP, Sinn H, Friedrich E, Ziegler R, Dresel HA. Binding characteristics of reduced hepatic receptors for acetylated low-density lipoprotein and maleylated bovine serum albumin. Biochem J. 1990;265:689–98. doi: 10.1042/bj2650689. [DOI] [PMC free article] [PubMed] [Google Scholar]
- 49.Goldstein J, Brown M, Anderson R, Russell D, Schneider W. Receptor-mediated endocytosis. Ann Rev Cell Bio. 1985;1 doi: 10.1146/annurev.cb.01.110185.000245. [DOI] [PubMed] [Google Scholar]
- 50.Murphy J, Tedbury P, HomerVanniasinkam S, Walker J, Ponnambalam S. Biochemistry and cell biology of mammalian scavenger receptors. Atherosclerosis. 2005;182:1–15. doi: 10.1016/j.atherosclerosis.2005.03.036. [DOI] [PubMed] [Google Scholar]
- 51.Harwood H, Pellarin L. Kinetics of low-density lipoprotien receptor activity in Hep-G2 cells: derivation and validation of a Briggs-Haldane-based kinetic model for evaluating receptor-mediated endocytotic processes in which receptors recycle. Biochem J. 1997;323:649–659. doi: 10.1042/bj3230649. [DOI] [PMC free article] [PubMed] [Google Scholar]
- 52.Lendon C, Davies M, Born G, Richardson P. Atherosclerotic plaque caps are locally weakened when macrophages density is increased. Atherosclerosis. 1991;87:87–90. doi: 10.1016/0021-9150(91)90235-u. [DOI] [PubMed] [Google Scholar]
- 53.Celletti F, Waugh J, Amabile P, Brendolan A, Hilfiker P, Dake M. Vascular endothelial growth factor enhances atherosclerotic plaque progression. Nat Med. 2001;7:425–429. doi: 10.1038/86490. [DOI] [PubMed] [Google Scholar]
- 54.McCarthy MJ, Loftus IM, Thompson MM, Jones L, London NJ, Bell PR, Naylor AR, Brindle NP. Angiogenesis and the atherosclerotic carotid plaque: an association between symptomatology and plaque morphology. J Vasc Surg. 1999;30:261–8. doi: 10.1016/s0741-5214(99)70136-9. [DOI] [PubMed] [Google Scholar]
- 55.Lastas A, Graziene V, Barkauskas E, Salkus G, Rimkevicius A. Carotid artery atherosclerotic plaque: clinical and morphological-immunohistochemical correlation. Med Sci Monit. 2004;10:CR606–14. [PubMed] [Google Scholar]
- 56.Schmitz SA, Taupitz M, Wagner S, Coupland SE, Gust R, Nikolova A, Wolf KJ. Iron-oxide-enhanced magnetic resonance imaging of atherosclerotic plaques: postmortem analysis of accuracy, inter-observer agreement, and pitfalls. Invest Radiol. 2002;37:405–11. doi: 10.1097/00004424-200207000-00008. [DOI] [PubMed] [Google Scholar]
- 57.Oyewumi M, Yokel R, Jay M, Coakley T, Mumper R. Comparison of celluptake, biodistribution and tumor retention of folate-covered and PEG-coated gadolinium nanoparticles in tumor-bearing mice. J Controled Release. 2004;95:613–626. doi: 10.1016/j.jconrel.2004.01.002. [DOI] [PubMed] [Google Scholar]
- 58.Allen MJ, MacRenaris KW, Venkatasubramanian PN, Meade TJ. Cellular delivery of MRI contrast agents. Chem Biol. 2004;11:301–7. doi: 10.1016/j.chembiol.2004.03.003. [DOI] [PubMed] [Google Scholar]
- 59.Aime S, Cabella C, Colombatto S, Crich S, Gianolio E, Maggioni F. Insights into the use of paramagnetic Gd(III) complexes in MR-molecular imaging investigations. J Mag Res Imaging. 2002;16:394–406. doi: 10.1002/jmri.10180. [DOI] [PubMed] [Google Scholar]
- 60.Alauddin M, Louie A, Shahinian A, Meade T, Conti P. Receptor mediated uptake of a radiolabeled contrast agent sensitive to b-galactoside activity. Nucl Med and Biol. 2003;30:261–265. doi: 10.1016/s0969-8051(02)00392-x. [DOI] [PubMed] [Google Scholar]
- 61.Margerum L, Campion B, Koo M, Shargill N, Lai J, Marumoto A, Sontum P. Gadolinium(III) DO3A macrocycles and polyethylene glycol coupled to dendrimers. Effect of molecular weight on physical and biological properties of macromolecular magnetic resonance imaging contrast agents. J Alloys and Compounds. 1997;249:185–190. [Google Scholar]
- 62.Kobayashi H, Kawamoto S, Star R, Waldmann T, Brechbiel M, Choyke P. Activated clearance of a biotinylated macromolecular MRI contrast agent from the blood pool using an avidin chase. Bioconjug Chem. 2003;14:1044–1047. doi: 10.1021/bc034064l. [DOI] [PubMed] [Google Scholar]
- 63.Wiener E, Konda S, Shadron A, Brechbiel M, Gansow O. Targeting dendrimer-chelates to tumors and tumor cells expressing the high-affinity folate receptor. Invest Radiol. 1997;32:748–754. doi: 10.1097/00004424-199712000-00005. [DOI] [PubMed] [Google Scholar]
- 64.Chen JW, Pham W, Weissleder R, Bogdanov A., Jr Human myeloperoxidase: a potential target for molecular MR imaging in atherosclerosis. Magn Reson Med. 2004;52:1021–8. doi: 10.1002/mrm.20270. [DOI] [PubMed] [Google Scholar]
- 65.Botnar RM, Perez AS, Witte S, Wiethoff AJ, Laredo J, Hamilton J, Quist W, Parsons EC, Jr, Vaidya A, Kolodziej A, Barrett JA, Graham PB, Weisskoff RM, Manning WJ, Johnstone MT. In vivo molecular imaging of acute and subacute thrombosis using a fibrin-binding magnetic resonance imaging contrast agent. Circulation. 2004;109:2023–9. doi: 10.1161/01.CIR.0000127034.50006.C0. [DOI] [PMC free article] [PubMed] [Google Scholar]
- 66.Spuentrup E, Buecker A, Katoh M, Wiethoff A, Parsons E, Botnar R, Weisskoff R, Graham P, manning W, Gunther R. Molecular magnetic resonance imaging of coronary thrombosis and pulmonary emboli with a novel fibrin-targeted contrast agent. Circulation. 2005;111:1377–1382. doi: 10.1161/01.CIR.0000158478.29668.9B. [DOI] [PubMed] [Google Scholar]
- 67.Mitsumori L, Ricks J, Rosenfeld M, Schmiedl U, Yuan C. Development of a lipoprotein based molecular imaging MR contrast agent for the noninvasive detection of early atherosclerotic disease. Intl J Cardiovasc Imaging. 2004;20:561–567. doi: 10.1007/s10554-004-7020-4. [DOI] [PubMed] [Google Scholar]
- 68.Crossgrove J, Zhang W. Maganese toxicity upon overexposure. NMR in Biomedicine. 2004;17:544–553. doi: 10.1002/nbm.931. [DOI] [PMC free article] [PubMed] [Google Scholar]
- 69.Gallez B, Baudelet C, Adline J, Geurts M, Delzenne N. Accumulation of manganese in the brain of mice after intravenous injection of manganese-based contrast agents. Chem Res Toxicol. 1997;10:360–363. doi: 10.1021/tx960194p. [DOI] [PubMed] [Google Scholar]
- 70.Ruehm S, Corot C, Vogt P, Kolb S, Debatin J. Magnetic resonance imaging of atherosclerotic plaque with ultrasmall superparamagnetic particles of iron oxide in hyperlipidemic rabbits. Circulation. 2001;103:415–422. doi: 10.1161/01.cir.103.3.415. [DOI] [PubMed] [Google Scholar]
- 71.Baxter AB, Melnikoff S, Stites DP, Brasch RC. AUR Memorial Award 1991. Immunogenicity of gadolinium-based contrast agents for magnetic resonance imaging. Induction and characterization of antibodies in animals. Invest Radiol. 1991;26:1035–40. doi: 10.1097/00004424-199112000-00001. [DOI] [PubMed] [Google Scholar]
- 72.Perico ME, Chinol M, Nacca A, Luison E, Paganelli G, Canevari S. The humoral immune response to macrocyclic chelating agent DOTA depends on the carrier molecule. J Nucl Med. 2001;42:1697–703. [PubMed] [Google Scholar]
- 73.Frotschl R, Weickardt S, Stazewski S, Kaufman G, Kasper P. Effects of chlorpromazine with and without UV irradiation on gene expression of HepG2 cells. Mutation Research. 2005;575 doi: 10.1016/j.mrfmmm.2005.03.002. [DOI] [PubMed] [Google Scholar]
- 74.Petruska J, Frank D, Freeman G, Evans E, Macdonald J. Toxicity and carcinogenicity studies of chlorpromazine hydrochloride and p-cresidine in the p53 heterozygous mouse model. Toxicologic Pathology. 2002;30:696–704. doi: 10.1080/01926230290166788. [DOI] [PubMed] [Google Scholar]
- 75.Adams C. Chlorpromazine for schizophrenia: A Cochran systematic review of 50 years of randomized controlled studies. BMC Med. 2005;3:15. doi: 10.1186/1741-7015-3-15. [DOI] [PMC free article] [PubMed] [Google Scholar]
- 76.Andres M, Repetto G, Sanz P, Repetto M. Biochemical effects of chlorpromazine on mouse neuroblastoma cells. Veterinary and Human Toxicology. 1999;5:273–278. [PubMed] [Google Scholar]
- 77.Schmiedl U, Ogan M, Paajanen H, Marotti M, Crooks LE, Brito AC, Brasch RC. Albumin labeled with Gd-DTPA as an intravascular, blood pool-enhancing agent for MR imaging: biodistribution and imaging studies. Radiology. 1987;162:205–10. doi: 10.1148/radiology.162.1.3786763. [DOI] [PubMed] [Google Scholar]
- 78.Turetschek K, Huber S, Floyd E, Helbich T, Roberts TP, Shames DM, Tarlo KS, Wendland MF, Brasch RC. MR imaging characterization of microvessels in experimental breast tumors by using a particulate contrast agent with histopathologic correlation. Radiology. 2001;218:562–9. doi: 10.1148/radiology.218.2.r01fe37562. [DOI] [PubMed] [Google Scholar]
- 79.Turetschek K, Huber S, Helbich T, Floyd E, Tarlo KS, Roberts TP, Shames DM, Wendland MF, Brasch RC. Dynamic MRI enhanced with albumin-(Gd-DTPA)30 or ultrasmall superparamagnetic iron oxide particles (NC100150 injection) for the measurement of microvessel permeability in experimental breast tumors. Acad Radiol. 2002;9 Suppl 1:S112–4. doi: 10.1016/s1076-6332(03)80413-0. [DOI] [PubMed] [Google Scholar]
- 80.Preda A, Novikov V, Moglich M, Turetschek K, Shames DM, Brasch RC, Cavagna FM, Roberts TP. MRI monitoring of Avastin antiangiogenesis therapy using B22956/1, a new blood pool contrast agent, in an experimental model of human cancer. J Magn Reson Imaging. 2004;20:865–73. doi: 10.1002/jmri.20184. [DOI] [PubMed] [Google Scholar]
- 81.Preda A, Novikov V, Moglich M, Floyd E, Turetschek K, Shames DM, Roberts TP, Corot C, Carter WO, Brasch RC. Magnetic resonance characterization of tumor microvessels in experimental breast tumors using a slow clearance blood pool contrast agent (carboxymethyldextran-A2-Gd-DOTA) with histopathological correlation. Eur Radiol. 2005;15:2268–75. doi: 10.1007/s00330-005-2823-9. [DOI] [PubMed] [Google Scholar]
- 82.Li KL, Wilmes LJ, Henry RG, Pallavicini MG, Park JW, Hu-Lowe DD, McShane TM, Shalinsky DR, Fu YJ, Brasch RC, Hylton NM. Heterogeneity in the angiogenic response of a BT474 human breast cancer to a novel vascular endothelial growth factor-receptor tyrosine kinase inhibitor: assessment by voxel analysis of dynamic contrast-enhanced MRI. J Magn Reson Imaging. 2005;22:511–9. doi: 10.1002/jmri.20387. [DOI] [PubMed] [Google Scholar]