

Abstract
DNA methylation is an important component of epigenetic modifications that influences the transcriptional machinery and is aberrant in many human diseases. Several methods have been developed to map DNA methylation for either limited regions or genome-wide. In particular, antibodies specific for methylated CpG have been successfully applied in genome-wide studies. However, despite the relevance of the obtained results, the interpretation of antibody enrichment is not trivial. Of greatest importance, the coupling of antibody-enriched methylated fragments with microarrays generates DNA methylation estimates that are not linearly related to the true methylation level. Here, we present an experimental and analytical methodology, MEDME (modeling experimental data with MeDIP enrichment), to obtain enhanced estimates that better describe the true values of DNA methylation level throughout the genome. We propose an experimental scenario for evaluating the true relationship in a high-throughput setting and a model-based analysis to predict the absolute and relative DNA methylation levels. We successfully applied this model to evaluate DNA methylation status of normal human melanocytes compared to a melanoma cell strain. Despite the low resolution typical of methods based on immunoprecipitation, we show that model-derived estimates of DNA methylation provide relatively high correlation with measured absolute and relative levels, as validated by bisulfite genomic DNA sequencing. Importantly, the model-derived DNA methylation estimates simplify the interpretation of the results both at single-loci and at chromosome-wide levels.
Epigenetics can be defined as the study of changes in the regulation of gene activity and expression that are not driven by gene sequence information. Epigenetic alterations are now well recognized as highly relevant to many common human diseases (Esteller 2007; Jirtle and Skinner 2007). For this reason, a major effort is dedicated to map epigenetic modifications throughout the human genome.
The two main recognized processes in epigenetics are DNA-packaging and DNA methylation. In the former, histones are primarily responsible for the packaging of the DNA, which in turn determines local accessibility to the transcriptional machinery and subsequent gene activity. In particular, many post-translational modifications of histones control this packaging (Goldberg et al. 2007). In the second process, cytosines in CpG dinucleotides are modified by the addition of a methyl group. These subtle alterations are exceedingly influential in the control of gene transcription (Goldberg et al. 2007).
DNA packaging and methylation are intricately connected and highly interdependent (Goldberg et al. 2007). Nonetheless, a complete evaluation of the former remains a challenge, as it requires the evaluation of an extensive set of possible post-translational histone modifications under a variety of conditions. On the other hand, DNA methylation is extremely attractive for biomarker discovery due to its stability, as well as the promise of inexpensive and simple diagnostic tests for its detection (Esteller 2003).
Thus far, several approaches are available to determine DNA methylation level. Although bisulfite genomic DNA sequencing is the gold standard for identifying the methylation status of specific CpGs, it is not yet well suited for high-throughput analysis (Esteller 2003). A recent publication reported bisulfite DNA sequencing of the Arabidopsis genome (Cokus et al. 2008); however, the size of the sequenced genome (120 Mb) is far smaller than those of the mouse and human. Other techniques based on restriction enzymes, proteins that bind methylated CpG in vivo, or antibodies are currently used for genome-wide quantitative analysis. In the first, a cocktail of methylation-sensitive and -insensitive restriction enzymes is utilized to digest the DNA (Schumacher et al. 2006). The advantage of this technique is that the enrichment of methylated/unmethylated sequences is not dependent on the density of CpG pairs. Nonetheless, the restriction enzymes are only capable of recognizing a limited subset of CpG sites, even when combined in a cocktail. In the second technique, methylated DNA binding proteins are used to enrich fragments of DNA (Ballestar et al. 2003). In the third approach, antibodies directed against methylated CpGs (mCpG) are used to enrich DNA in methylated sequences (methylated DNA immuno precipitation, or MeDIP) (Weber et al. 2005). The primary advantage of the binding protein and antibody-based techniques is the independence of the enrichment from the sequence surrounding the CpG sites, that is, regardless of whether the CpGs fall within specific restriction endonuclease recognition sequences, they will be recognized. The disadvantage is the incursion of noise in regions with a low CpG density. For either methodology, the resulting sets of enriched sequences are either directly sequenced or hybridized to oligonucleotide microarrays.
MeDIP-based studies have shown that antibody enrichment allows a quantitative determination of DNA methylation level and is correlated with the amount of RNA polymerase II binding, indicating either transcriptional activity or repression (Weber et al. 2005, 2007). However, the analysis of DNA methylation levels estimated by MeDIP enrichment suffers from several pitfalls that have not been adequately addressed.
Of greatest concern is the incorrect assumption in current MeDIP analysis which forces a linear relationship between the MeDIP enrichment estimates and the true methylation levels. Second, the locus-specific validations reported in Weber et al. (2005) clearly indicate that the prediction of DNA methylation level as a function of the antibody enrichment is nontrivial and is exceedingly dependent on the overall CpG content of the corresponding region. Third, MeDIP enrichment is determined as a log-ratio (logR) of the enriched and input fractions. This measure, which differs from the logR associated with gene expression, lacks an intuitive interpretation, as its dynamic range is arbitrarily assigned to hypo- and hyper-methylated regions. Disregarding these relevant observations severely affects the estimation of both absolute and differential DNA methylation levels. Similar fundamental issues have previously been investigated in high-throughput gene-expression studies, resulting in the development of methodologies for data analysis that more accurately estimate the level of expression and the subsequent identification of differentially expressed genes (Allison et al. 2006).
Here we show that MeDIP enrichment is a nonlinear function of the true methylation level and propose the combination of an experimental and analytical methodology, MEDME (modeling experimental data with MeDIP enrichment), to improve the evaluation and interpretation of MeDIP derived DNA methylation estimates.
Results
Modeling the relationship between MeDIP enrichment and true DNA-methylation level
Previously, studies have assumed that the MeDIP assay generates an antibody enrichment, which increases linearly with the number of methylated CpGs (mCpGs). However, there is no conclusive evidence for this assumption, as it was based on a limited set of genomic loci, and disregards the effect of microarray hybridization (Weber et al. 2005). In order to definitively estimate this relationship, we designed a high-throughput experiment where the true methylation level is known.
In brief, we generated fully methylated DNA by treating unmethylated DNA with CpG methyltransferase (for details and validation, see Methods). In the resulting DNA sample, in which every CpG is methylated, MeDIP enrichment is expected to be a direct function of the density of CpGs on the genome. In order to determine the relationship between the estimated and true methylation level, probe-level MeDIP enrichment was then compared to genomic CpG content.
After applying the MeDIP assay to the fully methylated DNA, it was hybridized to tiling arrays containing probes for the entire X chromosome. The input DNA, not enriched with MeDIP, was labeled and hybridized to the same array as the control. Subsequently, the log ratio of MeDIP to input (logR) is accurately interpreted as a measure of enrichment. Typically, scoring of tiling array probes in ChIP-chip experiments is based on smoothing the data by substituting the probe-level measure with the average or weighted-average over a set of adjacent probes (Irizarry et al. 2008). Similarly, we defined the MeDIP enrichment for each probe i as the weighted-average of probes in a 1 kbp window centered at the probe i (for details, see Methods). There were two important considerations in this definition. First, the size of the window directly affects the determination of each probe’s CpG count (i.e., the actual methylation level). Secondly, the distance between CpGs can alter the probe intensity. As such, we decided to underweight the signal from probes far from the one under consideration. Ultimately, we paired linear weighting with the 1 kbp window size to determine the number of CpGs for each probe (CpGw; for details, see Methods). In the experimental data set, CpGw and mCpGw are equivalent, as every CpG is expected, to be methylated.
We performed two independent microarray hybridizations with the experimental data. In the first, the genuine relationship between the enrichment level and the effective DNA methylation status was established. Figure 1A displays a density scatterplot of the first hybridization, showing the probe-level MeDIP enrichment versus the log2 mCpGw. A clear sigmoidal trend can be observed by evaluating the median values within a series of bins over the entire range of methylation. As such we approximated this trend with a logistic model. The residuals for the model based on the median values were symmetrically distributed around 0 (data not shown), and the goodness of fit confirmed (deviance χ2 P-value = 5 × 10−58). The scattering of observations around the logistic curve, visible in Figure 1A, is attributed to noise resulting from the combination of antibody enrichment and microarray background. As discussed in Weber et al. (2007), the mCpG-specific antibody is expected to show less stable binding of target sequences with low mCpG density. Thus, we anticipated noisier enrichment measurements in regions with low mCpG density and a considerable decrease in scattering as the level of methylation increases. Two plateaus in the logistic function are evident in Figure 1A: the first corresponds to a log2 methylation level less than one and is attributed to background noise; the second is associated with levels higher than five and is due to antibody saturation. The accurate detection of less than two mCpGw within a 1 kbp window is not expected, as this is approximately equivalent to finding four methylated CpGs in a similar size region. Similarly, precisely estimating more than 32 mCpGw is equivalent to clearly delineating over 64 mCpGs within a 1 kbp region. In the experimental data, ∼15% of the probes have less than two mCpGw in a 1 kbp window and 5.5% have more than 16 mCpGw. Based on the data from the first hybridization, we implemented a parametric model that allows us to predict the number of mCpGws as a function of the MeDIP enrichment. This value is termed the absolute methylation score (AMS) (for details, see Methods).
Figure 1.

MeDIP logR is a logistic function of the log-methylation level. (A) The logistic model (blue line) describes the association between MeDIP log2R and the log2 observed methylation level. Using fully methylated genomic DNA, we determined the methylation level based on the weighted count of mCpG in a 1 kb window centered at each probe (mCpGw, using chromosome X tiling array). The red dots identify the median MeDIP logR within each bin across the entire mCpGw dynamic range. (B) The absolute methylation score (AMS) and expected DNA methylation level across the X chromosome. The model parameters estimated from the first hybridization have been applied to the MeDIP logR derived from the second hybridization (black line) to determine the log2(AMS) (red line). Log2(mCpGw) corresponds to the expected methylation level (blue line). The log relative methylation score (RMS) is drawn with the gold line. All the estimates are chromosome-wide smoothed by means of cubic splines.
Determination of model-derived absolute and relative DNA methylation estimates
The data obtained from the second hybridization was employed to test the consistency of the model on an independent experiment. As such, the model parameters obtained from the data in the first hybridization were subsequently used to predict the probe-level absolute methylation (AMS) based on the MeDIP enrichment in the second hybridization. The AMS was compared to the expected methylation level (mCpGw) across the entire X chromosome and is reported in Figure 1B. The correlation between probe-level AMS and mCpGw is quite good (Pearson correlation coefficient = 0.60), while the correlation with the chromosome-wide data smoothed by cubic splines is quite impressive (Pearson correlation coefficient = 0.93). This result indicates that the model can successfully estimate the number of mCpGs and confirms that sets of adjacent probes are more informative than individual ones (Irizarry et al. 2008).
When evaluating the methylation status resulting from bisulfite genomic DNA sequencing, one usually considers both the absolute and relative number of mCpGs as both provide relevant and complementary information. It is possible to derive a relative measure of methylation by normalizing AMS with respect to the total number of CpGs represented by CpGw. This allows us to obtain a relative measure of the methylation that is independent of the CpG density of the corresponding region. This measure is termed the relative methylation score (RMS) (for details, see Methods). We show that the RMS is especially useful when comparing regions with different CpG densities. In the experimental data set, where every single CpG is expected to be methylated, the RMS is expected to be 1. The log2 RMS is in fact symmetrically distributed around 0 (data not shown), as is the profile over chromosome X determined by cubic spline smoothing (Fig. 1B).
These results reinforce the aforementioned goodness-of-fit of the model. Subsequently, we evaluated its application to a real data set, using the same microarray platform and protocol.
Application of the methodology to a real-life data set
In order to validate the methodology and to show the envisaged advantages, it was applied to a real-life data set. MeDIP was used to determine and compare the DNA methylation status of two cell types: normal newborn melanocytes (NBMEL) and a melanoma cell strain (YUSAC2) (two hybridizations each). For the same samples, genome-wide expression data are also available with four replicates each, using NimbleGen expression arrays. The weighted-average of MeDIP logR was determined, and the model applied to determine both the AMS and RMS.
Promoter regions are known to be hypo-methylated in comparison with other genomic regions and relatively hyper-methylated in tumor compared to healthy samples (Esteller 2007). Genomic regions differ greatly in terms of CpG content. Hence, to address this bias it is convenient to normalize the methylation level. The RMS is well suited for this purpose, and clearly shows that promoters are generally hypo-methylated in comparison to the other genomic regions (for their definition, see Methods) (Fig. 2A,B). Moreover, it confirms that promoters are generally hyper-methylated in melanoma (Fig. 2C). Notably, when evaluating the MeDIP enrichment it is not possible to discern any promoter hypo-methylation (Fig. 2D,E). Only an increase in the melanoma promoter enrichment can be observed, without a measure of its magnitude (Fig. 2F).
Figure 2.

Probe-level methylation in the different genomic regions. This figure shows the distribution of probe-level RMS in the different genomic regions for NBMEL (A) and YUSAC2 (B). Comparison of promoter RMS for the two samples is reported in C. Distribution of MeDIP logR in the different genomic regions for NBMEL (D) and YUSAC2 (E). Comparison of promoter MeDIP logR for the two samples is shown in F. All the distributions have been normalized by the number of probes in each genomic region. Promoter regions identify probes within 1 kb upstream of the TSS; intergenic Upstream identify probes within 1–4 kb upstream of the TSS.
Promoter DNA methylation is expected to determine transcriptional repression of the downstream gene. Indeed, the average RMS of promoters shows a striking negative correlation with the expression of the downstream genes (for an example of the 1035 transcripts available on the chromosome X for the NBMEL sample, see Fig. 3). Of note, when repeating the same analysis with the average MeDIP logR of the same promoters, the association between DNA methylation and gene expression is decidedly noisier (see small box in Fig. 3).
Figure 3.

Association of average NBMEL promoter RMS with gene expression level. For each RMS bin, the gene expression box-and-whisker plot is reported (the box identifying the first, second, and third quartile of the log2 average gene expression). The line represents the trend over the median values. (Inset) Shows the same analysis with the MeDIP logR on the X-axis.
Gene-level validation
The absolute and relative methylation levels predicted by our methodology have been compared with the absolute and relative methylation levels determined by bisulfite genomic DNA sequencing for 14 loci on both NBMEL and YUSAC2 samples. This comparison is complicated by two issues. First, the resolution of bisulfite genomic DNA sequencing is significantly higher than MeDIP, where the resolution is limited by the size of the fragments required for immunoprecipitation. This results in a decrease in accuracy of methylation measurement, especially in regions where the methylation level is highly variable. Second, the AMS is expected to be linearly related to the real absolute number of mCpG; however, the absolute levels are not expected to be comparable. In fact, the size of the amplicons for bisulfite sequencing is significantly smaller than the 1 kb region used to determine the AMS. Moreover, AMS results from a weighted average of the methylated CpGs in a 1-kbp region as opposed to the nonweighted estimate as measured in an exact loci.
Despite these complications, the AMS and RMS exhibit a relatively high correlation with the real absolute and relative number of CpGs (0.75 and 0.75, respectively, Fig. 4A,B; see Supplementary Table 2 for the actual numbers). The probe-level data available in the region around the amplicons is also reported for two genes (ARMCX2 and ZIC3; Figure 4C,D) in agreement with bisulfite genomic DNA sequencing for five clones (Fig. 4E,F). For example, regarding ZIC3 relative DNA methylation level, 10% (NBMEL) and 75% (YUSAC2) 100*mCpG/CpG are predicted in 1 kb, and 0% (NBMEL) and 67% (YUSAC2) are found in the 221-bp sequenced amplicon.
Figure 4.

Validation with bisulfite genomic DNA sequencing. Promoter methylation status in 14 genes are determined by bisulfite sequencing and compared with the AMS (A, Y-axis) and RMS (B, Y-axis) on both NBMEL and YUSAC2 samples. AMS and RMS refer here to the average for the probes within the amplicon used for bisulfite genomic DNA sequencing. Weighted MeDIP logR (MeDIPw), absolute (AMS) and relative (RMS) measurement of methylation level in ARMCX2 promoter (C) and ZIC3 promoter (D) are shown. Gray lines indicate the regions analyzed by bisulfite genomic DNA sequencing. CpGr indicates the CpG ratio for each probe (for details, see Methods). Bisulfite sequencing of differentially methylated ARMCX2 promoter (E) and ZIC3 promoter (F) are shown. Each line represents the sequence of a single clone. CpGs are represented as open dots (if unmethylated) or filled dots (if methylated). The percentage of CpG methylation is indicated for each amplicon.
In order to verify that the model is applicable to a microarray platform with a different design, the same samples were subjected to MeDIP and the DNA was hybridized to a genome-wide promoter tiling array manufactured by NimbleGen. Despite the completely different design of the two microarray platforms, the results were highly consistent (see as an example, ARMCX2 in Supplemental Fig. 3).
Discussion
MeDIP is currently one of the best methods available for genome-wide enrichment of DNA methylated sequences (Weber et al. 2005, 2007). Despite its relatively poor resolution in comparison to bisulfite DNA sequencing, the precipitation with methylated cytosine specific-antibody is one of the few techniques that allows unbiased evaluation of DNA methylation genome-wide. Despite its popularity, we found pitfalls in the analysis of MeDIP derived data that required further investigation.
DNA methylation measure based on MeDIP enrichment eludes a clear interpretation, as one is not able to easily correlate it with the actual methylation level. This limitation was evident in the original publication of the developers of the MeDIP technique (Weber et al. 2005). In fact, despite the successful validation of their results, the antibody enrichment data were still not easily associated with the absolute and relative methylation measures provided by bisulfite genomic DNA sequencing (Weber et al. 2005). We have shown that the reason for this difficulty is directly related to the nonlinear relationship between antibody enrichment data and DNA methylation level. According to the original publication (Weber et al. 2005) this relationship is expected to be linear. However, as illustrated in Figure 1A, it is successfully modeled as a logistic function of the log of the number of mCpG.
Based on this model, our methodology provides estimates of both absolute and relative methylation levels. We indicate how these two estimates can be useful in the interpretation of the data and in the correlation between promoter methylation and gene expression patterns. Indeed, we recommend that both the absolute and relative methylation estimates be considered for in-depth analysis (as one would do after bisulfite DNA sequencing). In particular, we show that the RMS is effective in comparing genomic regions with different CpG density and in describing the association of the promoter methylation with transcriptional repression. Furthermore, the analysis in the context of cancer biology confirmed the expected DNA hyper-methylation of melanoma promoter regions with respect to normal cells. All the reported findings were more clearly captured by the model derived methylation estimates rather than with the MeDIP enrichment.
There is currently increasing interest in using next-generation sequencing-based approaches for epigenomic profiling. In particular, MeDIP may be coupled with these sequencing methods. New experiments will need to be performed to investigate whether the relationship between antibody enrichment and methylation level that we described here remains valid. If so, we expect this method to be helpful in the interpretation of antibody enrichment measurements derived by next-generation sequencing methods.
In conclusion, we have shown that it is possible to determine the true relationship between the antibody enrichment and methylation level. Our methodology facilitates the interpretation of the results by transforming the antibody enrichment data into a comprehensible absolute and/or relative range. Additionally, we have provided experimental evidence that our methodology can be applied to a real-life data set derived using the same protocol and array platform. Finally, we have shown that the methodology is applicable to two microarray platforms with different designs.
Methods
Cells
Normal human melanocytes were cultured from newborn foreskins (NBMEL) in basal medium (OptiMEM supplemented with 5% fetal calf serum and penicillin/streptomycin) enriched with the following ingredients required for proliferation: TPA (20 nM, 12-O-tetradecanoyl phorbol-13-acetate), IBMX (0.1 mM, 3-isobutyl-1-methyl xanthin), cholera toxin (2.5 nM), vanadate (1 μm) and dbcAMP (0.1 mM, N6, 2′-O-dibutyryladenosine 3:5-cyclic monophosphate), termed TICVA (Cheng et al. 2006). Melanoma cells (YUSAC2) were established from metastatic melanoma and were grown in the basal medium. The samples were collected according to Health Insurance Portability and Accountability Act (HIPAA) regulations with Human Investigative Committee protocol. Genomic DNA was extracted using DNeasy Blood & Tissue Kit (QIAGEN) according to the manufacturer’s instructions.
Derivation of fully methylated DNA
A whole-genome amplification was applied for producing an unmethylated copy of genomic DNA of normal human melanocytes (REPLI-g Mini Kit, QIAGEN). The amplified unmethylated DNA was treated with CpG methyltransferase (M.SssI, NEB) to add methyl-groups to all cytosine residues within CpG dinucleotides, in order to obtain fully methylated genomic DNA. This has been verified by bisulfite DNA sequencing for eight genomic loci. We confirmed 0% mCpG in unmethylated genomic DNA and 90%–100% mCpG in fully methylated DNA (see Supplementary Table 1).
Methylated DNA immunoprecipitation
MeDIP was adapted from a previous study (Weber et al. 2005). Genomic DNA was sheared by sonication into 300–1200-bp fragments, and methylated DNA was immunoprecipitated by incubating 10 μg of sonicated genomic DNA for 12 h at 4°C with 20 μg of mouse monoclonal antibody against 5-methylcytidine (Eurogentec). 50 μL of Dynabeads with M-280 sheep antibodies to mouse IgG (Dynal Biotech) were added to the mix and incubated at 4°C for 2 h. Elution was performed two times in 200 μL of TE containing 1.0% and 0.67% SDS, respectively, and methylated DNA was then recovered by standard proteinase K/phenol-chloroform procedure. DNA was also recovered from the unbound fractions. Real-time PCR was used to verify the amount of enrichment for methylated HOXA5 promoter and unmethylated ACTB promoter as well as H19 mono-allelic methylated imprinting control region (H19ICR) (Tremblay et al. 1997) in each DNA fraction. Three biological replicates for the enrichment of each fraction showed high reproducibility employing DNA from NBMEL (see Supplemental Fig. 1) and melanoma cells (data not shown). The remaining DNA from eluted fractions and sonicated input DNA were differentially labeled using fluorescent dyes (Cy3/Cy5) and competitively hybridized to the genomic DNA arrays. Primer sequences for real-time PCR are given in Supplementary Table 3.
Design, probe annotation, and data processing of the array for detection of chromosome-wide DNA methylation
Array design
The chromosome X tiling array is a custom microarray manufactured by NimbleGen based on the Hg17 release of UCSC human genome. It contains ∼380,000 probes with an average length of 60 nt spanning the whole chromosome each 110 bp.
Data processing
Within (Loess based) and between (Quantile based) normalization methods available in the Limma Bioconductor/R library (Ihaka and Gentleman 1996; Smyth and Speed 2003; Gentleman et al. 2004; Smyth 2005) as standard methods for two-channel microarrays are applied.
Array probe annotation
The position of the center of each probe on the array has been compared to the Hg17 genomic positions of known RefSeqs downloaded from UCSC human genome annotations. Seven different genomic regions are considered: intergenic, intergenic-upstream, promoter, exon, intron, 5′ UTR, and 3′ UTR. Intergenic regions are defined as more than 4 kb upstream of the TSS or downstream from the end of the transcript for each RefSeq ID. Intergenic-upstream regions are defined as less than 4 kb but more than 1 kb upstream of the TSS. Promoter regions are defined as within 1 kb upstream of the TSS. Multiple annotation of a probe in different regions and/or association with different RefSeq IDs is allowed.
Design, probe annotation, and data processing of the arrays for detection of genome-wide gene expression
NimbleGen genome-wide human expression arrays (2005-04-20_Human_60mer_1in2) were used. A total of ∼400,000 probes for ∼30,000 transcripts and ∼20,000 known genes are represented on this array. NimbleGen provides design and probe annotation.
Within (Loess based) and between (Quantile based) normalization methods available in the Limma Bioconductor/R library as standard methods for two-channel microarrays are applied (Ihaka and Gentleman 1996; Smyth and Speed 2003; Gentleman et al. 2004; Smyth 2005).
MEDME algorithm
The following sections illustrate the details of the Modeling Experimental Data with MeDIP Enrichment algorithm (MEDME). The MEDME R library is also available online at http://espresso.med.yale.edu/medme/. A PDF vignette is part of the package, and illustrates the analysis on a subset of the data presented in this manuscript.
Weighting of MeDIP enrichment
For each probe i, the weighted average of antibody enrichment of probes within a 1 kbp window centered at the center of i is determined (MeDIPw). The weights, which are a linear function of the distance of the probes from the center of i, equal one at the center of i and zero at 500 bp upstream or downstream. The window size was set at 1 kbp after careful consideration of the fact that a weighted count is applied and that the range of the fragment size is ∼300 bp–1200 bp (see next paragraph for further discussion).
Expected methylation level
The expected methylation level of the fully methylated sample is directly related to the number of CpGs in the genome. To determine the total number of CpG associated with each probe it is necessary to choose a window size. At the same time, in order to take into account the effect of the relative position of CpG within the considered window, it can be useful to adopt a weighting scheme.
To determine the window size we evaluated the association of MeDIP enrichment and the number of CpG in windows of sizes ranging from 300 bp to 2000 bp. To determine the effect of the CpG distance from the probe, we determined weighted counts of the CpG for each window implementing different weighting functions (none, linear, exponential, or logarithmic, with weight one at the center of each probe and zero at window size/2-bp upstream or downstream). The results indicate that the MeDIP logR can be modeled as a logistic function of the methylation level (determined as the log2 of the total number of CpG) and that the adoption of a CpG weighted-count (CpGw) determines a slightly decreased scattering especially with window size greater than 800 bp (data not shown). Based on these results a window of size 1 kbp was chosen and a linear weighting count of CpG. These conditions provide both adequate model fit and coherence with the expected size of the fragments subjected to immunoprecipitation (data not shown). In the case of the fully methylated sample, CpGw and mCpGw are considered equivalent. The choice of the optimal window size could be dependent on the MeDIP protocol and microarray platform and design. For this purpose, the available MEDME software allows the setting of this parameter as well as of the weighting function (none, linear, exponential, or logarithmic).
Determination of model parameters
The probe-level weighted MeDIP enrichment (MeDIPw) is associated with the log2(mCpGw) count of mCpG, and a logistic model is fit based on the set of median enrichments estimated within bins spanning the range of methylation levels. Before the determination of median value for each bin, the microarray control probes and probes with log2(mCpGw) less than zero are discarded (∼9% of the array). The remaining probes are grouped according to the log2(mCpGw) in bins, ranging from zero to six, each of size 0.1. The median MeDIPw enrichment is then determined for the probes within each bin. A four-parameter logistic-model is fit on the set of MeDIPw medians using the drc R library (version 1.3), originally derived to provide models for sigmoidal dose response curves:
 |
Generation of estimates of the absolute and relative DNA methylation level
Once the model parameters {a,b,c,d} are estimated, it is possible to estimate the probe-level absolute methylation level AMSi (i.e., the weighted count of mCpG in a 1 kbp window for probe i) based on the weighted MeDIP enrichment, MeDIPwi, via:
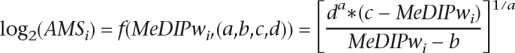 |
AMSi less than 1 and greater than 32 are forced to 1 and 32, respectively based on the model plateaus visible in Figure 1A. These represent background noise and saturation of the microarray derived antibody enrichment, respectively. These values may be dependent on the MeDIP protocol and microarray platform and design. Therefore, the MEDME software allows the setting of these values based on the fitting of the model and on the choice of the window-size parameter.
The relative measure of DNA methylation (RMS) is determined for each probe i by considering the set of probes within a 1 kbp window centered at the midpoint of i. The RMS for probe i is obtained by dividing the average AMS in this set by the corresponding average number of CpGw.
See Supplemental Figure 2 for a summary of the methodology.
Bisulfite genomic DNA sequencing
Bisulfite genomic sequencing was performed as previously described in Jacobsen et al. (2000). The regions sequenced and the primers used are listed in Supplementary Table 3.
Determination of CpG ratio (CpGr)
The probe-level CpGr reported in Figure 4C,D was determined according to Weber et al. (2007). Briefly, the GC content and ratio of observed versus expected CpG dinucleotides was determined for each probe as the (no. of CpGs × 500 bp)/(no. of Cs × no. of Gs).
Acknowledgments
We thank the Cell Culture Core facility of the Yale Skin Disease Research Core Center supported by NIAMS grant 5 P30 AR 041942-12 (Dr. Robert Tigelaar, PI) for providing normal human melanocytes and melanoma cells; Chris Hart for assisting in the design of the X chromosome tiling array; Karen Lostritto, David Elson, and the three reviewers for constructive criticism and helpful suggestions. This work was supported by the Yale Spore in Skin Cancer funded by the National Cancer Institute grant number 1 P50 CA121974 (Halaban, PI). M.K. was supported by the National Library of Medicine grant K22LM009255, and A.M.M. by the National Cancer Institute grant K22CA123146-2.
Footnotes
[Supplemental material is available online at www.genome.org. The microarray data from this study have been submitted to Gene Expression Omnibus (GEO) under accession no. GSE12096. The MEDME R library, installation instructions, and a PDF tutorial are available online at http://espresso.med.yale.edu/medme/.]
Article published online before print. Article and publication date are at http://www.genome.org/cgi/doi/10.1101/gr.080721.108.
References
- Allison D.B., Cui X., Page G.P., Sabripour M., Cui X., Page G.P., Sabripour M., Page G.P., Sabripour M., Sabripour M. Microarray data analysis: From disarray to consolidation and consensus. Nat. Rev. Genet. 2006;7:55–65. doi: 10.1038/nrg1749. [DOI] [PubMed] [Google Scholar]
- Ballestar E., Paz M.F., Valle L., Wei S., Fraga M.F., Espada J., Cigudosa J.C., Huang T.H., Esteller M., Paz M.F., Valle L., Wei S., Fraga M.F., Espada J., Cigudosa J.C., Huang T.H., Esteller M., Valle L., Wei S., Fraga M.F., Espada J., Cigudosa J.C., Huang T.H., Esteller M., Wei S., Fraga M.F., Espada J., Cigudosa J.C., Huang T.H., Esteller M., Fraga M.F., Espada J., Cigudosa J.C., Huang T.H., Esteller M., Espada J., Cigudosa J.C., Huang T.H., Esteller M., Cigudosa J.C., Huang T.H., Esteller M., Huang T.H., Esteller M., Esteller M. Methyl-CpG binding proteins identify novel sites of epigenetic inactivation in human cancer. EMBO J. 2003;22:6335–6345. doi: 10.1093/emboj/cdg604. [DOI] [PMC free article] [PubMed] [Google Scholar]
- Cheng E., Trombetta E.S., Kovacs D., Beech R.D., Ariyan S., Reyes-Mugica M., McNiff J.M., Narayan D., Kluger H.M., Picardo M., Trombetta E.S., Kovacs D., Beech R.D., Ariyan S., Reyes-Mugica M., McNiff J.M., Narayan D., Kluger H.M., Picardo M., Kovacs D., Beech R.D., Ariyan S., Reyes-Mugica M., McNiff J.M., Narayan D., Kluger H.M., Picardo M., Beech R.D., Ariyan S., Reyes-Mugica M., McNiff J.M., Narayan D., Kluger H.M., Picardo M., Ariyan S., Reyes-Mugica M., McNiff J.M., Narayan D., Kluger H.M., Picardo M., Reyes-Mugica M., McNiff J.M., Narayan D., Kluger H.M., Picardo M., McNiff J.M., Narayan D., Kluger H.M., Picardo M., Narayan D., Kluger H.M., Picardo M., Kluger H.M., Picardo M., Picardo M., et al. Rab33A: Characterization, expression, and suppression by epigenetic modification. J. Invest. Dermatol. 2006;126:2257–2271. doi: 10.1038/sj.jid.5700386. [DOI] [PubMed] [Google Scholar]
- Cokus S.J., Feng S., Zhang X., Chen Z., Merriman B., Haudenschild C.D., Pradhan S., Nelson S.F., Pellegrini M., Jacobsen S.E., Feng S., Zhang X., Chen Z., Merriman B., Haudenschild C.D., Pradhan S., Nelson S.F., Pellegrini M., Jacobsen S.E., Zhang X., Chen Z., Merriman B., Haudenschild C.D., Pradhan S., Nelson S.F., Pellegrini M., Jacobsen S.E., Chen Z., Merriman B., Haudenschild C.D., Pradhan S., Nelson S.F., Pellegrini M., Jacobsen S.E., Merriman B., Haudenschild C.D., Pradhan S., Nelson S.F., Pellegrini M., Jacobsen S.E., Haudenschild C.D., Pradhan S., Nelson S.F., Pellegrini M., Jacobsen S.E., Pradhan S., Nelson S.F., Pellegrini M., Jacobsen S.E., Nelson S.F., Pellegrini M., Jacobsen S.E., Pellegrini M., Jacobsen S.E., Jacobsen S.E. Shotgun bisulphite sequencing of the Arabidopsis genome reveals DNA methylation patterning. Nature. 2008;452:215–219. doi: 10.1038/nature06745. [DOI] [PMC free article] [PubMed] [Google Scholar]
- Esteller M. Relevance of DNA methylation in the management of cancer. Lancet Oncol. 2003;4:351–358. doi: 10.1016/s1470-2045(03)01115-x. [DOI] [PubMed] [Google Scholar]
- Esteller M. Cancer epigenomics: DNA methylomes and histone-modification maps. Nat. Rev. Genet. 2007;8:286–298. doi: 10.1038/nrg2005. [DOI] [PubMed] [Google Scholar]
- Gentleman R.C., Carey V.J., Bates D.M., Bolstad B., Dettling M., Dudoit S., Ellis B., Gautier L., Ge Y., Gentry J., Carey V.J., Bates D.M., Bolstad B., Dettling M., Dudoit S., Ellis B., Gautier L., Ge Y., Gentry J., Bates D.M., Bolstad B., Dettling M., Dudoit S., Ellis B., Gautier L., Ge Y., Gentry J., Bolstad B., Dettling M., Dudoit S., Ellis B., Gautier L., Ge Y., Gentry J., Dettling M., Dudoit S., Ellis B., Gautier L., Ge Y., Gentry J., Dudoit S., Ellis B., Gautier L., Ge Y., Gentry J., Ellis B., Gautier L., Ge Y., Gentry J., Gautier L., Ge Y., Gentry J., Ge Y., Gentry J., Gentry J., et al. Bioconductor: Open software development for computational biology and bioinformatics. Genome Biol. 2004;5:R80. doi: 10.1186/gb-2004-5-10-r80. [DOI] [PMC free article] [PubMed] [Google Scholar]
- Goldberg A.D., Allis C.D., Bernstein E., Allis C.D., Bernstein E., Bernstein E. Epigenetics: A landscape takes shape. Cell. 2007;128:635–638. doi: 10.1016/j.cell.2007.02.006. [DOI] [PubMed] [Google Scholar]
- Ihaka R., Gentleman R., Gentleman R. R: A language for data analysis and graphics. J. Comput. Graph. Stat. 1996;3:299–314. [Google Scholar]
- Irizarry R.A., Ladd-Acosta C., Carvalho B., Wu H., Brandenburg S.A., Wen B., Feinberg A.P., Ladd-Acosta C., Carvalho B., Wu H., Brandenburg S.A., Wen B., Feinberg A.P., Carvalho B., Wu H., Brandenburg S.A., Wen B., Feinberg A.P., Wu H., Brandenburg S.A., Wen B., Feinberg A.P., Brandenburg S.A., Wen B., Feinberg A.P., Wen B., Feinberg A.P., Feinberg A.P. Comprehensive high-throughput arrays for relative methylation (CHARM) Genome Res. 2008;18:780–790. doi: 10.1101/gr.7301508. [DOI] [PMC free article] [PubMed] [Google Scholar]
- Jacobsen S.E., Sakai H., Finnegan E.J., Cao X., Meyerowitz E.M., Sakai H., Finnegan E.J., Cao X., Meyerowitz E.M., Finnegan E.J., Cao X., Meyerowitz E.M., Cao X., Meyerowitz E.M., Meyerowitz E.M. Ectopic hypermethylation of flower-specific genes in Arabidopsis. Curr. Biol. 2000;10:179–186. doi: 10.1016/s0960-9822(00)00324-9. [DOI] [PubMed] [Google Scholar]
- Jirtle R.L., Skinner M.K., Skinner M.K. Environmental epigenomics and disease susceptibility. Nat. Rev. Genet. 2007;8:253–262. doi: 10.1038/nrg2045. [DOI] [PMC free article] [PubMed] [Google Scholar]
- Schumacher A., Kapranov P., Kaminsky Z., Flanagan J., Assadzadeh A., Yau P., Virtanen C., Winegarden N., Cheng J., Gingeras T., Kapranov P., Kaminsky Z., Flanagan J., Assadzadeh A., Yau P., Virtanen C., Winegarden N., Cheng J., Gingeras T., Kaminsky Z., Flanagan J., Assadzadeh A., Yau P., Virtanen C., Winegarden N., Cheng J., Gingeras T., Flanagan J., Assadzadeh A., Yau P., Virtanen C., Winegarden N., Cheng J., Gingeras T., Assadzadeh A., Yau P., Virtanen C., Winegarden N., Cheng J., Gingeras T., Yau P., Virtanen C., Winegarden N., Cheng J., Gingeras T., Virtanen C., Winegarden N., Cheng J., Gingeras T., Winegarden N., Cheng J., Gingeras T., Cheng J., Gingeras T., Gingeras T., et al. Microarray-based DNA methylation profiling: Technology and applications. Nucleic Acids Res. 2006;34:528–542. doi: 10.1093/nar/gkj461. [DOI] [PMC free article] [PubMed] [Google Scholar]
- Smyth G.K. Limma: Linear models for microarray data. In: Gentleman R., et al., editors. Bioinformatics and computational biology solutions using R and bioconductor. Springer; New York: 2005. pp. 397–420. [Google Scholar]
- Smyth G.K., Speed T.P., Speed T.P. Normalization of cDNA microarray data. Methods. 2003;31:265–273. doi: 10.1016/s1046-2023(03)00155-5. [DOI] [PubMed] [Google Scholar]
- Tremblay K.D., Duran K.L., Bartolomei M.S., Duran K.L., Bartolomei M.S., Bartolomei M.S. A 5′ 2-kilobase-pair region of the imprinted mouse H19 gene exhibits exclusive paternal methylation throughout development. Mol. Cell. Biol. 1997;17:4322–4329. doi: 10.1128/mcb.17.8.4322. [DOI] [PMC free article] [PubMed] [Google Scholar]
- Weber M., Davies J.J., Wittig D., Oakeley E.J., Haase M., Lam W.L., Schübeler D., Davies J.J., Wittig D., Oakeley E.J., Haase M., Lam W.L., Schübeler D., Wittig D., Oakeley E.J., Haase M., Lam W.L., Schübeler D., Oakeley E.J., Haase M., Lam W.L., Schübeler D., Haase M., Lam W.L., Schübeler D., Lam W.L., Schübeler D., Schübeler D. Chromosome-wide and promoter-specific analyses identify sites of differential DNA methylation in normal and transformed human cells. Nat. Genet. 2005;37:853–862. doi: 10.1038/ng1598. [DOI] [PubMed] [Google Scholar]
- Weber M., Hellmann I., Stadler M.B., Ramos L., Pääbo S., Rebhan M., Schübeler D., Hellmann I., Stadler M.B., Ramos L., Pääbo S., Rebhan M., Schübeler D., Stadler M.B., Ramos L., Pääbo S., Rebhan M., Schübeler D., Ramos L., Pääbo S., Rebhan M., Schübeler D., Pääbo S., Rebhan M., Schübeler D., Rebhan M., Schübeler D., Schübeler D. Distribution, silencing potential and evolutionary impact of promoter DNA methylation in the human genome. Nat. Genet. 2007;39:457–466. doi: 10.1038/ng1990. [DOI] [PubMed] [Google Scholar]