Abstract
Forward genetic mutational studies, adaptive evolution, and phenotypic screening are powerful tools for creating new variant organisms with desirable traits. However, mutations generated in the process cannot be easily identified with traditional genetic tools. We show that new high-throughput, massively parallel sequencing technologies can completely and accurately characterize a mutant genome relative to a previously sequenced parental (reference) strain. We studied a mutant strain of Pichia stipitis, a yeast capable of converting xylose to ethanol. This unusually efficient mutant strain was developed through repeated rounds of chemical mutagenesis, strain selection, transformation, and genetic manipulation over a period of seven years. We resequenced this strain on three different sequencing platforms. Surprisingly, we found fewer than a dozen mutations in open reading frames. All three sequencing technologies were able to identify each single nucleotide mutation given at least 10–15-fold nominal sequence coverage. Our results show that detecting mutations in evolved and engineered organisms is rapid and cost-effective at the whole-genome level using new sequencing technologies. Identification of specific mutations in strains with altered phenotypes will add insight into specific gene functions and guide further metabolic engineering efforts.
Pichia stipitis (Pignal) is a haploid yeast related to endosymbionts of beetles that degrade rotting wood (Suh et al. 2003). It is an important organism for bioenergy production from lignocellulosic materials because of its high capacity to ferment xylose and cellobiose to ethanol (Parekh et al. 1988). We previously sequenced the reference strain, Pichia stipitis CBS-6054, resulting in a completely characterized genome of eight chromosomes totaling 15.4 Mb of sequence (Jeffries et al. 2007). This strain has been subjected to chemical mutagenesis, phenotypic selection, genetic engineering, and adaptive evolution in order to develop strains improved for ethanol production. Chemical mutagenesis and selection resulted in small improvements in ethanol production attributable in part to carbon catabolite derepression (Supplemental Fig. 1; Methods). Disruption of CYC1 (cyctochrome c, isoform 1) to create strain Shi21 increased the specific ethanol production rate by 50% and the ethanol yield by 10%; however, the nature of additional mutational events leading to this phenotype was uncharacterized.
Traditional methods for identifying mutations are labor- and time-intensive, so we tested the ability of next-generation sequencing technologies to determine the differences in this improved strain’s entire genome relative to the reference strain. We generated high-coverage, whole-genome data sets using single fragment end reads from three next-generation sequencing platforms: 454 Life Sciences (Roche) (∼225-bp reads), Illumina (formerly Solexa sequencing) (32-bp reads), and Applied Biosystems SOLiD (35-bp reads) (Schuster 2008). We assessed these data to determine the effect of sequence coverage (i.e., data set size) on the accuracy of mutation detection, and to compare the efficiency of the three platforms for this application.
Results
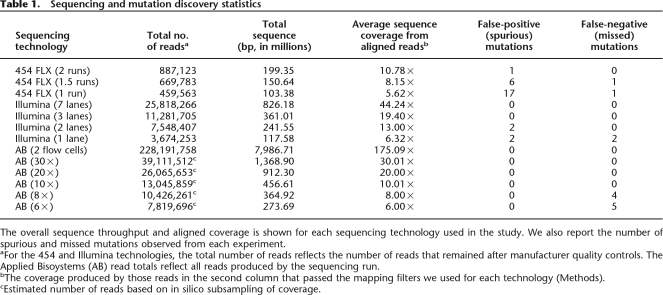
Genomic DNA from P. stipitis (Shi21) was sequenced using the three advanced sequencing platforms according to specifications of the manufacturers (Methods). Low-quality sequence reads from the 454 Life Sciences and Illumina technologies were excluded by manufacturer quality control filters prior to analysis. Since the Applied Biosystems SOLiD sequencing technology does not exclude low-quality reads prior to data analysis, we instead discarded all SOLiD reads that had too many mismatches when they were mapped (Methods) to the Pichia reference genome. We processed the sequence reads from each technology with the manufacturer-supplied base-calling software. We additionally recalled the 454 pyrosequences with the Pyrobayes (Quinlan et al. 2008) program because it produces a lower number of substitution errors and more accurate base quality values than the native base-calling program (Methods). We first identified and masked (i.e., excluded from the genome sequence) all repetitive elements within the P. stipitis genome (Jeffries et al. 2007) that would interfere with unique read alignments, including short genomic repeats as well as nuclear mitochondrial DNAs (NUMTs), which are sequences of mitochondrial origin that were inserted into the nuclear genome (Methods; Supplemental Table 1) (Richly and Leister 2004). Due to the nature of the unpaired short reads produced by these methods, this repeat masking prevented shorter SOLiD and Illumina reads from mapping to 6.8% of the genome and prevented the medium-length 454 FLX reads from mapping to 5.3% of the genome (Supplemental Methods). The total number of aligned reads passing alignment quality filters and the corresponding aligned read coverage are shown in Table 1. Alignment of reads from each technology to the repeat-masked reference sequence resulted in 11–175× coverage of the genome depending on the type of platform and number of runs (Table 1; Supplemental Table 2).
Table 1.
Sequencing and mutation discovery statistics
The overall sequence throughput and aligned coverage is shown for each sequencing technology used in the study. We also report the number of spurious and missed mutations observed from each experiment.
aFor the 454 and Illumina technologies, the total number of reads reflects the number of reads that remained after manufacturer quality controls. The Applied Bisoystems (AB) read totals reflect all reads produced by the sequencing run.
bThe coverage produced by those reads in the second column that passed the mapping filters we used for each technology (Methods).
cEstimated number of reads based on in silico subsampling of coverage.
When mapping the Illumina, 454, and Applied Biosystems reads to the masked reference sequence, we allowed one, two, and three mismatches, respectively (Methods). The Illumina and 454 reads were mapped to the reference sequence with the MOSAIK program (Methods). At the time of this analysis, MOSAIK was unable to align reads from the Applied Biosystems SOLiD technology because of the dinucleotide encoding (also termed “color-space” alignments) that this technology uses (Valouev et al. 2008). Therefore, we mapped the Applied Biosystems SOLiD reads to the Pichia genome with the Applied Biosystems SOLiD Alignment Tool. Despite the algorithmic differences owing to color-space alignments, MOSAIK and the SOLiD Alignment Tool use a similar hash-based method to find potential genomic alignment locations for each sequence read.
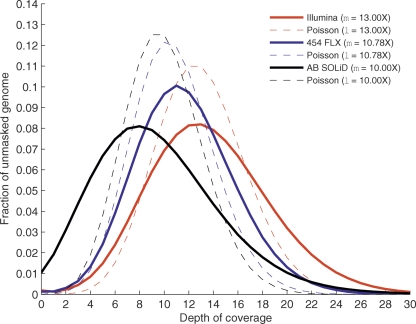
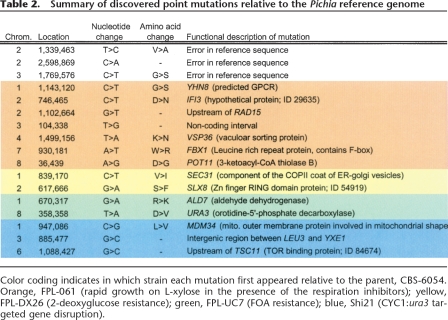
The distribution of sequence coverage across the Pichia genome was similar for each of the sequencing technologies (Fig. 1). The observed coverage distributions are substantially dispersed as compared to the expected Poisson distributions (Fig. 1, dotted lines), indicating that there are regions of the Pichia genome that are more facile to sequence than others. The causes and dynamics of these biases are beyond the scope of this study but are an important consideration for genome resequencing studies. Multiple read alignments from the 454 and Illumina platforms were screened for mutations using GIGABAYES, a new version of the POLYBAYES (Marth et al. 1999) SNP discovery program (Methods). Color-space alignments of the SOLiD data were similarly screened using software supplied by Applied Biosystems. The 17 candidate mutations discovered among the three sequencing technologies were resequenced in CBS-6054 and in each of the four derived strains with a capillary sequencing machine and were all confirmed (Table 2). Three of the changes were found to be errors in the reference sequence, as the alternate base is present in the validation traces not only from all sequenced mutants but also from the parent strain. This implies an error rate of 3 nt in the 15-Mb Pichia reference genome, far exceeding the established standards for genome finishing (1 error/10 kb). Given that the mutations were discovered in very deep data sets and independently confirmed by four different sequencing methods, it is unlikely that we missed any additional mutations in the unmasked fraction (∼95%) of the Shi21 mutant genome. We therefore believe that the remaining 14 mutations comprise the complete set of single nucleotide variants between the mutant and the parent (i.e., reference) Pichia strains.
Figure 1.
Distribution of genome sequence coverage. The distribution of sequence coverage across the unmasked portion of the genome is shown for each technology. Here we represent comparable mean coverage levels for Illumina (red line, 13.00× mean genome coverage), 454 FLX (blue line, 10.78× mean genome coverage), and Applied Biosystems SOLiD (black line, 10.00× mean genome coverage) technologies. For each, we compare the observed coverage distribution to the expected Poisson coverage distribution (dotted lines of the same color for each technology).
Table 2.
Summary of discovered point mutations relative to the Pichia reference genome
Color coding indicates in which strain each mutation first appeared relative to the parent, CBS-6054. Orange, FPL-061 (rapid growth on L-xylose in the presence of the respiration inhibitors); yellow, FPL-DX26 (2-deoxyglucose resistance); green, FPL-UC7 (FOA resistance); blue, Shi21 (CYC1:ura3 targeted gene disruption).
Since the Pichia genome is haploid during vegetative growth, all mutations are expected to be homozygous. An apparent heterozygous change at position 358,358 on chromosome 8 is a result of the intentional gene disruption of CYC1 with a URA3 selection cassette, which resulted in a URA3 duplication. This apparent variation represents a paralogous difference between the two copies of a duplicated gene and thus cannot be considered a true point mutation. We screened for small (1–2 bp) INDEL polymorphisms with GIGABAYES, but none were found, which is not surprising considering that the alkylating agents (Methods) used in mutagenesis principally induce base substitutions. However, because we strictly limited the number of mismatches allowed during read mapping (Methods), it is theoretically possible that longer (>2 bp) INDEL mutations were missed. Additionally, we are currently investigating the use of paired-end sequence data to identify and resolve structural variations as well as larger insertions and deletions.
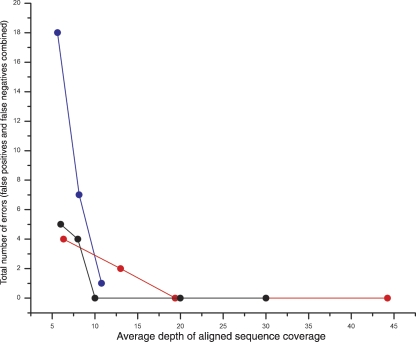
A primary focus of this study was to evaluate the utility of next-generation sequencing technologies for mutational profiling. We therefore compared the capabilities of the three platforms for the identification of the 14 confirmed point mutations in the Pichia mutant. Each of the three sequencing technologies correctly identified all 14 variations with essentially no false positives when all available reads generated on the platform were used (Table 1; Fig. 2). The complete Illumina and Applied Biosystems alignments afforded perfect accuracy: All 14 mutations were found and no false-positive predictions were made. A single false-positive prediction was found in the complete 454 FLX data (which produced lower overall coverage than the other platforms) and was most likely the result of a PCR error during sequence library construction (data not shown). The accuracy we observed is encouraging given that low false discovery (i.e., that is, the fraction of erroneously identified mutations) and false negative (i.e., the fraction of true mutations that were missed) rates are critical considerations for the application of these technologies to rapid forward genetic mutational profiling. These results show that all three technologies are suitable for highly accurate mutation screening (Supplemental Fig. 2).
Figure 2.
The effect of sequence coverage on mutation discovery accuracy. The total number of mutation discovery errors is shown for the three sequencing technologies at various levels of aligned sequence coverage. (Blue circles) 454 FLX; (red circles) Illumina; (black circles) Applied Biosystems SOLiD.
An important consideration for the cost of such experiments is the depth of sequence coverage required to achieve a desired sensitivity and specificity. To determine how the error rate changes as fewer reads are used, we selected subsets of reads of varying size (corresponding to likely use cases for each platform) from each of the three full data sets and subjected the resulting lower-coverage assemblies to our mutation discovery analysis. As shown in Table 1, a combined missed mutation (false negative [FN]) and erroneously called mutation (false positive [FP]) error rate of 50% is achieved with 1.5 454 FLX machine runs (8.15-fold aligned read coverage; six FP and one FN errors), a single lane of Illumina reads (6.32-fold aligned read coverage; two FP and two FN errors), and sixfold coverage of Applied Biosystems SOLiD reads (zero FP and five FN errors). The increased number of false positives observed with the lower 454 FLX coverage is the result of local homopolymer misalignments that arise when a nucleotide overcall (that is, calling too many nucleotides) is followed by a nucleotide undercall (that is, calling too few bases), or vice versa. Deeper coverage mitigates such alignment artifacts (Quinlan et al. 2008). The fact that the Applied Biosystems SOLiD technology produced zero false positives is a result of the “di-base encoding” which facilitates the segregation of sequencing error from true mutations (Valouev et al. 2008). It is important to note that we may have missed additional mutations in the Shi21 strain because we masked between 5.3% and 6.8% of the genome. Given the constraints of plate configurations and run conditions on the different platforms, we find that a minimum of 10–15-fold genome coverage is required for the desired error rate.
Discussion
All three next-generation sequencing platforms correctly identified nucleotide variations between the reference and mutant strains given sufficient coverage. The fraction of mutations in open reading frames (78%) was slightly higher than the average gene density (56%) (Jeffries et al. 2007). In the absence of selection, about two-thirds of the base changes should have resulted in silent mutations at the amino acid level, due to redundancy in the genetic code. Surprisingly, all mutations retained in open reading frames resulted in amino acid changes, indicating high selective pressure and little or no neutral drift (Table 2). Further characterization of the identified mutational events through physiological and genetic studies will be necessary to determine how they affect cell phenotype.
Overall, our results demonstrate that the new sequencing technologies tested are well suited for mutational analysis of novel yeast strains derived from multistep mutagenesis procedures. For most applications, 10–15-fold redundant genome coverage will allow for accurate and cost-effective mutational profiling. Deeper coverage is likely necessary for similar experiments in diploid organisms (e.g., ENU mutagenesis in mouse), as the discovery of heterozygous loci requires that both alleles be sampled from high-quality reads. The approach is expected to be equally suitable for the analysis of bacterial, fungal, and other organisms derived by directed evolution and natural variation, especially as sequencing costs and throughput continue to improve for all of these technologies. Thus, this approach could help accelerate the development of novel organisms for bioenergy and biotechnology applications as well as facilitate traditional forward and reverse genetic screens.
Methods
Derivation of the mutagenized Shi21 strain
The Shi21 derivation of the Shi21 strain of P. stipitis is thoroughly described by Shi et al. (1999).
Sequencing
Chromosomal DNA from P. stipitis Shi21 was prepared by standard methods (Burke et al. 2000). For 454 sequencing, a library was prepared and sequenced using manufacturer-supplied protocols and reagents, as follows. Five micrograms of DNA was sheared to an average size of 480 bp. Adaptors were ligated, and the correct products were selected using 454 library immobilization beads. The single-stranded DNA library was quantified using the Invitrogen Ribogreen assay, and 32 emulsion PCR reactions were prepared with a ratio of two molecules per DNA capture bead. After amplification, the emulsions were broken and enriched, resulting in a total of 3.92 million beads containing amplified library fragments. The beads were sequenced in two full 454 FLX sequencing runs, each loaded with 1.8 million beads, yielding a total of ∼199 Mb of sequence data.
For Illumina sequencing, 3 μg of genomic DNA was fragmented below 800 bp using a nebulizer. Fragments were end-repaired with T4 DNA polymerase. A single dA was added to the ends using Klenow fragment and dATP. Fragments were then ligated with adaptors provided by the manufacturer. Adaptor-ligated fragments were separated from unligated adaptors by running and agarose gel and cutting a band corresponding to ∼150–300 bp and purified using a spin column. The fragment library containing adaptors was subjected to 18 rounds of PCR using primers supplied by Illumina. This amplified library was then loaded onto the cluster generation station for single molecule bridge amplification on slides containing attached primers. The slide with amplified clusters was then subjected to step-wise sequencing using four-color labeled nucleotides on the Illumina 1G sequencing system for 32 cycles. A total of 25,818,266 reads were obtained after quality filtering, yielding ∼826 Mb of sequence data.
For SOLiD sequencing, five micrograms of DNA was sheared and size-selected to an average size of 100 bp. P1 and P2 adaptors were ligated and amplified for 15 cycles; 0.2 pg/μL of double-stranded library was added to the emulsion with 950 million beads according to manufacturers’ instructions. Twenty-nine percent of the beads were P2 positive (contained amplified library fragments) before enrichment and 91% of the beads were P2 positive after enrichment, yielding 277 million beads deposited on two slides; 228 million of these beads fell within the imaged area and were detected in sequencing, yielding 2.7 Gb of aligned 35-mer sequence.
For confirmation sequencing, PCR products were generated from genomic DNA of each strain using M13-tailed primer pairs, the products were sequenced on ABI3730xl instruments, variants were identified using PolyPhred, and confirmed using consed (Stephens et al. 2006). Complete data sets are available at the NCBI Short Read Archive under accession no. SRA 001158 (ftp://ftp.ncbi.nih.gov/pub/TraceDB/ShortRead).
Illumina and 454 sequence alignment
We used our general reference sequence-guided alignment and assembly tool, MOSAIK, to process the Illumina and 454 data sets. MOSAIK (Michael Stromberg, Boston University) uses a hashing scheme to seed full Smith-Waterman gapped alignments against the concatenated P. stipitis genome. The resulting pairwise alignments are then consolidated into a multiple sequence alignment (assembly) and saved as an ACE assembly file. These assemblies can be viewed by programs such as consed (Gordon et al. 1998). To correct for 454 indel alignment errors, the Smith-Waterman scoring algorithm has been augmented to use an alternate gap open penalty when a homopolymer region is detected. For both the Illumina and the 454 reads, we required that at least 95% of each read align to the reference sequence. In order to ensure that we only aligned high-quality reads from each technology, we also required that the reads from each technology had few sequence differences (i.e., mismatches, insertions, or deletions) relative to the reference genome sequence. We allowed at most one sequence difference in the Illumina reads and two sequence differences in the longer 454 reads.
SOLiD sequence alignment
The Applied Biosystems SOLiD alignment tool translates the reference sequence to di-base encoding (“color-space”) and aligns the reads in color space. The program guarantees finding all alignments between a read and the reference sequence with up to M mismatches (a user-specified parameter). Applied Biosystems SOLiD reads were mapped to the Pichia genome allowing up to three mismatches for each read. The alignment tool uses multiple spaced seeds (discontinuous word patterns) to achieve a rapid running time.
Acknowledgments
The Applied Biosystems SOLiD alignment tool translates the reference sequence to di-base encoding (“color-space”) and aligns the reads in color space. The program guarantees finding all alignments between a read and the reference sequence with up to M mismatches (a user-specified parameter). Applied Biosystems SOLiD reads were mapped to the Pichia genome allowing up to three mismatches for each read. The alignment tool uses multiple spaced seeds (discontinuous word patterns) to achieve a rapid running time.
Footnotes
[Supplemental material is available online at www.genome.org. Complete data sets are available at the NCBI Short Read Archive under accession no. SRA 001158 (ftp://ftp.ncbi.nih.gov/pub/TraceDB/ShortRead).]
Article published online before print. Article and publication date are at http://www.genome.org/cgi/doi/10.1101/gr.077776.108.
References
- Burke D., Dawson D., Stearns T., Dawson D., Stearns T., Stearns T., et al. Cold Spring Hargor Laboratory course manual. Cold Spring Harbor Laboratory Press; Cold Spring Harbor, NY: 2000. Methods in yeast genetics. [Google Scholar]
- Gordon D., Abajian C., Green P., Abajian C., Green P., Green P. Consed: A graphical tool for sequence finishing. Genome Res. 1998;8:195–202. doi: 10.1101/gr.8.3.195. [DOI] [PubMed] [Google Scholar]
- Jeffries T.W., Grigoriev I.V., Grimwood J., Laplaza J.M., Aerts A., Salamov A., Schmutz J., Lindquist E., Dehal P., Shapiro H., Grigoriev I.V., Grimwood J., Laplaza J.M., Aerts A., Salamov A., Schmutz J., Lindquist E., Dehal P., Shapiro H., Grimwood J., Laplaza J.M., Aerts A., Salamov A., Schmutz J., Lindquist E., Dehal P., Shapiro H., Laplaza J.M., Aerts A., Salamov A., Schmutz J., Lindquist E., Dehal P., Shapiro H., Aerts A., Salamov A., Schmutz J., Lindquist E., Dehal P., Shapiro H., Salamov A., Schmutz J., Lindquist E., Dehal P., Shapiro H., Schmutz J., Lindquist E., Dehal P., Shapiro H., Lindquist E., Dehal P., Shapiro H., Dehal P., Shapiro H., Shapiro H., et al. Genome sequence of the lignocellulose-bioconverting and xylose-fermenting yeast Pichia stipitis. Nat. Biotechnol. 2007;25:319–326. doi: 10.1038/nbt1290. [DOI] [PubMed] [Google Scholar]
- Marth G.T., Korf I., Yandell M.D., Yeh R.T., Gu Z., Zakeri H., Stitziel N.O., Hillier L., Kwok P.Y., Gish W.R., Korf I., Yandell M.D., Yeh R.T., Gu Z., Zakeri H., Stitziel N.O., Hillier L., Kwok P.Y., Gish W.R., Yandell M.D., Yeh R.T., Gu Z., Zakeri H., Stitziel N.O., Hillier L., Kwok P.Y., Gish W.R., Yeh R.T., Gu Z., Zakeri H., Stitziel N.O., Hillier L., Kwok P.Y., Gish W.R., Gu Z., Zakeri H., Stitziel N.O., Hillier L., Kwok P.Y., Gish W.R., Zakeri H., Stitziel N.O., Hillier L., Kwok P.Y., Gish W.R., Stitziel N.O., Hillier L., Kwok P.Y., Gish W.R., Hillier L., Kwok P.Y., Gish W.R., Kwok P.Y., Gish W.R., Gish W.R. A general approach to single-nucleotide polymorphism discovery. Nat. Genet. 1999;23:452–456. doi: 10.1038/70570. [DOI] [PubMed] [Google Scholar]
- Parekh S.R., Parekh R.S., Wayman M., Parekh R.S., Wayman M., Wayman M. Fermentation of xylose and cellobiose by Pichia stipitis and Brettanomyces clausenii. Appl. Biochem. Biotechnol. 1988;18:325–338. [Google Scholar]
- Quinlan A.R., Stewart D.A., Stromberg M.P., Marth G.T., Stewart D.A., Stromberg M.P., Marth G.T., Stromberg M.P., Marth G.T., Marth G.T. Pyrobayes: An improved base caller for SNP discovery in pyrosequences. Nat. Methods. 2008;5:179–181. doi: 10.1038/nmeth.1172. [DOI] [PubMed] [Google Scholar]
- Richly E., Leister D., Leister D. NUMTs in sequenced eukaryotic genomes. Mol. Biol. Evol. 2004;21:1081–1084. doi: 10.1093/molbev/msh110. [DOI] [PubMed] [Google Scholar]
- Schuster S.C. Next-generation sequencing transforms today's biology. Nat. Methods. 2008;5:16–18. doi: 10.1038/nmeth1156. [DOI] [PubMed] [Google Scholar]
- Shi N.Q., Davis B., Sherman F., Cruz J., Jeffries T.W., Davis B., Sherman F., Cruz J., Jeffries T.W., Sherman F., Cruz J., Jeffries T.W., Cruz J., Jeffries T.W., Jeffries T.W. Disruption of the cytochrome c gene in xylose-utilizing yeast Pichia stipitis leads to higher ethanol production. Yeast. 1999;15:1021–1030. doi: 10.1002/(SICI)1097-0061(199908)15:11<1021::AID-YEA429>3.0.CO;2-V. [DOI] [PubMed] [Google Scholar]
- Stephens M., Sloan J.S., Robertson P.D., Scheet P., Nickerson D.A., Sloan J.S., Robertson P.D., Scheet P., Nickerson D.A., Robertson P.D., Scheet P., Nickerson D.A., Scheet P., Nickerson D.A., Nickerson D.A. Automating sequence-based detection and genotyping of SNPs from diploid samples. Nat. Genet. 2006;38:375–381. doi: 10.1038/ng1746. [DOI] [PubMed] [Google Scholar]
- Suh S.O., Marshall C.J., McHugh J.V., Blackwell M., Marshall C.J., McHugh J.V., Blackwell M., McHugh J.V., Blackwell M., Blackwell M. Wood ingestion by passalid beetles in the presence of xylose-fermenting gut yeasts. Mol. Ecol. 2003;12:3137–3145. doi: 10.1046/j.1365-294x.2003.01973.x. [DOI] [PubMed] [Google Scholar]
- Valouev A., Ichikawa J., Tonthat T., Stuart J., Ranade S., Peckham H., Zeng K., Malek J.A., Costa G., McKernan K., Ichikawa J., Tonthat T., Stuart J., Ranade S., Peckham H., Zeng K., Malek J.A., Costa G., McKernan K., Tonthat T., Stuart J., Ranade S., Peckham H., Zeng K., Malek J.A., Costa G., McKernan K., Stuart J., Ranade S., Peckham H., Zeng K., Malek J.A., Costa G., McKernan K., Ranade S., Peckham H., Zeng K., Malek J.A., Costa G., McKernan K., Peckham H., Zeng K., Malek J.A., Costa G., McKernan K., Zeng K., Malek J.A., Costa G., McKernan K., Malek J.A., Costa G., McKernan K., Costa G., McKernan K., McKernan K., et al. A high-resolution, nucleosome position map of C. elegans reveals a lack of universal sequence-dictated positioning. Genome Res. 2008:1051–1063. doi: 10.1101/gr.076463.108. [DOI] [PMC free article] [PubMed] [Google Scholar]


