Abstract
The multicopper oxidase Fet3p couples four 1e− oxidations of substrate to the 4e−reduction of O2 to H2O. Fet3p uses four Cu atoms to accomplish this reaction: the type 1, type 2, and coupled binuclear type 3 sites. The type 2 and type 3 sites together form a trinuclear Cu cluster (TNC) which is the site of O2 reduction. This study focuses on mutants of two residues, E487 and D94, which lie in the second coordination sphere of the TNC and defines the role that each plays in the structural integrity of the TNC, its reactivity with O2, and in the directional movement of protons during reductive cleavage of the O-O bond. The E487D, E487A, and D94E mutants have been studied in the holo and type 1 depleted (T1D) forms. Residue E487, located near the T3 center, is found to be responsible for donation of a proton during the reductive cleavage of the O-O bond in the peroxide intermediate and an inverse kinetic solvent isotope effect, which indicates that this proton is already transferred when the O-O bond is cleaved. Residue D94, near the T2 site, plays a key role in the reaction of the reduced TNC with O2, and drives electron transfer from the T2 Cu to cleave the O-O bond by deprotonating the T2 Cu water ligand. A mechanism is developed where these second sphere residues participate in the proton assisted reductive cleavage of the O-O bond at the TNC.
Introduction
The multicopper oxidase (MCO) family of enzymes couples the oxidation of four equivalents of a one-electron donor to the four electron reduction of dioxygen to water.1 These enzymes can be separated into two types by substrate specificity. The first group catalyzes the outer sphere oxidation of small organic substrates: the plant2 and fungal laccases3, ascorbate oxidase4, CotA5, and phenoxazinone synthase6. The second group oxidizes metal ions at highly specific metal ion binding sites7–9: Fet3p10, ceruloplasmin11, CueO12, and MngX13. All MCOs must have at least one type 1 (T1) or blue Cu site, a type 2 (T2) or normal Cu site, and a type 3 (T3) or coupled binuclear copper site, where two Cu(II) atoms are antiferromagnetically (AF) coupled by a bridging hydroxide ligand (Figure 1).1 Spectroscopic evidence has shown that the T2 and T3 Cu sites are located close to one another (within ~4Ǻ) forming a trinuclear Cu cluster14,15 which has been confirmed by various crystallographic studies.16,17 This is the site of O2 reduction.18
Figure 1. Structure of the TNC.
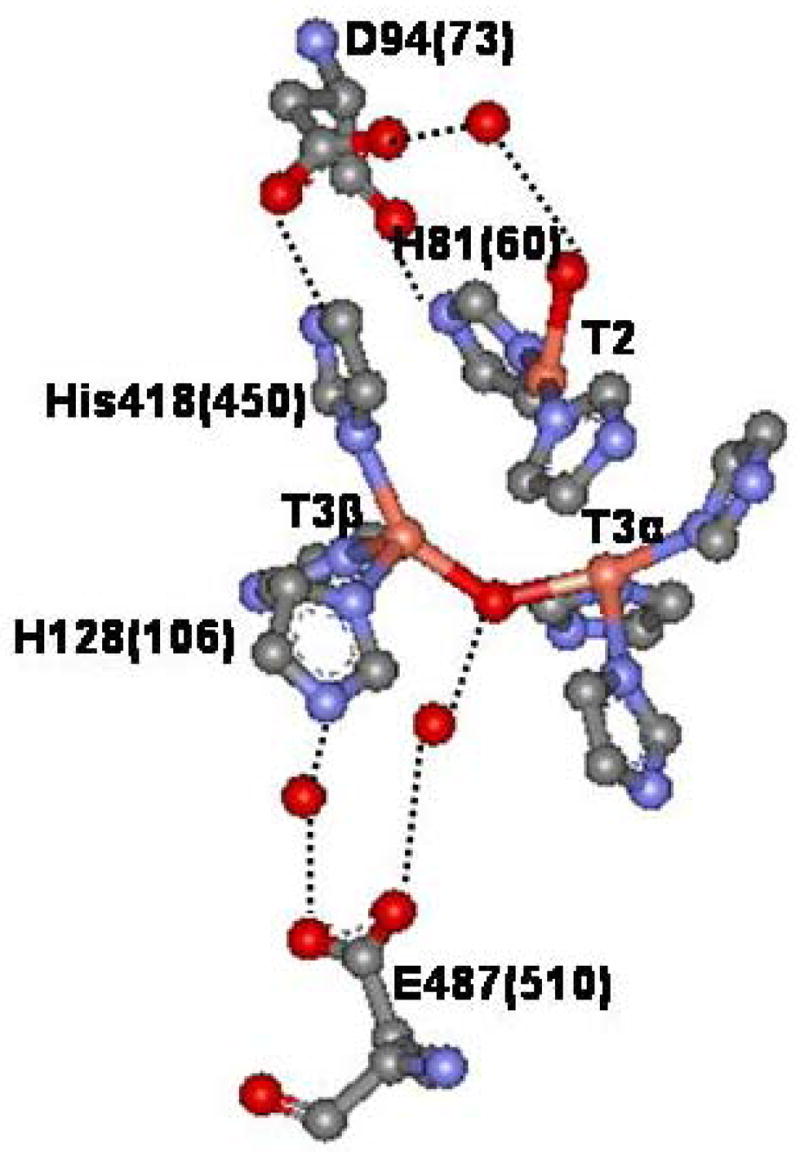
(Structure shown and amino acid numbers in parentheses are from ascorbate oxidase16 in which amino acid positions have been shown to be very similar to those in the structure of Fet3p17.)
Electrons from the reducing substrate are supplied to the MCOs through the T1 Cu site and then transferred over 13 Ǻ via a highly conserved Cys-His electron transfer pathway to the trinuclear cluster (TNC) for oxygen reduction. The fully reduced enzyme reduces dioxygen to water in two, 2 electron steps.19 When the fully reduced holo-form of the enzyme reacts with O2 it forms the native intermediate (NI) which then decays to the resting oxidized enzyme.20,21 A variety of spectroscopic methods have been used to characterize NI; these have shown that the enzyme is in fact, fully oxidized. Therefore, O2 has been fully reduced but remains bound to the TNC as μ3-oxo and μ2-hydroxo bridges.22,23 The decay of NI to the resting oxidized state involves loss of the μ3-oxo bridge24 and is slow relative to the rate of turnover in the MCO reaction; therefore, this decay process cannot be catalytically relevant. Consequently, NI, and not resting, is the fully oxidized form of the enzyme in the catalytic cycle.1
Type 1 Cu depleted forms of the MCOs, where the T1 is replaced by a spectroscopic and redox innocent Hg2+ ion (T1Hg) in the case of laccase25, or by mutating the Cys residue at the T1 site to a Ser residue (T1D) in Fet3p26,27, have also been studied. In these derivatives, when the enzyme is fully reduced it only has three electrons available to reduce dioxygen. This leads to the formation of a peroxide intermediate (PI) in which one Cu at the TNC stays reduced and the other two have been oxidized, transferring two electrons to O2.28 PI forms very rapidly and is kinetically competent to be a precursor to NI.29 Spectroscopic and computational studies have shown that the peroxide in PI is bound internally and bridges the T2 and T3 Cu sites.27,28,30,31 PI then decays with oxidation of the remaining reduced Cu site to the resting oxidized form through an NI species as seen by magnetic circular dichroism spectroscopy. When a redox active T1 is lacking, this decay is very slow, due to the large barrier associated with the one electron reductive cleavage of the peroxide O-O bond, as opposed to the low barrier associated with the thermodynamically favorable two electron reductive O-O bond cleavage in the holo form of the enzyme.32
Examination of the crystal structure of Fet3p shows that there are two second sphere carboxylate residues, D94 and E487 (Figure 1), within ~8 Ǻ of the TNC that are conserved in all archived MCO proteins (n > 900). These residues have been thought to possibly play a role in the structural integrity of the TNC, as well the pH dependence of the spectroscopy of the resting T2 Cu site33 and the decay of PI to NI, which is enhanced by increasing proton concentration and shows an inverse kinetic solvent isotope effect (KSIE) at low pH.33,34. In the case of the pH effect on the resting T2 Cu site, ESEEM spectroscopy showed that this did not result from protonation of the hydroxide ligand on the T2 Cu, as it remains deprotonated even at pH < 5. 33 This supported the possibility that residue D94, located near the T2 Cu, is responsible. In another study, we investigated the role of D94 and found through its mutation that it affects both the decay of PI and the pH effect on the resting enzyme. In addition, in the D94A mutant the reduced TNC does not react with oxygen.34 However, the contribution of residue E487 to these pH effects and O2 reactivity has not been addressed.
This study extends our previous work to D and A mutants of E487 and allows definition of the individual contributions of these residues to reactivity. A variety of spectroscopic methods are employed to evaluate the impact of these mutations on the structural integrity of the TNC, and kinetic studies are presented on the decay of PI to determine the role which protons play in the reductive cleavage of the O-O bond. The pH dependence of PI decay is now uncoupled from the pH effect on the resting T2 Cu. Residue E487 is shown to be directly responsible for the pH dependence and KSIE associated with the decay of PI. Alternately, residue D94 is found to be required for the O2 reaction of the TNC and facilitates O-O bond cleavage through the deprotonation of the water ligand on the T2 Cu of PI in the decay to NI.
Experimental Procedures
Water was purified to a resistivity of 15–17 ΩM cm−1 using a Barnstead Nanopure deionizing system. All chemicals were of reagent grade and used without further purification. Mutant FET3 alleles were constructed in pDY148 by site-directed mutagenesis using the QuikChange kit from Stratagene. Complementary primers were used in PCR amplification of the vector to generate E487D, E487A, and D94E mutants. The following double mutants were then generated in two sequential rounds of mutagenesis: T1D/E487D, T1D/E487A, and T1D/D94E. The FET3 mutant sequences were confirmed by automated fluorescence sequencing on an ABI PRISM 377 instrument. The vectors expressing the mutant proteins were transformed into yeast strain M2* for soluble protein expression. Then WT, T1D, E487D, T1D/E487D, E487A, T1D/E487A, D94E, and T1D/D94E proteins were expressed, isolated, and purified as previously described.35,36 The Bradford dye-binding assay was used to determine protein concentrations37 and copper content was determined spectrophotometrically with 2,2-biquinoline38. Spin quantitation of EPR spectra used a 1.0 mM CuSO4·5H2O, 2 mM HCl and 2M NaClO4 standard solution to determine the concentration of paramagnetic copper.39
All steady-state kinetic studies were carried out based on oxygen consumption using an Oxygraph (Hansatech, www.hansatech-instruments.co.uk). The O2 uptake rates were evaluated using the OXYG32 software provided by Hansatech. All initial velocity, v, versus [S] data were analyzed by direct fitting to the Michaelis-Menten equation using Prism 4. These studies all used ferrous ammonium sulfate as the substrate. Stock solutions were freshly prepared in nitrogen-purged 100 mM MES at pH 6.0 and transfers from these stock solutions were carried out using gastight syringes. All reactions were carried out in air-saturated 100 mM MES at pH 6.0.
UV-Visible absorption spectra were obtained using either an Agilent 8453 or a Hewlett-Packard HP8452A diode array spectrophotometer. EPR spectra were measured with a Bruker EMX spectrometer, ER 041 XG microwave bridge, and ER 4102ST cavity. A liquid nitrogen finger dewar was used to maintain a temperature of 77 K for all X-band samples. Q-band measurements were made at 77 K using an ER 051 QR microwave bridge, ER 5106QT resonator, and an Oxford continuous flow CF935 cryostat. All EPR simulations were done using XSophe (Bruker). UV-visible circular dichroism (CD), at room temperature, and magnetic circular dichroism (MCD), at 5 K, were measured with a Jasco J-810-150S spectrapolarimeter coupled with an S-20 photomultiplier tube and an Oxford SM4000-8T magnet. In the near-IR region, CD and MCD spectra were measured with either a Jasco 200-D or J-730 spectrapolarimeter and a liquid nitrogen cooled InSb detector with either an Oxford SM4000-7T or SM40008T magnet. CD spectra were measured in a 0.5 cm quartz cuvette. MCD spectra were measured using cells which were fitted with two quartz disks and a 3-mm rubber spacer. To eliminate zero-field baseline effects in MCD, the spectra are an average of the +7T and −7T scans, [7 – (−7)]/2T. Gaussian fitting of the absorption, CD, and MCD data was done using PeakFit 4.0 (Jandel).
For spectroscopic characterization, samples were made in either 100 mM sodium phosphate buffer (for pDs between 6 and 8) or 100 mM MES buffer (for pDs between 4.7 and 6). To make an optical quality glass when frozen for MCD, a 50% (v/v) buffer/glycerol-d3 mixture was used yielding final protein concentrations from 0.3–0.8 mM.
For PI decay studies, protein samples were prepared as previously reported.32,34 Final concentrations were 40–50 μM protein and 0.5 mM O2. For these experiments two buffers were used: 100 mM sodium phosphate buffer (pHs and PDs between 6 and 8.5), and 100 mM MES buffer (pHs and pDs between 4.7 and 6). Both buffers were used at pH = 6 and no difference was found in the rate of PI decay.
Results and Analysis
1. Characterization of holo outer sphere Fet3 mutants
WT as well as E487D, E487A, and D94E mutants were isolated in their holo-forms. These were screened by measuring Cu content, absorption spectra, EPR spectra, and their spin quantitation. All load ~4 Cu/protein. WT, E487D, and D94E have ~2 spins/protein (T1 and T2 sites) while the E487A mutant was lower, at 1.2±0.4 spins/protein (table 1). The absorption spectra of WT and the three mutants (figure S1A, Supporting Information) are dominated by two intense charge transfer (CT) transitions, one at 16,450 cm−1 (608 nm) with ε = 5500 M−1cm−1 from the oxidized T1 Cu site and another around 30,300 cm−1 (330 nm) with ε = 5000 M−1cm−1 from the oxidized T3 Cu site.40,41 This has been assigned as a bridging OH− to T3 Cu(II) CT transition. The EPR spectra of the mutants were also similar to that of WT, showing T1 and T2 Cu contributions (figure S1B, Supporting Information). Turnover kinetics studies were also performed and show that all the mutants carry out multiple turnovers in the presence of oxygen and Fe2+ as substrate (table 2).
Table 1.
Cu content and spin quantitation of Fet3p mutants
| Copper Content (Cu/protein) | EPR spin quantitation (spin/protein) | |
|---|---|---|
| WT | 4.2±0.3 | 1.8±0.3 |
| E487D | 3.9±0.4 | 1.6±0.4 |
| E487A | 3.9±0.4 | 1.2±0.4 |
| D94E | 4.3±0.2 | 1.8±0.2 |
| T1D | 3.2±0.2 | 0.8±0.3 |
| T1D/E487D | 2.8±0.3 | 0.7±0.2 |
| T1D/E487A | 2.7±0.3 | 0.7±0.2 |
| T1D/D94E | 3.2±0.3 | 0.7±0.2 |
Table 2.
Turnover rates for holo enzymes
| Fet3p species | KM (μM) | Vmax (min−1) |
|---|---|---|
| WT | 4.5 ± 0.9 | 19.3 ± 0.8 |
| D94E | 2.3 ± 0.5 | 14.9 ± 0.4 |
| E487D | 9.8 ± 2.5 | 22.4. ± 1.8 |
| E487A | 11.4 ± 2.3 | 11.7 ± 0.8 |
2. Characterization of T1D outer sphere mutants
After characterization in the holo-forms, type 1 Cu depleted (T1D) derivatives were prepared for the above enzymes (T1D, T1D/D94E, T1D/E487D, and T1D/E487A) by introducing a C484S mutation.26 All were again screened by measuring Cu content, absorption and EPR spectra, and spin quantitation of their EPR spectra. As shown in table 1, each variant contained the expected ~3 Cu atoms/protein (1 Cu having been eliminated by the T1D mutation) and ~1 spin/protein (T2 only). Their spectroscopy and reactivity are given below.
3. Spectroscopic Characterization of the Resting Trinuclear Cluster
3a. Effects of Outer sphere mutations on the T3 Cu site
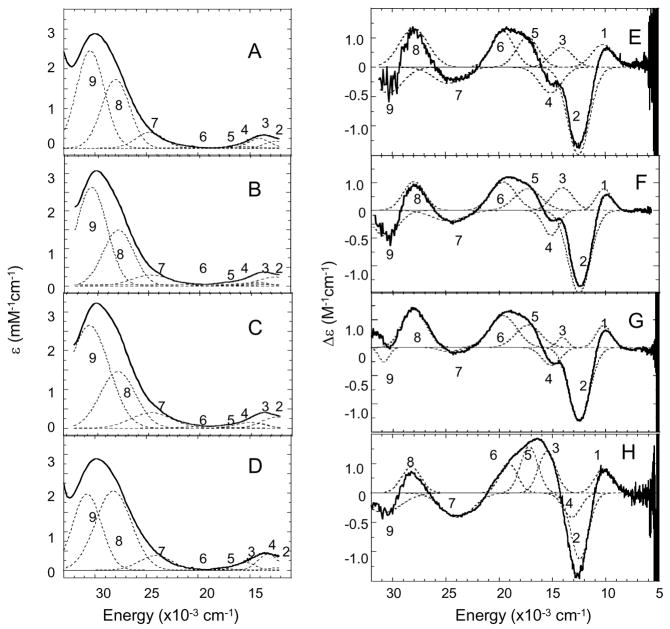
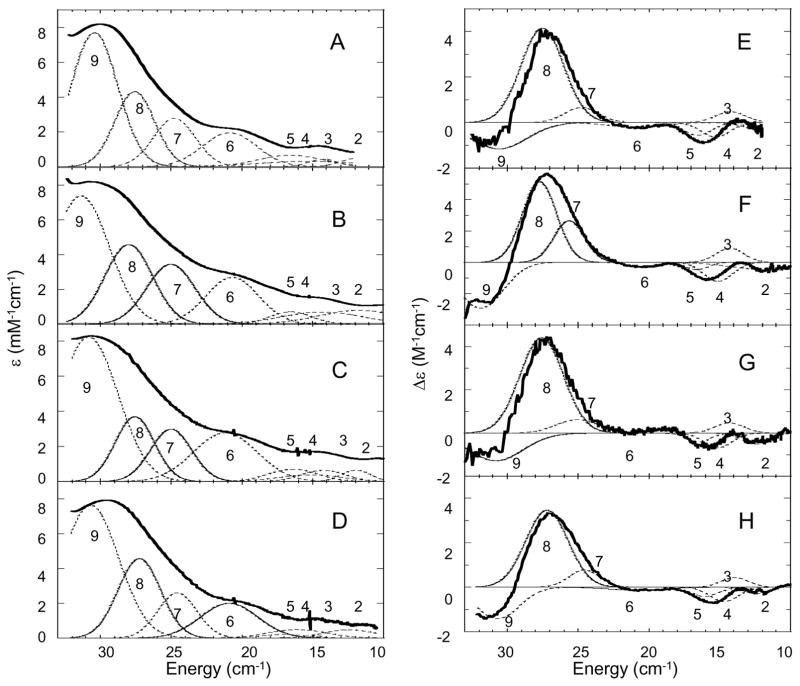
Since the T3 Cu site is AF coupled, it does not contribute to the EPR and MCD spectra but does to the absorption and CD spectra.27,30 In the holo enzyme there is a contribution from the T1 Cu, which is not found in the T1D derivative. The absorption and CD spectra of T1D, T1D/E487D, T1D/E487A, and T1D/D94E are shown in Figure 2. All of the absorption spectra are dominated by the intense (ε≈ 3000 M−1cm−1) μOH− → T3 Cu(II) CT transition at 30,300 cm−1 (330 nm).42 There is an additional weak transition present in the absorption spectrum at ~700 nm associated with the T3 Cu LF transitions, which are more pronounced in the CD spectrum (Figure 2E–H). The simultaneous Gaussian fit of the absorption and CD spectra requires 9 transitions (figure S2, Supporting Information). Based on their Kuhn Anisotropy factors (ratio of CD to absorption intensity), it has been determined that bands 1–6 are ligand field (LF) transitions of the T3 Cu’s and bands 7–9 are CT transitions.27 Both of the E487 mutants show no change in the LF of the T3 Cu’s (compare figures 2F and 2G to 2E). The D94E mutation, however, has led to a change in the T3 LF transitions (compare bands 1–6 in Figure 2H to 2E). Three of the six LF transitions- bands 3, 4, and 6 - have been shifted more than the others in the D94E mutant which indicates that one of the T3 Cu’s has been perturbed by this mutation. This correlates with D94 being H-bonded to a His ligand on only one of the T3 Cu’s (Figure 1).
Figure 2.
Room temperature difference (oxidized – reduced to remove contribution of protein 280 nm band) absorption spectra of T1D (A), T1DE487D (B), T1DE487A (C), and T1DD94E (D). CD spectra of T1D (E), T1DE487D (F), T1DE487A (G), and T1DD94E (H). Individual Gaussian bands are shown with dotted lines.
The intense transition at 330 nm, a μ-hydroxide to T3 Cu(II) CT transition is resolved into two bands, 8 and 9, based on the CD spectra, indicating that the two T3 Cu’s must be inequivalent, each having a distinct OH−→ Cu(II) CT transition.27,40 In both the E487D and E487A mutants, band 8 has not been shifted relative to WT, while band 9 has moved to higher energy (compare figures 2F and 2G to 2E). This change suggests that mutation of residue E487 leads to a perturbation of T3 Cu site. This is consistent with the crystal structure of ascorbate oxidase16, (water molecules have not been resolved in the structure for Fet3p17) where residue E487 is hydrogen bonded through an ordered water molecule to the T3 Cu hydroxide bridge (Figure 1) and this H-bond network would likely be perturbed in both mutants. In addition, from Figure 2 the D94E mutant also has an affect on the energies of the OH− → T3 Cu(II) CT transitions despite its being located on the opposite side of the cluster. The one remaining CT transition which can be resolved at an energy < 33,000 cm−1 is band 7 which is assigned as a His π → Cu(II) CT transition. This band is very similar in T1D and the E487 mutants, however the T1DD94E mutation has caused this band to decrease in energy and increase in negative intensity in the CD spectrum relative to the absorption spectrum (this is reflected in the increase in the C/D ratio of band 7 for T1DD94E in figure S2, Supporting Information).
3b. Effects of outer sphere mutations on the resting T2 Cu site
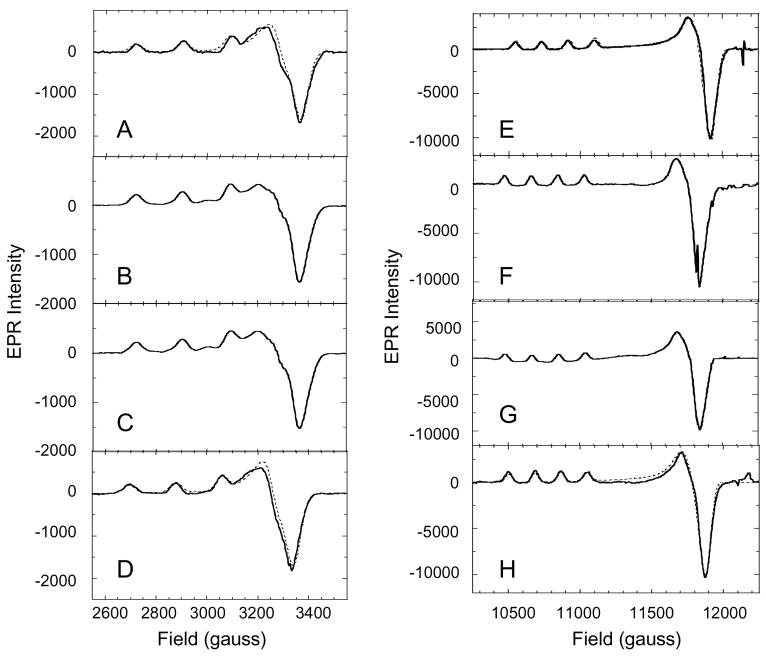
In all of the T1D mutants, the paramagnetic T1 site has been removed and the T3 Cu site is diamagnetic; therefore, the MCD and EPR spectra selectively probe the T2 Cu site. Both X-band (~9.4 GHz) and Q-band (~34 GHz) EPR spectra were measured for T1D, T1D/E487D, T1D/E487A, and T1D/D94E (Figure 3). The X and Q-band spectra were simulated to obtain the g and A values (figure S3, Supporting Information). These parameters are identical in T1D and the two E487 mutants. This shows that these mutations have no affect on the ground state of the T2 site. T1D/D94E, does however, show some differences relative to T1D, specifically lower values for gx and Az (figure S3, Supplementary Material). These results might be expected as residue D94 is located close to the T2 site, with an H-bond through a water molecule to the T2 Cu OH− ligand, while E487 is located on the opposite side of the TNC.
Figure 3.
X-Band EPR spectra of T1D (A), T1DE487D (B), T1DE487A (C), and T1DD94E (D). Q-band EPR spectra of T1D (E), T1DE487D (F), T1DE487A (G), and T1DD94E (H). Simulations are shown in dotted lines. All spectra were obtained at 77 K
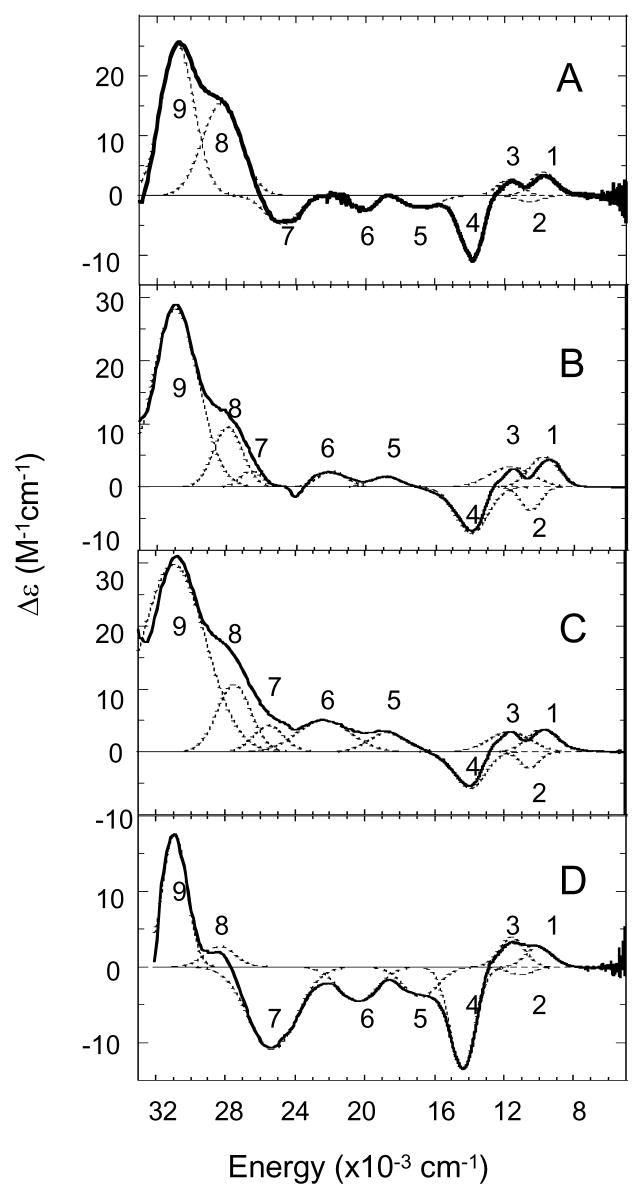
Low-temperature MCD spectra of T1D, T1D/E487D, T1D/E487A, and T1D/D94E are shown in Figure 4. Gaussian fits of the MCD spectra show that 9 transitions between the energies of 5000 and 33000 cm−1 are required (figure S4, Supporting Information). The four lowest energy transitions have been assigned as the T2 Cu(II) LF transitions: dxy, dz2, dxz, and dyz → dx2-y2, in order of increasing energy.33 These transitions are unchanged in the E487 mutants as compared to T1D. This correlates with the EPR data indicating that the structure of the T2 site is unchanged upon mutation at this residue. T1D/D94E in Figure 5D does show a change in the LF of the T2 site, with three of the transitions (dxy, dz2, and dyz → dx2-y2) increasing in energy while the fourth (dxz) shows a decrease in energy (figure S4, Supporting Information). This again reflects the location of D94 in close proximity to, and connected by H-bonds through a water molecule to the OH− ligand on, the T2.
Figure 4.
MCD spectra obtained at 7T and 5 K of T1D (A), T1DE487D (B), T1DE487A (C), and T1DD94E (D). Individual Gaussian bands are shown with dotted lines.
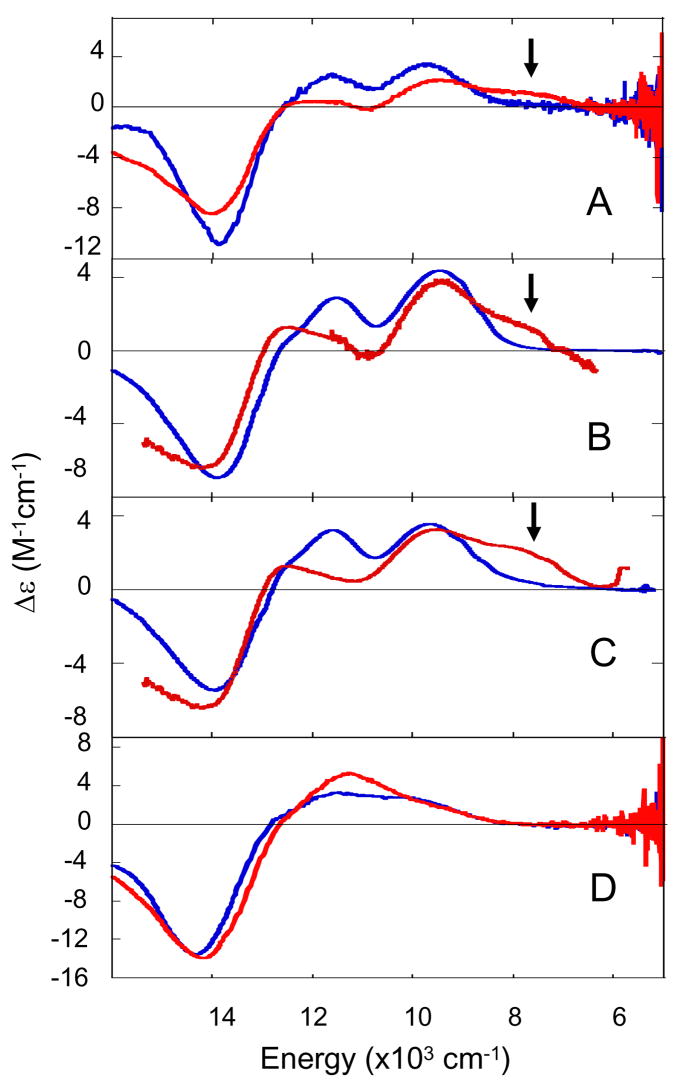
Figure 5.
LF MCD spectra obtained at 7T and 5 K of T1D (A), T1DE487D (B), T1DE487A (C), and T1DD94E (D). In blue is pD = 7.5 and in red pD 5.8.
The remaining 5 transitions in the MCD spectra (Figure 4) are all CT transitions of the T2 Cu, His π → Cu in the case of 5 and 7–9, and OH− → Cu in the case of band 7.33 The E487 mutations, interestingly, have an effect on the CT region of the MCD spectrum. This is most obvious in bands 5–7 which have changed sign from negative to positive and also shifted to higher energy (Figure 5). Bands 8 and 9 have similar intensity in T1D and the T1D/E487 mutants, but band 8 is slightly lower in energy in both mutants and band 9 has shifted to slightly higher energy. Thus, while the overall structure of the T2 site has been relatively unchanged in the two E487 mutants, the interaction of the ligands with the T2 has been affected. The D94E mutant has resulted in larger changes in the CT region of the MCD spectrum. These are primarily seen in the intensities of bands 5–8. This again reflects a change in the interaction of the two His residues and the OH− ligand with the T2 Cu site.
Overall, the E487 variants have led to stable and intact trinuclear clusters and the structure of the cluster has not been greatly affected. However, the hydroxide bridge at the T3 Cu site and the interaction of the T2 Cu with its ligands appear to have been impacted as seen in the CT region of the CD and MCD spectra, respectively. The D94E mutation, while still loading an intact and stable trinuclear cluster, has had more impact upon the structure of the cluster as seen by the changes in the LF transition energies of the T2 site and the T3 Cu atom to which it is H-bonded (Figure 1).
4. pH effect on the resting T2 Cu site
It has been observed in T1D Fet3 that there is a pH effect on the resting T2 Cu site. This is best probed by the appearance of a band in the MCD spectrum at 7700 cm−1 upon going from high to low pH with a pKa < 5.8 (Figure 5A indicated by arrow).33,34 The LF MCD spectra of T1D/E487D, T1D/E487A, and T1D/D94E at both pD 7.5 and 5.8 are also shown in Figure 5. The pH dependence of the MCD spectra of the E487 mutants (figures 5B and 5C) shows that they both behave similarly to T1D (Figure 5A) but with a slightly more intense 7700 cm−1 band. The MCD spectrum of the T1DD94E mutant, on the other hand, does not exhibit the new 7700 cm−1 feature at low pH (Figure 5D). (The LF MCD spectrum of T1DD94A similarly does not exhibit this transition at low pH.34) These data argue for a model where D94 is involved in this pH effect but E487 plays no part. A mechanism can then be developed in which protonation of residue D94 would cause a change in the H-bond network between D94 and the T2 Cu OH− ligand. This would in turn lead to a change in the orientation of the OH− (Figure 6) and shift of the T2 Cu dxy orbital leading to the observed 7700 cm−1 transition in MCD.34
Figure 6.
H-bond network between D94 and resting T2 Cu site
5. Spectroscopy of the Peroxide Intermediate
When the T1D or T1Hg forms of the MCOs are fully reduced and reacted with oxygen they form the peroxide intermediate (PI).32,34 In this intermediate two Cu atoms in the TNC are oxidized and AF coupled and the other Cu reduced. As a result, PI has an S = 0 ground state and is not accessible by EPR and MCD but its does have unique absorption and CD features. PI was formed in T1D Fet3 as well as T1D/E487D, T1D/E487A, and T1D/D94E mutants. It is important to note that the reaction of E487A with O2 is in strong contrast to D94A where the reduced TNC does not react with O2. This suggests an important role of charge at the position of residue 94 which will be addressed further in the Discussion section. The absorption and CD spectra of these PI’s, shown in Figure 7 (specific transition energies are given in figure S6, Supporting Inormation), while similar, do have quantitative differences. The absorption spectra are all dominated by two intense CT transitions at 340 and 480 nm. These can be further resolved into four bands in the CD spectrum, 6–9, found at similar energies in all variants. These four transitions are peroxide π*v and π*σ to Cu(II) CT transitions. The presence of four peroxide to Cu(II) CT transitions indicates that peroxide must bind to the cluster internally, bridging the two oxidized Cu’s.27 The fact that these four bands do not significantly change in energy for any of the mutants indicates that peroxide bridges the TNC is a similar fashion in all mutants.
Figure 7.
Room temperature absorption spectra of PI in T1D (A), T1DE487D (B), T1DE487A (C), and T1DD94E (D). CD spectra of PI in T1D (E), T1DE487D (F), T1DE487A (G), and T1DD94E (H). Individual Gaussian bands are shown with dotted lines.
Transitions 1–5 (Figure 7; the CD spectrum of T1D PI from 5000 – 33,000 cm−1 is shown in figure S5, Supporting Information) have all been assigned as LF transitions of the two oxidized Cu’s.27 As in the resting TNC, the energies of these LF bands have not changed dramatically in the E487 mutants. The D94E mutant, however, does impact the LF transitions of PI. This is also expected since D94E perturbs the LF in the resting oxidized form and seems to indicate that the geometries of the Cu’s have changed slightly in the T1D/D94E PI versus T1D PI.
6. Decay kinetics of PI
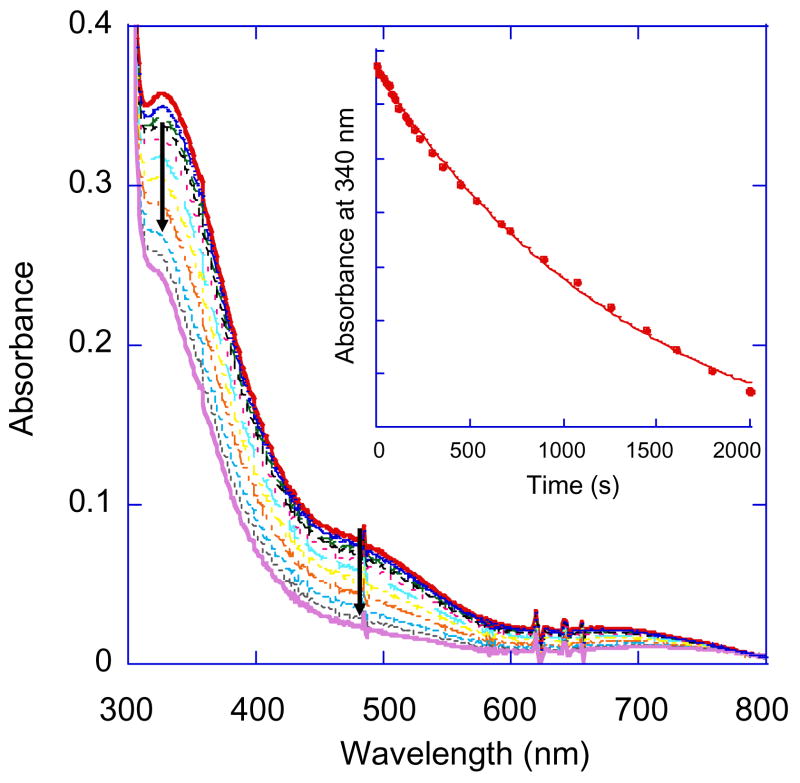
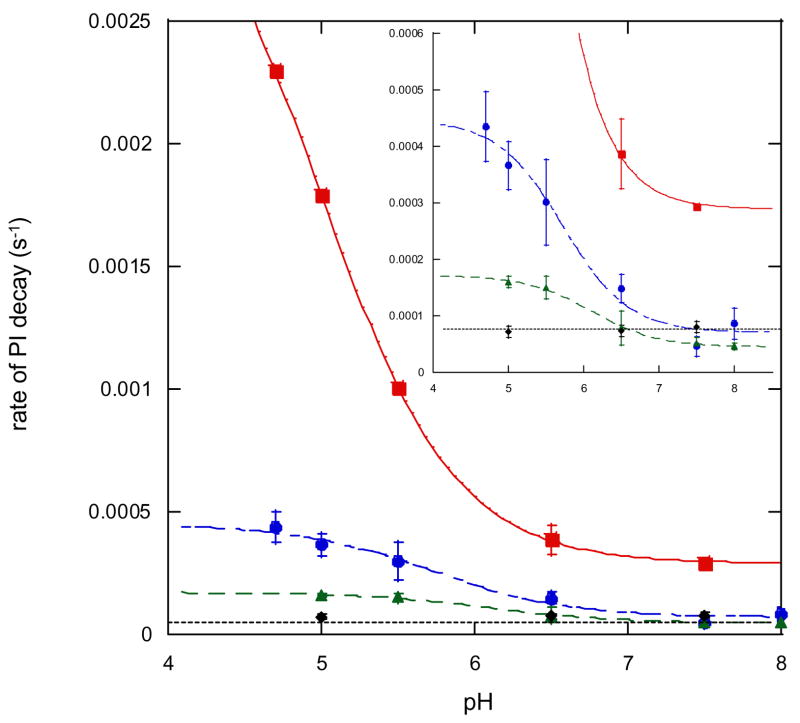
The kinetics of decay of PI was studied in T1D Fet3 as well as the three mutants addressed here.32,34 The decay of PI to the resting oxidized TNC was followed by the disappearance of the intermediate’s peroxide to Cu(II) CT transitions at 340 and 480 nm in the absorption spectrum. This decay follows simple first order kinetics and can be fit to a single exponential expression to extract the rate constant (example shown in Figure 8).32 The pH dependence of this rate of decay has also been measured and can be fit to a protonation equilibrium model32 in which the protonatable species is a nearby carboxylate which is shown in T1D to have a pKa of 5.0 ± 0.2 (Figure 9 in red). Similar experiments have been performed on all three mutants. In both T1D/E487D and T1D/D94E the rates of PI decay were pH dependent with pKa’s of 6.1 ± 0.1 and 5.7 ± 0.2 respectively (Figure 9, T1D/E487D in green and T1D/D94E in blue). Importantly, the rate of PI decay in T1D/E487A has no pH dependence and is slow across the entire range studied (Figure 9 in black).
Figure 8.
Decay of PI followed by absorption in T1DE487A at pH = 5.0. The inset shown traces the absorbance at 340 nm over time and was fit, along with similar trace at 480 nm, to obtain the rate of decay.
Figure 9.
Rate of decay of PI as a function of pH. T1D is shown in ■, T1DE487D in ▲, T1DE4987A in ◆, and T1DD94E in ●.
All three mutants exhibit a decreased rate of decay at both high and low pH relative to T1D. Interestingly, however, T1D/D94E exhibited approximately a 10-fold rate enhancement at low pH, similar to T1D, while T1D/E487D shows only a 3-fold rate enhancement. These data strongly indicate that both residues E487 and D94 play a role in PI decay, as all three mutants have slowed the rate of PI decay. Their specific roles in this process will be addressed in the Discussion.
T1D Fet3 and T1Hg laccase both have been found to have small inverse kinetic solvent isotope effects (0.89) on the rate of PI decay at low pH.32,34 This inverse KSIE indicates that the proton involved in O-O bond cleavage has formed a stronger bond in the transition state than it has in the reactants, in this case PI.43 The KSIE’s on PI decay were measured in all 3 mutants. In the case of T1D/E487D at pH/pD = 5.0, the KSIE is 2.0 while in T1D/D94E it is 2.3. In T1D/E487A, where pH was found to have no impact upon the rate of PI decay, the KSIE is 1.0 (table 3). These results indicate that in both T1D/E487D and T1D/D94E, while a proton transfer is still involved in the rate limiting step of PI decay at low pH it no longer forms a stronger bond at the transition state, in contrast to the reaction in T1D Fet3p and T1Hg laccase. In the T1D/E487A mutant there is no longer a proton transfer involved in the rate determining step of PI decay at low pH.
Table 3.
Summary of the affect of various mutations upon the pH effect in PI decay and the pH effect on the resting T2 Cu
| T1D | T1DE487D | T1DE487A | T1DD94E | |
|---|---|---|---|---|
| Rate of PI decay pH = 5.0 | 1.8 × 10⁻³ s-1 | 1.6 ± 0.1 × 10⁻⁴ s-1 | 7.2 ± 0.5 × 10⁻⁵ s-1 | 3.7 ± 0.4 × 10⁻⁴ s-1 |
| Rate of PI decay pH = 7.5 | 2.9 × 10⁻⁴ s-1 | 5.2 ± 0.9 × 10⁻⁵ s-1 | 8 ± 1 × 10⁻⁵ s-1 | 4 ± 1 × 10⁻⁵ s-1 |
| Rate enhancement | 6.2x | 3.1x | 1x | 8.0x |
| KSIE @ low pH | 0.89 | 2.0 | ~1 | 2.3 |
| pH effect on resting T2 Cu | yes | yes | yes | No |
The KSIE at high pH (measured at pH = 7.5) is 1.0 for T1D and all mutants
Overall, despite the mutations, a peroxide intermediate forms in T1D/E487D, T1D/E487A, and T1D/D94E while it did not form in T1D/D94A. The bound peroxide seems to have been perturbed but is still bound in a similar internally bridged fashion in all mutants. The decay of PI, however, has been strongly impacted in these mutants. The T1D/E487A mutant, most significantly, turns off the rate enhancement at low pH and the KSIE found in T1D (as well as T1Hg Lc). The T1D/D94E and T1D/E487D mutants also impact the decay, changing the KSIE in both from inverse to normal and the degree of rate enhancement at low pH in T1D/E487D.
Discussion
This study has compared the affects of mutations at two residues, E487 and D94, in the second coordination sphere of the TNC on its electronic structure and oxygen reactivity. The E487D, E487A, and D94E mutations yielded intact TNC’s which react with O2. The E487 mutations behaved similarly. The LF’s of both the T3 and T2 Cu sites were unchanged relative to T1D. However, small changes were apparent in the hydroxide bridge at the T3 Cu site that are attributed to the H-bond network that links E487 to this hydroxide bridge (Figure 1). The D94E mutation had much more impact on the structure of the TNC. Fairly large LF changes are apparent in both T2 and T3 centers that can be attributed to perturbations of the H-bond network that connects D94 to the OH− ligand on the T2 and the H-bond to residue H418 which coordinates to one of the T3 Cu’s (Figure 1). In addition, comparison of the pH dependence of the MCD spectra of these mutants has made clear that residue D94 is responsible for the pH effect on the resting T2 Cu site, while residue E487 is not involved.
From the data on all the mutants addressed in this study, roles for both E487 and D94 can be assigned in the O-O bond cleavage process. An additional set of data for developing a mechanism is the 18O kinetic isotope effect on PI decay (1.11 ± 0.05) which has shown that the O-O bond must be almost cleaved at the transition state.32 It is known that the product of PI decay is NI, which has both oxygen atoms from reduced O2 bound to the TNC as a μ3-oxo and a μ2-hydroxo bridge, the latter at the T3 Cu’s.43 This means that a proton must be transferred to oxygen near the T3 Cu atoms at some point in the O-O bond cleavage process. The location of E487 near the T3 site and the affects of its mutation on the decay of PI (Figure 9 and table 3) support its role in the donation of this proton. Using the Westheimer model,44 (S7, Supporting Information) transfer of a proton from this carboxylate (O-H bond frequency of 3000 cm−1)45 to the μ2-hydroxo bridge (OH bond frequency of 3600 cm−1)46 through the H-bond network yields the observed inverse KSIE when the O-H bond is mostly formed at the transition state. This model is supported by the results of the E487A mutation that removes a protonatable species from this position and eliminates the pH dependent rate enhancement and the inverse isotope effect of PI decay (table 3). While the E487D mutation does not eliminate the pH effect and KSIE, it lowers the degree of proton dependent rate enhancement in PI decay and changes the KSIE from inverse to normal (table 3). This KSIE of 2.0 supports a transition state in which the proton is now farther away from its final product position, (S7, Supporting Information) consistent with the shorter carboxylate side chain in Asp relative to the Glu in WT. With respect to the decrease in rate of PI decay in E487D and E487A relative to wild type at high pH, even when E487 is deprotonated it is still capable of H-bonding to a water molecule which would in turn H-bond to the peroxide in PI. This H-bond network would increase the electron affinity of the peroxide and assist in the reductive cleavage of the O-O bond. This H-bond pathway would be disrupted the E487 mutants.
D94 also plays a role in the decay of PI, as the T1D/D94E mutant exhibits a decay of PI which is still pH dependent but slower than T1D across the entire pH range. In assigning a role to D94 it is important to emphasize that D94A and D94N do not react with O2 whereas WT and D94E, as well as E487D and E487A, do react to form PI.34 Also, computational studies have shown that a negative charge at the D94 position is required for the O2 reaction.47 Thus, D94 must be deprotonated, providing a negative charge, for the TNC to react with O2. Consequently, in the decay of PI, this sets up a pathway through which D94 could assist in removing a proton from the H2O ligand on the T2 Cu. This conversion of the water to hydroxide would lower the redox potential of the T2 and increase the driving force for electron transfer to peroxide assisting in O-O bond cleavage. As E487 can only donate a proton at low pH, the KSIE of 1.0 at high pH is a direct probe of the T2 water to D94 proton transfer process and indicates that the proton has been transferred to D94 at the transition state. In the D94E mutant, based upon the elimination of the T2 pH effect in resting, the H-bond network is disrupted and the T2 H2O ligand would no longer be able to transfer its proton. This would slow electron transfer in O-O bond cleavage regardless of pH, as observed in the rate of PI decay in the D94E mutant. As the extent of electron transfer to peroxide is decreased, proton transfer by E487 would also be shifted along the reaction coordinate relative to the transition state. This would provide a possible explanation for the normal isotope effect of 2.3 observed in D94E.
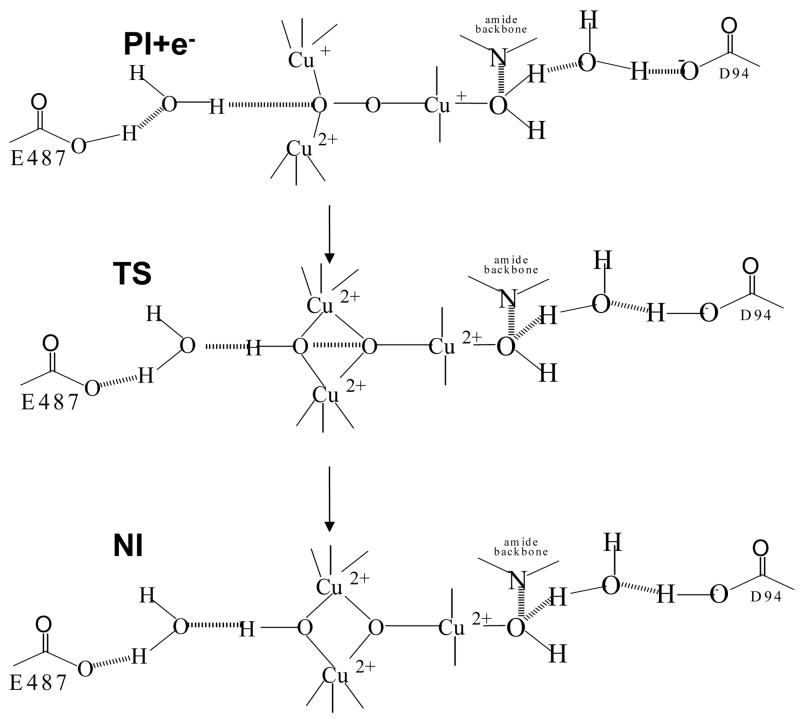
Based on the effects of residues E487 and D94 and the kinetic isotope effects, a molecular mechanism for cleavage of the O-O bond can be developed. At high pH, E487 is deprotonated and does not play a role in proton transfer during O-O cleavage. D94 will accept a proton from the T2 water ligand, and as the transition state occurs late in O-O cleavage it would also be late in this proton transfer leading to the KSIE of 1.0 at high pH. At low pH E487 transfers its proton leading to an almost completely formed O-H bond at the transition state, resulting in the inverse isotope effect of 0.89. Therefore, at low pH the TS between PI and NI has a long O-O bond and a short O-H bond. For this to be the case, the proton transfer from E487 must begin early with respect to O-O bond cleavage. This proton transfer would stabilize the peroxide σ* orbitial, polarizing the peroxide and making it easier to reductively cleave its bond as is reflected by the increase in rate at low pH.48 The net effect of this mechanism is a proton flow from E487 to peroxide and from the H2O bound to the T2 Cu to D94 as seen in Figure 10.49
Figure 10.
Schematic showing cleavage of the O-O bond and the TS between PI+e− (PI plus an electron from the T1 Cu) and NI
This study of mutants at residues E487, near the T3 site, and D94, near the T2 site, has helped define the role of H-bonding in the structure of the TNC in the MCO’s and the role of protons in the reductive cleavage of the O-O bond. The D94E mutation led to relatively large changes in the structure of the TNC and confirmed that D94 is the residue involved in the pH effect on the resting enzyme through a H-bond network to the OH− ligand on the T2 Cu. Furthermore, the residue provides a negative charge that is necessary for the reaction of the TNC with O2 and then assists in the deprotonation of the T2 Cu water ligand during PI decay. The E487 mutants led to smaller structural perturbations compared to D94E but this residue is the protonatable species responsible for acceleration of PI decay at low pH and the inverse KSIE. E487 and D94 act together to create a flow of protons from the T3 side of the TNC to the T2 side to drive the reductive cleavage of the O-O bond. Given the structural conservation in the primary through tertiary levels in MCO’s from fungi to plants, including E487 and D94 equivalents, the mechanism of proton assisted O-O bond cleavage at the TNC is likely conserved as well. Although the domain and tertiary structure of human ceruloplasmin differs from these lower eukaryotic MCO’s11, it retains these two protic groups, E1032 and D995 respectively. Thus, the mechanism outlined here applies to all of the MCO family of enzymes.
Supplementary Material
Absorption and EPR spectra of WT, E487D, E487A, and D94E in holo-form, tables with energies of individual transition energies and assignments for absorption, CD, and MCD of resting oxidized T1D, T1D/E487D, T1D/E487A, and T1D/D94E and absorption and CD of PI in T1D, T1D/E487D, T1D/E487A, and T1D/D94E, g and A values obtained by simulation of EPR spectra for T1D, T1D/E487D, T1D/E487A, and T1D/D94E. The absorption spectrum of PI between 5000 and 33,000 cm−1, and explanation of calculation of isotope effects. This material is available few of charge via the Internet at http://pubs.acs.org.
Acknowledgments
We thank Dr. Jungjoo Yoon for helpful discussion about O-O bond cleavage in the MCO’s and Dr. Abishek Dey for discussions about kinetics and isotope effects. This research was supported by NIH Grants DK31450 (to E.I.S.) and DK53820 (to D.J.K.). A.J.A is a John Stauffer Stanford Graduate Fellow.
References
- 1.Solomon EI, Sundaram UM, Machonkin TE. Chem Rev. 1996;96:2563–2605. doi: 10.1021/cr950046o. [DOI] [PubMed] [Google Scholar]
- 2.Nitta K, Kataoka K, Sakurai T. J Inorg Biochem. 2002;91:125–131. doi: 10.1016/s0162-0134(02)00440-3. [DOI] [PubMed] [Google Scholar]
- 3.Jonsson L, Sjostrom K, Haggstrom I, Nyman PO. Biochim Biophys Acta. 1995;1251:210–215. doi: 10.1016/0167-4838(95)00104-3. [DOI] [PubMed] [Google Scholar]
- 4.Messerschmidt A, Rossi A, Ladenstein R, Huber R, Bolognesi M, Guiseppina G, Marchesini A, Petruzzelli R, Finazzi-Agro A. J Mol Biol. 1989;206:513–529. doi: 10.1016/0022-2836(89)90498-1. [DOI] [PubMed] [Google Scholar]
- 5.Bento I, Martins LO, Lopes GG, Carrondo MA, Lindley PF. Dalton Trans. 2005;21:3507–3513. doi: 10.1039/b504806k. [DOI] [PubMed] [Google Scholar]
- 6.Smith AW, Camara-Artigas A, Wang MT, Allen JP, Francisco WA. Biochemistry. 2006;45:4378–4387. doi: 10.1021/bi0525526. [DOI] [PubMed] [Google Scholar]
- 7.Quintanar L, Gebhard M, Wang TP, Kosman DJ, Solomon EI. J Am Chem Soc. 2004;126:6579–6589. doi: 10.1021/ja049220t. [DOI] [PubMed] [Google Scholar]
- 8.Stoj C, Augustine AJ, Zeigler L, Solomon EI, Kosman DJ. Biochemistry. 2006;45:12741–12749. doi: 10.1021/bi061543+. [DOI] [PubMed] [Google Scholar]
- 9.Stoj CS, Augustine AJ, Solomon EI, Kosman DJ. J Biol Chem. 2007;282:7862–7868. doi: 10.1074/jbc.M609766200. [DOI] [PubMed] [Google Scholar]
- 10.de Silva D, Askwith CC, Eide D, Kaplan J. J Biol Chem. 1995;270:1098–1101. doi: 10.1074/jbc.270.3.1098. [DOI] [PubMed] [Google Scholar]
- 11.Zaitseva I, Zaitsev V, Card G, Moshkov K, Bax B, Ralph A, Lindley P. J Biol Inorg Chem. 1996;1:15–23. [Google Scholar]
- 12.Roberts S, Weichsel A, Grass G, Thakali K, Hazzard J, Tollin G, Rensing C, Montfort W. Proc Natl Acad Sci USA. 2002;99:2766–2771. doi: 10.1073/pnas.052710499. [DOI] [PMC free article] [PubMed] [Google Scholar]
- 13.Francis CA, Casciotti KL, Tebo BM. Arch Microbiol. 2002;178:450–456. doi: 10.1007/s00203-002-0472-9. [DOI] [PubMed] [Google Scholar]
- 14.Allendorf MD, Spira DJ, Solomon EI. Proc Natl Acad Sci USA. 1985;82:3063–3067. doi: 10.1073/pnas.82.10.3063. [DOI] [PMC free article] [PubMed] [Google Scholar]
- 15.Spira-Solomon DJ, Allendorf MD, Solomon EI. J Am Chem Soc. 1986;108:5318–5328. [Google Scholar]
- 16.Messerschmidt A, Ladenstein R, Huber R, Bolognesi M, Avigliano L, Petruzzelli R, Rossi A, Finazzi-Agro A. J Mol Biol. 1992;224:179–205. doi: 10.1016/0022-2836(92)90583-6. [DOI] [PubMed] [Google Scholar]
- 17.Taylor AB, Stoj CS, Ziegler L, Kosman DJ, Hart PJ. Proc Natl Acad Sci USA. 2005;102:15459–15464. doi: 10.1073/pnas.0506227102. [DOI] [PMC free article] [PubMed] [Google Scholar]
- 18.Cole JL, Tan GO, Yang EK, Hodgson KO, Solomon EI. J Am Chem Soc. 1990;112:2243–2249. [Google Scholar]
- 19.Solomon EI, Chen P, Metz M, Lee SK, Palmer AE. Angew Chem, Int Ed. 2001;40:4570–4590. doi: 10.1002/1521-3773(20011217)40:24<4570::aid-anie4570>3.0.co;2-4. [DOI] [PubMed] [Google Scholar]
- 20.Andréasson LE, Reinhammar B. Biochim Biophys Acta. 1976;445:579–597. doi: 10.1016/0005-2744(76)90112-1. [DOI] [PubMed] [Google Scholar]
- 21.Andréasson LE, Brändén R, Reinhammar B. Biochim Biophys Acta. 1976;438:370–379. doi: 10.1016/0005-2744(76)90254-0. [DOI] [PubMed] [Google Scholar]
- 22.Lee SK, George SD, Antholine WE, Hedman B, Hodgson KO, Solomon EI. J Am Chem Soc. 2002;124:6180–6193. doi: 10.1021/ja0114052. [DOI] [PubMed] [Google Scholar]
- 23.Yoon J, Mirica LM, Stack TDP, Solomon EI. J Am Chem Soc. 2005;127:13680–13693. doi: 10.1021/ja0525152. [DOI] [PubMed] [Google Scholar]
- 24.Yoon J, Liboiron BD, Sarangi R, Hodgson KO, Hedman B, Solomon EI. Proc Natl Acad Sci USA. 2007 doi: 10.1073/pnas.0705137104. in press. [DOI] [PMC free article] [PubMed] [Google Scholar]
- 25.Cole JL, Clark PA, Solomon EI. J Am Chem Soc. 1990;112:9534–9548. [Google Scholar]
- 26.Blackburn NJ, Ralle M, Hassett R, Kosman DJ. Biochemistry. 2000;39:2316–2324. doi: 10.1021/bi992334a. [DOI] [PubMed] [Google Scholar]
- 27.Palmer AE, Quintanar L, Severance S, Wang TP, Kosman DJ, Solomon EI. Biochemistry. 2002;41:6438–6448. doi: 10.1021/bi011979j. [DOI] [PubMed] [Google Scholar]
- 28.Shin W, Sundaram UM, Cole JL, Zhang HH, Hedman B, Hodgson KO, Solomon EI. J Am Chem Soc. 1996;118:3202–3215. [Google Scholar]
- 29.Cole JL, Ballou DP, Solomon EI. J Am Chem Soc. 1991;113:8544–8546. [Google Scholar]
- 30.Sundaram UM, Zhang HH, Hedman B, Hodgson KO, Solomon EI. J Am Chem Soc. 1997;119:12525–12540. [Google Scholar]
- 31.Rulíšek L, Solomon EI, Ryde U. Inorg Chem. 2005;44:5612–5628. doi: 10.1021/ic050092z. [DOI] [PubMed] [Google Scholar]
- 32.Palmer AE, Lee SK, Solomon EI. J Am Chem Soc. 2001;123:6591–6599. doi: 10.1021/ja010365z. [DOI] [PubMed] [Google Scholar]
- 33.Quintanar L, Yoon J, Aznar C, Palmer AE, Andersson K, Britt D, Solomon EI. J Am Chem Soc. 2005;127:13832–13845. doi: 10.1021/ja0421405. [DOI] [PubMed] [Google Scholar]
- 34.Quintanar L, Stoj C, Wang TP, Kosman DJ, Solomon EI. Biochemistry. 2005;44:6081–6091. doi: 10.1021/bi047379c. [DOI] [PubMed] [Google Scholar]
- 35.Hassett RF, Yuan DS, Kosman DJ. J Biol Chem. 1998;273:23274–23282. doi: 10.1074/jbc.273.36.23274. [DOI] [PubMed] [Google Scholar]
- 36.Askwith C, Eide D, VanHo A, Bernard PS, Li L, Davis-Kaplan S, Sipe DM, Kaplan J. Cell. 1994;76:403–410. doi: 10.1016/0092-8674(94)90346-8. [DOI] [PubMed] [Google Scholar]
- 37.Bradford MM. Anal Biochem. 1976;72:248–254. doi: 10.1016/0003-2697(76)90527-3. [DOI] [PubMed] [Google Scholar]
- 38.Felsenfeld G. Arch Biochem Biophys. 1960;87:247–251. doi: 10.1016/0003-9861(60)90168-5. [DOI] [PubMed] [Google Scholar]
- 39.Carithers RP, Palmer G. J Biol Chem. 1981;256:7967–7976. [PubMed] [Google Scholar]
- 40.Machonkin TE, Quintanar L, Palmer AE, Hassett R, Severance S, Kosman DJ, Solomon EI. J Am Chem Soc. 2001;123:5507–5517. doi: 10.1021/ja003975s. [DOI] [PubMed] [Google Scholar]
- 41.Kosman DJ, Hassett R, Yuan DS, McCracken J. J Am Chem Soc. 1998;120:4037–4038. [Google Scholar]
- 42.In the spectra shown in figure 3, ε 3000 M−1cm−1 for the 330 nm band because the spectrum of the reduced protein has been subtracted to eliminate the contribution of the protein 280 nm band. In the presence of the 280 nm band the ε 5000 M−1cm−1 for the 330 nm band.
- 43.Klinman JP. Adv Enzymol. 1978;46:415–494. doi: 10.1002/9780470122914.ch7. [DOI] [PubMed] [Google Scholar]
- 44.Westheimer FH. Chem Rev. 1961;61:265–273. [Google Scholar]
- 45.Morrison RT, Boyd RN. Organic Chemistry. 6. Allyn and Bacon; Newton, MA: 1987. pp. 849–851. [Google Scholar]
- 46.Kitajima N, Fujisawa K, Fujimoto C, Morooka Y, Hashimoto S, Kitagawa T, Toriumi K, Tatsumi K, Nakamura A. J Am Chem Soc. 1992;114:1277–1291. [Google Scholar]
- 47.Yoon J, Solomon EI. J Am Chem Soc. Submitted. [Google Scholar]
- 48.Root DE, Mahroof-Tahir M, Karlin KD, Solomon EI. Inorg Chem. 1998;37:4838–4848. doi: 10.1021/ic980606c. [DOI] [PubMed] [Google Scholar]
- 49.The starting structure in this mechanism is PI+e− where in the holo-enzyme an electron from the reduced T1 Cu in PI has been transferred to the TNC and the O-O bond is ready to undergo a two electron reductive cleavage.
Associated Data
This section collects any data citations, data availability statements, or supplementary materials included in this article.
Supplementary Materials
Absorption and EPR spectra of WT, E487D, E487A, and D94E in holo-form, tables with energies of individual transition energies and assignments for absorption, CD, and MCD of resting oxidized T1D, T1D/E487D, T1D/E487A, and T1D/D94E and absorption and CD of PI in T1D, T1D/E487D, T1D/E487A, and T1D/D94E, g and A values obtained by simulation of EPR spectra for T1D, T1D/E487D, T1D/E487A, and T1D/D94E. The absorption spectrum of PI between 5000 and 33,000 cm−1, and explanation of calculation of isotope effects. This material is available few of charge via the Internet at http://pubs.acs.org.


