

Abstract
The essential neural circuitry for delay eyeblink conditioning has been largely identified, whereas much of the neural circuitry for trace conditioning has not been identified. The major difference between delay and trace conditioning is a time gap between the presentation of the conditioned stimulus (CS) and the unconditioned stimulus (US) during trace conditioning. It is this time gap or trace interval which accounts for an additional memory component in trace conditioning. Additional neural structures are also necessary for trace conditioning, including hippocampus and prefrontal cortex. This addition of forebrain structures necessary for trace but not delay conditioning suggests other brain areas become involved when a memory gap is added to the conditioning parameters. A metabolic marker of energy use, radioactively labeled glucose analog, was used to compare differences in glucose analog uptake between delay, trace, and unpaired experimental groups in order to identify new areas of involvement within the cerebellum. Known structures such as the interpositus nucleus and lobule HVI showed increased activation for both delay and trace conditioning compared to unpaired conditioning. However, there was a differential amount of activation between anterior and posterior portions of the interpositus nucleus between delay and trace, respectively. Cerebellar cortical areas including lobules IV and V of anterior lobe, Crus I, Crus II, and paramedian lobule also showed increases in activity for delay conditioning but not for trace conditioning. Delay and trace eyeblink conditioning both resulted in increased metabolic activity within the cerebellum but delay conditioning resulted in more widespread cerebellar cortical activation.
Keywords: Interpositus nucleus, 2-Deoxyglucose, Lobule HVI, Lobule HV, Cerebellar cortex
1. Introduction
Delay and trace eyeblink conditioning are very similar paradigms; wherein a conditioned stimulus (CS; 2 kHz tone) is paired with an unconditioned stimulus (US; unilateral periorbital shock). After several pairings of the tone and shock, the CS comes to elicit a conditioned response (CR), wherein the eyelid closure occurs before the onset of the US. The primary difference between delay and trace conditioning paradigms is the memory requirement. Here, we used metabolic mapping to compare the cerebellar circuitry underlying delay and trace eyeblink conditioning. No time gap exists between the CS and US in delay conditioning, whereas a time gap does exist during trace conditioning between the offset of the CS and the onset of the US. The presence of a trace interval in the conditioning paradigm necessitates the involvement of forebrain areas (Kim, Clark, & Thompson, 1995; Moyer, Deyo, & Disterhoft, 1990; Weible, McEchron, & Disterhoft, 2000; Weiss, Bouwmeester, Power, & Disterhoft, 2000). This memory trace may add another level of difficulty to the behavioral task and require additional processing by other neural structures.
The cerebellum and brainstem nuclei have been viewed as the only structures necessary for successful delay eye-blink conditioning (Christian & Thompson, 2003). Additional studies demonstrate that within the cerebellum the interpositus nucleus (IN) is the key element responsible for acquiring the association between stimuli (Krupa & Thompson, 1997; Steinmetz, Logue, & Steinmetz, 1992). The IN is also critical in trace conditioning (Woodruff-Pak, Lavond, & Thompson, 1985). However, trace conditioning also involves other forebrain structures such as the hippocampus and medial prefrontal cortex (Kim et al., 1995; Moyer et al., 1990; Weible et al., 2000; Weiss et al., 2000). Recently it has been argued that even for delay conditioning, there may be other structures beyond the cerebellum and brainstem that are critical for acquisition such as the medial auditory thalamus (Halverson & Freeman, 2006). Using a metabolic mapping approach may lead to identification of new cerebellar regions involved in delay and/or trace conditioning.
The lateral anterior lobe, lobule HVI, and the anterior interpositus nucleus have been specifically linked to the acquisition and retention of eyeblink conditioning (Thompson, 2005). However, there are multiple blink zones distributed across the C1 and C3 longitudinal zones of the cerebellum (Hesslow, 1994), which raises the possibility that there are other cortical areas and nuclei that play roles in eyeblink conditioning. It is also possible that different cerebellar cortical areas and nuclei contribute to delay and trace conditioning.
A marker of metabolic activity, [C14]2-deoxyglucose (2-DG), was used to compare glucose analog uptake across delay, trace, and unpaired groups of male rats. The 2-DG metabolic mapping method allowed us to examine cerebellar cortex and deep nuclei to ascertain the possible subsets of structures involved in delay and trace conditioning. The primary experimental parameter that differed between the delay and trace groups was whether or not there was a time gap between the offset of the CS and onset of the US. The unpaired group received explicitly unpaired CS and US stimulus presentations. By comparing rats given unpaired presentations of the CS and US with rats given delay or trace conditioning, we investigated the possible neural circuit differences for remembering an association (between the CS and US) across a time gap versus the formation of an association.
2. Methods
2.1. Subjects
Twenty male Long Evans rats weighing 200−250 g were used for this study. All rats were housed in Spence Laboratories at the University of Iowa and kept on a 12-h light/dark cycle. The rats were fed standard rat chow ad libitum. All procedures were approved by the Institutional Animal Care and Use Committee at the University of Iowa. The rats were divided into three conditioning groups: delay, trace, and unpaired.
2.2. Surgery
For surgery, each rat was anesthetized and fitted with differential EMG (electromyogram) electrodes implanted in the left upper eyelid muscle (orbicularis oculi). A ground electrode was attached to a stainless steel skull screw. The EMG electrode leads terminated in gold pins held in a plastic connector, which was secured to the skull with dental acrylic. A bipolar stimulating electrode (for delivering the shock US) was implanted subdermally, immediately caudal to the left eye. The bipolar electrode terminated in a plastic connector that was secured to the skull with dental acrylic. Both sets of connectors for the EMG and bipolar electrode were connected to a lightweight cable that allowed the rats to move freely during conditioning. The rats were allowed to recover for 7−10 days before training began.
2.3. Conditioning apparatus
Rats from each group were trained in one of four sound attenuating chambers (BRS/LVE, Laurel, MD). These small animal sound attenuating chambers surrounded a small-animal operant chamber where the rats were kept during conditioning (BRS/LVE, Laurel, MD). One wall of the operant chamber was fitted with two speakers. The back wall of the sound attenuating chamber was equipped with a small house light and exhaust fan. The electrode leads from the rat's headstage were connected to peripheral equipment and a desktop computer. Computer software controlled the delivery of stimuli and the recording of eyelid EMG activity (JSA Designs, Raleigh, NC). The shock stimulus (1−2 mA, DC constant current) was delivered through a stimulus isolator (Model number 365A, World Precision Instruments, Sarasota FL). EMG activity was recorded differentially, filtered (500−5000 Hz), amplified (2000×) integrated by equipment (JSA Designs, Raleigh, NC) described in other reports (Nicholson, Sweet, & Freeman, 2003).
2.4. Behavioral paradigm
2.4.1. Training groups
Rats were given delay, trace or unpaired conditioning. The conditioned stimulus (CS) was a tone (2 kHz, 250 ms) paired with a unilateral periorbital shock unconditioned stimulus (US, 25 ms). For the delay group (n = 7), the CS terminated with the onset of the US. For the trace group (n = 6), the CS offset was separated by 250 ms from the US onset. The unpaired group (n = 7) received the CS and US in an explicitly unpaired fashion.
2.4.2. Training procedure
For delay and trace conditions, training consisted of 10 blocks of 10 trials for a total of 100 trials per session per day. Each block consisted of nine pairings of the CS and US and one CS alone presentation used as a test trial. CRs for all groups were defined as responses that crossed a threshold of 0.4 volts above baseline during the CS period after 80 ms.
Rats in all groups were trained for 4 days. Before training each day, the rats were habituated to a small containment box, where the tail was restrained. This procedure readied the rats for the injection that occurred on the last day. On the fifth and final day, rats were weighed and then given an i.v. tail injection of (20 μCi/100 g) body weight, glucose analog, 2-deoxyglucose (2-DG) radiolabeled with 14C (American Radiolabeled Chemicals, St. Louis) in 0.3 ml sterile (0.9%) saline (Breier, Crane, Kennedy, & Sokoloff, 1993). Experimental rats were then run in their final training session. The computer program was altered to allow the final session to run continuously for 2 h (rather than the typical 1 h session) so that each rat could be run separately. The rats were only allowed to experience 80 trials, or about 40 min of training compared to their normal 100 daily training trials. This was done to ensure optimal brain harvest time, which occurs 45 min post injection. After 45 min rats were decapitated. The brains were extracted in less than 6 min and frozen in hexane cooled to −37 °F and then stored at −80 °F until sectioned.
2.5. Histology
Before sectioning, brains were removed from the freezer and allowed to equilibrate for 10 min. The brain was cut just anterior to the cerebellum so that the cerebellum could be sliced horizontally. The cerebellum was sectioned at 40μ in a series of 7 with 4 sections saved for 2-DG analyses and one saved for Nissl staining. Tissue mounted for 2-DG was exposed to 14C phosphor screen films along with 14C standards (Amersham, St. Louis) for 36 h. These screens were read and digitized by a phosphor imaging system, Cyclone Storage Phosphor System (Perkin Elmer, Chicago). Individual calibration curves were calculated based on the absolute gray levels of the 14C standards from each film. Subsequent densitometric measures were then automatically converted to units of nCi/g.
2.6. Analyses
Each animal's mean activity values were normalized within subject by readings taken from both cerebellar and forebrain white matter including the optic chiasm, corpus callosum, external capsule, optic tract, and white matter areas of the cerebellum. All areas were defined by using an atlas (Paxinos & Watson, 1998). For each deep cerebellar nucleus structure, region of interest (ROI) readings were taken outlining the complete structure form, from at least three out of four consecutive sections (series), which were then averaged for the whole structure (Barrett, Shumake, Jones, & Gonzalez-Lima, 2003); (Fig. 1). For the cerebellar cortical areas, a sampling technique was used to avoid white matter stalks. For each section in a series of at least three out of four consecutive sections, 5−7 samples were collected in such a way that the samples did not overlap but covered the entire area (Fig. 1). These values were then averaged for each section, by series, and whole structure. Some of the tissue was damaged or of poor quality (e.g., freezing artifact, missing tissue, folds, tears, and air bubbles), this led to five rats being discarded, leaving five subjects in each group.
Fig. 1.

Horizontal atlas drawings (Paxinos & Watson, 1998), illustrate the areas that were sampled from (dotted outline) or taken as ROIs (solid outline). Numerals indicate distance in mm from the interaural line, ventral to dorsal. Abbreviations: AIP, anterior interpositus; CoP, copula of pyramis; CRI, crus I; CRII, crus II; Den, denate; Fast, fastigial; PIP, posterior interpositus; PM, paramedian lobule. Roman numerals: II–IV, and V (med), medial V; V (lat), lateral; V, anterior lobe lobules; VI (med), medial VI; VII–X, vermis lobules; VI (lat), lateral hemisphere VI.
The CR performance of the animals was analyzed with a repeated measures ANOVA, the between factor was group and the within factor was training sessions. All statistical analyses for the 2-DG tissue were done using a two way ANOVA with left versus right hemisphere serving as the within variable and group serving as the between variable. The p-value was set at 0.05 and preplanned post hoc Tukey tests were performed.
3. Results
3.1. Behavioral results
There was a significant main effect for group (F2,12 = 10.28, p < .05). As expected, the unpaired animals did not learn the association as measured by percent of conditioned responses (CRs). By the fourth day of training the performance of the delay and trace animals was significantly better than that of the unpaired animals (p < .05, .05; Fig. 2). There was a significant interaction effect between group and training session (F6,36 = 5.26, p < .05). Post hoc analyses showed that on the third day of training trace animals performed significantly better than unpaired animals (p < .05). By the fourth day both delay and trace animals performed significantly better than unpaired animals (p < .01, .01). The animals were trained on the day of 2-DG injection for a fifth and final day. To accommodate the injection schedule, behavioral training operated continuously and only experimenter observation of the computer screen was available to ascertain continued performance of the CR. All of the animals included in the delay and trace groups continued to perform CRs on the day of 2-DG injection.
Fig. 2.

Behavioral performance during acquisition. The percentage of CRs is plotted for the three experimental groups for the first four training sessions. Both the delay and trace groups performed significantly above chance (p < .05).
3.2. DG results
3.2.1. Deep nuclei of cerebellum
Analysis of a ROI that included the whole interpositus nucleus, showed a significant main effect of group (F2,12 = 8.08, p < .05). Post hoc analyses indicate that both the delay and trace group had more 2-DG uptake compared to the unpaired group (p < .05; .05). There was no interaction or main effect for within group. Analyses of the interpositus nucleus also included subdividing it into anterior and posterior portions. The anterior interpositus (AIP) had a significant main effect of group (F2,12 = 8.52, p < .05) and the post hoc analyses showed the delay group had significantly more uptake than the unpaired group (p < .05; Figs. 3 and 4). For the posterior interpositus (PIP) there was also a significant main group effect (F2,12 = 8.08, p < .05; Fig. 3) and the post hoc analyses found that the trace group had significantly more uptake than the unpaired and delay groups (p < .05; .05; Figs. 3 and 4). Neither the anterior, posterior, nor the interpositus as a whole had any 2-DG uptake differences between the left and right hemispheres. No significant differences were observed for the dentate and fastigial nuclei (see Table 1).
Fig. 3.
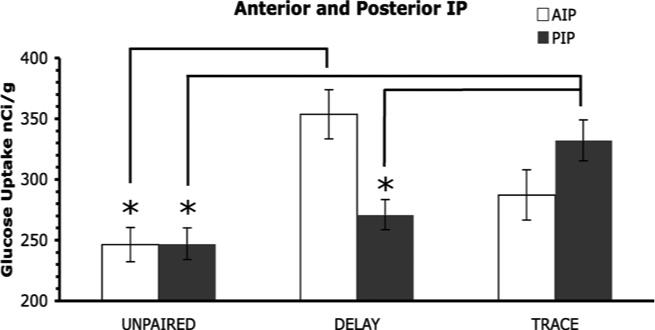
Mean 2-DG uptake in the subdivided interpositus nucleus. In the anterior interpositus (AIP) the delay group had significantly more 2-DG uptake compared to the unpaired group (*p < .05). In the posterior interpositus (PIP) the trace group had significantly more uptake compared to the unpaired and delay groups (*p < .05; .05).
Fig. 4.

2-DG autoradiographs of the interpositus (IP), from three rats, showing relative rates of glucose utilization in pseudocolor (see color bar). The left hemisphere is on the left. These horizontal sections are approximately 3.9 mm above the interaural line (Paxinos & Watson, 1998). Panel (a) is an unpaired animal, panel (b) is a delay animal and panel (c) is a trace animal. Original autoradiographs are shown as an example of differences in the IP 2-DG uptake but individual autoradioagraphs may show variations in optical density of other structures. Scale bar indicates 1 mm. Abbreviations: AIP, anterior interpositus; PIP, posterior interpositus. (For interpretation of the references in color in this figure legend, the reader is referred to the web version of this article.)
Table 1.
This table provides a summary for each area examined within the cerebellum
| Brain region deep nuclei | Left vs. right | Unpaired vs. delay | Group differences unpaired vs. trace | Delay vs. trace |
|---|---|---|---|---|
| Dentate | No | None | None | None |
| Fastigial | No | None | None | None |
| Interpositus (whole)* | No | Unpaired vs. delay (I) | Unpaired vs. trace (I) | None |
| Anterior interpositus* | No | Unpaired vs. delay (I) | None | None |
| Posterior interpositus* | No | None | Unpaired vs. trace (I) | Delay vs. trace (I) |
| Cerebellar cortex | ||||
| Anterior lobe | ||||
| Lobule II | No | None | None | None |
| Lobule III | No | None | None | None |
| Lobule IV* | Yes | Unpaired vs. delay (I) | None | None |
| Lobule V (lateral)* | No | Unpaired vs. delay (I) | None | None |
| Lobule V (medial)* | No | Unpaired vs. delay (I) | None | None |
| Vermis | ||||
| Lobule VI (medial) | No | None | None | None |
| Lobule VII | No | None | None | None |
| Lobule VIII | No | None | None | None |
| Lobule IX | No | None | None | None |
| Lobule X | No | None | None | None |
| Hemispheres | ||||
| Lobule VI (lateral)* | No | Unpaired vs. delay (I) | Unpaired vs. trace (I) | None |
| Crus I | No | Unpaired vs. delay (I) | None | None |
| Crus II* | No | Unpaired vs. delay (I) | None | None |
| Paramedian lobule | No | Unpaired vs. delay (I) | None | None |
| Copula of pyramis* | Delay group only | None | None | None |
An asterisk indicates significant differences (p < .05). An “I” indicates an increase for that group in 2-DG uptake compared to the unpaired or delay group.
3.2.2. Cortical areas of the cerebellum
Lobule HVI was subdivided into medial and lateral portions. There was a main group effect (F2,12 = 6.22, p < .05), for the lateral portion in that both the delay and trace groups had significantly more 2-DG uptake than the unpaired group (p < .05; .05; Fig. 5). The medial portion of HVI had no significant differences.
Fig. 5.
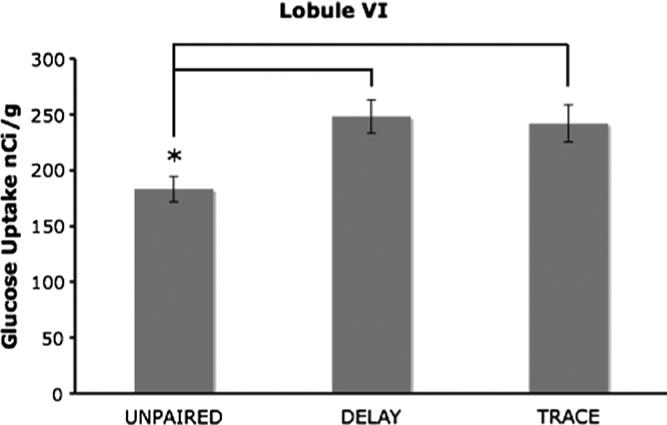
Mean 2-DG uptake in lobule HVI, the delay and trace groups had significantly more 2-DG uptake compared to the unpaired group (*p < .05; .05).
Lobule V was also subdivided into lateral and medial portions. Both the lateral and medial portions of lobule V had main group effects (F2,12 = 4.62, p < .05; F2,12 = 3.99, p < .05), and post hoc analyses showed the delay group had significantly more 2-DG uptake than the unpaired group (p < .05; .05).
The ansiform lobe was examined and there was a significant main group effect for CRUS II (F2,12 = 5.78, p < .05). Post hoc analyses revealed that the delay group had more 2-DG uptake than the unpaired group (p < .05). There was no within side or interaction effect for CRUS II. For CRUS I the original ANOVA had no significant main effects, however the p-value was p = .064. A second ANOVA with only the unpaired and delay groups had a significant main effect of group, which showed that the delay group had significantly more uptake than the unpaired group (p < .05; Table 1).
There was no significant main effect for the paramedian lobule (PM) or for lobule IV. However, the pre-planned comparison revealed that the delay group had significantly more 2-DG uptake than the unpaired group (p < .05; .05) for both regions.
The only region with a significant interaction effect (F2,12 = 4.15, p < .05) was the copula of pyramis (COP). The post hoc analyses revealed that this difference in the 2-DG uptake in the left versus right hemisphere was confined to the delay group (p < .05).
Other regions that were analyzed include lobules II and III of the anterior lobe, and vermal lobules VII, VIII, IX, and X. None of these regions showed significant main effects of group or side or interaction effects see (Table 1).
4. Discussion
Increases in 2-DG uptake within the IN for delay and trace groups are consistent with research demonstrating its importance to both types of conditioning (Christian & Thompson, 2003; Krupa & Thompson, 1997; Steinmetz et al., 1992; Woodruff-Pak et al., 1985). The differential 2-DG uptake patterns of anterior and posterior portions of the interpositus nucleus suggest that the AIP plays a larger role in delay conditioning whereas the PIP plays a larger role in trace conditioning. The AIP had more activation in the delay group versus the unpaired group, which corresponds with neurophysiologial data in rats (Freeman & Nicholson, 1999; Nicholson & Freeman, 2000, 2002), whereas the PIP demonstrated increased activity in the trace group compared to both the unpaired and delay groups. While this finding needs to be replicated through multiple experimental approaches, this increase may indicate that the posterior portion of the interpositus plays a distinct role in trace conditioning that is not shared with delay conditioning. It has been suggested that the PIP plays a role in the correct timing of the CR response, even though it is not critical for acquiring the response (Jimenez-Diaz, Navarro-Lopez, Gruart, & Delgado-Garcia, 2004). Trace conditioning may require more modulation to control CR timing.
Cortical areas of the cerebellum, especially lobule HVI, have been implicated in regulating various properties of the CR such as the timing of the response or its amplitude (Attwell, Rahman, & Yeo, 2001; Christian & Thompson, 2003). Cooling of HVI slows the acquisition rate of delay conditioning (Clark, Zhang, & Lavond, 1997). Lesions or inactivation of lobule HVI also impairs acquisitions and leads to a decrease in the amplitude of the response (Attwell, Rahman, Ivarsson, & Yeo, 1999; Attwell et al., 2001; Gruart & Yeo, 1995; Lavond & Steinmetz, 1989; Yeo, Hardiman, & Glickstein, 1985). The increase in 2-DG uptake in both the delay and trace groups could reflect the importance of this cortical area for amplitude of the eyeblink CR. While the 2-DG was injected during retention for this experiment, it would be interesting to examine the level of activation in this region over the course of acquisition as well. If areas like lobule HVI contribute to the timing of the behavioral response in delay conditioning, they could also play a role in the timing of the trace response.
In this study, lobules IV and V (both lateral and medial portions) of the anterior lobe also showed increases in 2-DG uptake for the delay group versus the unpaired animals. This is supported by the lesion and neurophysiology work, which shows the importance of this area for acquisition and timing of the CR (Garcia, Steele, & Mauk, 1999; Green & Steinmetz, 2005; Perrer, Ruiz, & Mauk, 1993). In fact, humans with damage to this region suffer timing deficits of the CR (Gerwig et al., 2005).
The ansiform lobule of the cerebellum may also modify the timing of the CR for delay conditioning. The increase of 2-DG uptake in both CRUS I and CRUS II for the delay group, is consistent with this suggested function. Deficits in the performance of CRs were demonstrated for delay conditioning in human patients with damage to the superior cerebellar artery (SCA), which provides blood to lobule HVI and CRUS I (Gerwig et al., 2003). However, patients with damage only to CRUS I or CRUS II were not impaired on eyeblink conditioning (Gerwig et al., 2003; Gerwig et al., 2006). Perhaps, CRUS II, and even CRUS I activation is merely neural activity tracking other cerebellar activity, but this activity may not be critical to the task. This may be similar to the neural activity of the hippocampus during delay conditioning, in which the hippocampal neurons show training related firing patterns which are not critical for the acquisition of delay conditioning (Christian & Thompson, 2003; Green & Arenos, 2007). The PM lobule also had more activation for delay conditioning and should be further investigated to determine its contribution to delay conditioning.
In general, activation of the cerebellar cortical regions was greater for delay animals than trace animals. Why are more cerebellar cortical regions active during delay than during trace conditioning? Perhaps, it is related to the inherent memory gap in trace conditioning that does not exist in delay conditioning. During delay conditioning it is possible that the cerebellar cortex is sufficient to perform the task. Areas such as lobule HVI and HV may modulate the timing, and amplitude of the CR. However, in trace conditioning the memory requirement may be too great for the cerebellum, thus forebrain areas may become involved and functionally replace some of the cerebellar cortical areas. For example, the hippocampus is a necessary substrate of trace conditioning (Moyer et al., 1990; Weiss et al., 2000), and the medial prefrontal cortex is involved in the initial acquisition (Kronforst-Collins & Disterhoft, 1998; McLaughlin, Churchwell, Skaggs, & Powell, 2002; Weible et al., 2000). The common area of cerebellar cortical activity for both trace and delay is HVI. Hence, the increased activation of cerebellar cortical areas in delay conditioning indicate that the cerebellum, in general, plays a key role in delay conditioning; while other areas, such as the posterior interpositus and forebrain structures, contribute more to trace conditioning.
Current models of cerebellar learning posit a decrease in Purkinje cell activity during eyeblink conditioning due to long-term depression (LTD) of parallel fiber synapses (e. g., Mauk & Donegan, 1997). However, all of the conditioning-specific changes in 2-DG uptake within the cerebellum in the current study were increases. The primary basis for this apparent inconsistency is that most of the optical density measure was derived from the granule cell layer. The granule cell layer should continue to be activated during presentations of the CS and during the trace interval even though some of the Purkinje cells have undergone LTD. The current findings are, therefore, consistent with the expected pattern of cerebellar cortical activation during eyeblink conditioning. An imaging method with higher spatial resolution might be able to detect discrete areas of Purkinje cell inactivation during eyeblink conditioning.
Another possible explanation for the differences between delay and trace conditioning in this experiment is the inter stimulus interval (ISI). The ISI in trace conditioning was longer than the ISI in delay conditioning (delay at 250 ms versus trace at 500 ms). Lengthening of the ISI by increasing the length of the CS during long delay conditioning or with a trace interval makes eyeblink conditioning hippocampus-dependent (Beylin et al., 2001). Moreover, long delay conditioning, as well as trace conditioning, can induce neurogenesis in the hippocampus (Leuner, Waddell, Gould, & Shors, 2006). Although comparisons of trace and long delay paradigms could be informative, the main purpose of the current study was to compare regional 2-DG uptake in forebrain-dependent and forebrain-independent eyeblink conditioning paradigms.
While we are continuing to investigate delay and trace conditioning with metabolic mapping these results indicate the activation of key areas of the delay circuit such as the interpositus nucleus. The only regions within the cerebellum that were active for both delay and trace groups were the IN and lobule HVI. These common areas may be critical for both delay and trace conditioning and may subserve, at the very least, association and timing components, respectively. Other areas such as lobule V, CRUS I ,and CRUS II, may contribute more to delay conditioning than trace conditioning, whereas the PIP may be more involved when the memory trace is introduced. These new findings highlighting differences in activation between the anterior and posterior interpositus merit a closer look to ascertain how these areas contribute to delay versus trace conditioning.
Acknowledgments
This work was supported by funding awarded to (1) Amy Poremba from the University of Iowa Startup Funds and National Institute of Mental Health Grant MH66922, and (2) John H. Freeman from National Institute of Mental Health Grant MH065483 and National Institute of Neurological Disorders and Stroke Grant NS038890. We thank Norma DiPietro, Vijayalakshmi Canakala, and Hunter Halverson for their assistance on this project.
References
- Attwell PJE, Rahman S, Ivarsson M, Yeo CH. Cerebellar cortical AMPA-kainate receptor blockade prevents performance of classically conditioned nictitating membrane responses. The Journal of Neuroscience. 1999;19:1–6. doi: 10.1523/JNEUROSCI.19-24-j0003.1999. [DOI] [PMC free article] [PubMed] [Google Scholar]
- Attwell PJE, Rahman S, Yeo CH. Acquisition of eyeblink conditioning is critically dependent on normal function in cerebellar cortical lobule HVI. The Journal of Neuroscience. 2001;21(15):5715–5722. doi: 10.1523/JNEUROSCI.21-15-05715.2001. [DOI] [PMC free article] [PubMed] [Google Scholar]
- Barrett D, Shumake J, Jones D, Gonzalez-Lima F. Metabolic mapping of mouse brain activity after extinction of a conditioned emotional response. The Journal of Neuroscience. 2003;23(13):5740–5749. doi: 10.1523/JNEUROSCI.23-13-05740.2003. [DOI] [PMC free article] [PubMed] [Google Scholar]
- Beylin AV, Gandhi CC, Wood GE, Talk AC, Matzel LD, Shors TJ. The role of hippocampus in trace conditioning: temporal discontinuity or task difficulty? Neurobiology of Learning and Memory. 2001;76:447–461. doi: 10.1006/nlme.2001.4039. [DOI] [PubMed] [Google Scholar]
- Breier A, Crane AM, Kennedy C, Sokoloff L. The effects of pharmacologic doses of 2-deoxy-d-glucose on local cerebral blood flow in the awake, unrestrained rat. Brain Research. 1993;618:277–282. doi: 10.1016/0006-8993(93)91276-x. [DOI] [PubMed] [Google Scholar]
- Christian KM, Thompson RF. Neural substrates of eyeblink conditioning: acquisition and retention. Learning & Memory. 2003;11:427–455. doi: 10.1101/lm.59603. [DOI] [PubMed] [Google Scholar]
- Clark RE, Zhang AA, Lavond DG. The importance of cerebellar cortex and facial nucleus in acquisition and retention of eyeblink/NM conditioning; evidence for critical unilateral regulation of the conditioned response. Neurobiology of Learning and Memory. 1997;67(2):96–111. doi: 10.1006/nlme.1996.3740. [DOI] [PubMed] [Google Scholar]
- Freeman JH, Jr., Nicholson DA. Neuronal activity in the cerebellar interpositus and lateral pontine nuclei during inhibitory classical conditioning of the eyeblink response. Brain Research. 1999;833:225–233. doi: 10.1016/s0006-8993(99)01547-4. [DOI] [PubMed] [Google Scholar]
- Garcia KS, Steele PM, Mauk MD. Cerebellar cortex lesions prevent acquisition of conditioned eyelid responses. The Journal of Neuroscience. 1999;19(24):10940–10947. doi: 10.1523/JNEUROSCI.19-24-10940.1999. [DOI] [PMC free article] [PubMed] [Google Scholar]
- Gerwig M, Haerter K, Hajjar K, Dimitrova A, Maschke M, Kolb FP, et al. Trace eyeblink conditioning in human subjects with cerebellar lesions. Experimental Brain Research. 2006;170(1):7–21. doi: 10.1007/s00221-005-0171-2. [DOI] [PubMed] [Google Scholar]
- Gerwig M, Hajjar K, Dimitrova A, Maschke M, Kolb FP, Frings M, et al. Timing of conditioned eyeblink responses is impaired in cerebellar patients. The Journal of Neuroscience. 2005;25(15):3919–3931. doi: 10.1523/JNEUROSCI.0266-05.2005. [DOI] [PMC free article] [PubMed] [Google Scholar]
- Gerwig M, Dimitrova A, Kolb FP, Maschke M, Brol B, Kunnel A, et al. Comparison of eyeblink conditioning in patients with superior and posterior inferior cerebellar lesions. Brain. 2003;126:71–94. doi: 10.1093/brain/awg011. [DOI] [PubMed] [Google Scholar]
- Green JT, Arenos JD. Hippocampal and cerebellar single-unit activity during delay and trace eyeblink conditioning in the rat. Neurobiology of Learning and Memory. 2007;87(2):269–284. doi: 10.1016/j.nlm.2006.08.014. [DOI] [PMC free article] [PubMed] [Google Scholar]
- Green JT, Steinmetz JE. Purkinje cell activity in the cerebellar anterior lobe after rabbit eyeblink conditioning. Learning & Memory. 2005;12:260–269. doi: 10.1101/lm.89505. [DOI] [PMC free article] [PubMed] [Google Scholar]
- Gruart A, Yeo CH. Cerebellar cortex and eyeblink conditioning: bilateral regulation of conditioned responses. Experimental Brain Research. 1995;104(3):431–448. doi: 10.1007/BF00231978. [DOI] [PubMed] [Google Scholar]
- Halverson HE, Freeman JH. Medial auditory thalamic nuclei are necessary for eyeblink conditioning. Behavioral Neuroscience. 2006;120(4):880–887. doi: 10.1037/0735-7044.120.4.880. [DOI] [PMC free article] [PubMed] [Google Scholar]
- Hesslow G. Inhibition of classically conditioned eyeblink responses by stimulation of the cerebellar cortex in the decerebrate cat. Journal of Physiology. 1994;476.2:245–256. doi: 10.1113/jphysiol.1994.sp020127. [DOI] [PMC free article] [PubMed] [Google Scholar]
- Jimenez-Diaz L, Navarro-Lopez JD, Gruart A, Delgado-Garcia JM. Role of cerebellar interpositus nucleus in the genesis and control of reflex and conditioned eyelid responses. The Journal of Neuroscience. 2004;24(41):9138–9145. doi: 10.1523/JNEUROSCI.2025-04.2004. [DOI] [PMC free article] [PubMed] [Google Scholar]
- Kim JJ, Clark RE, Thompson RF. Hippocampectomy impairs the memory of recently, but not remotely, acquired trace eyeblink conditioned responses. Behavioral Neuroscience. 1995;109(2):195–203. doi: 10.1037//0735-7044.109.2.195. [DOI] [PubMed] [Google Scholar]
- Kronforst-Collins MA, Disterhoft JF. Lesions of the caudal area of rabbit medial prefrontal cortex impair trace eyeblink conditioning. Neurobiology of Learning & Memory. 1998;69:147–162. doi: 10.1006/nlme.1997.3818. [DOI] [PubMed] [Google Scholar]
- Krupa DJ, Thompson RF. Reversible inactivation of the cerebellar interpositus nucleus completely prevents acquisition of the classically conditioned eyeblink response. Learning & Memory. 1997;3(6):545–556. doi: 10.1101/lm.3.6.545. [DOI] [PubMed] [Google Scholar]
- Lavond DG, Steinmetz JE. Acquisition of classical conditioning without cerebellar cortex. Behavioral Brain Research. 1989;33(2):113–164. doi: 10.1016/s0166-4328(89)80047-6. [DOI] [PubMed] [Google Scholar]
- Leuner B, Waddell J, Gould E, Shors TJ. Temporal discontinuity is neither necessary nor sufficient for learning-induced effects on adult neurogenesis. The Journal of Neuroscience. 2006;26(52):13437–13442. doi: 10.1523/JNEUROSCI.2781-06.2006. [DOI] [PMC free article] [PubMed] [Google Scholar]
- Mauk MD, Donegan NH. A model of Pavlovian eyelid conditioning based on the synaptic organization of the cerebellum. Learning & Memory. 1997;3:130–158. doi: 10.1101/lm.4.1.130. [DOI] [PubMed] [Google Scholar]
- McLaughlin J, Churchwell J, Skaggs H, Powell DA. Medial prefrontal cortex and Pavlovian conditioning: trace versus delay conditioning. Behavioral Neuroscience. 2002;116(1):37–47. [PubMed] [Google Scholar]
- Moyer JR, Jr., Deyo RA, Disterhoft JF. Hippocampectomy disrupts trace eye-blink conditioning in rabbits. Behavioral Neuroscience. 1990;104(2):243–252. doi: 10.1037//0735-7044.104.2.243. [DOI] [PubMed] [Google Scholar]
- Nicholson DA, Freeman JH., Jr. Developmental changes in eye-blink conditioning and neuronal activity in the cerebellar inter-positus nucleus. The Journal of Neuroscience. 2000;20(2):813–819. doi: 10.1523/JNEUROSCI.20-02-00813.2000. [DOI] [PMC free article] [PubMed] [Google Scholar]
- Nicholson DA, Freeman JH., Jr. Neuronal correlates of conditioned inhibition of eyeblink response in the anterior interpositus nucleus. Behavioral Neuroscience. 2002;116:22–36. [PubMed] [Google Scholar]
- Nicholson DA, Sweet JA, Freeman JH., Jr. Long-term retention of the classically conditioned eyeblink response in rats. Behavioral Neuroscience. 2003;117(4):871–875. doi: 10.1037/0735-7044.117.4.871. [DOI] [PubMed] [Google Scholar]
- Paxinos G, Watson C. The rat brain atlas in stereotaxic coordinates. Academic Press; San Diego, CA: 1998. [Google Scholar]
- Perrer SP, Ruiz BP, Mauk MD. Cerebellar cortex lesions disrupt learning-dependent timing of conditioned eyelid responses. The Journal of Neuroscience. 1993;13:1708–1718. doi: 10.1523/JNEUROSCI.13-04-01708.1993. [DOI] [PMC free article] [PubMed] [Google Scholar]
- Steinmetz JE, Logue SF, Steinmetz SS. Rabbit classically conditioned eyelid responses do not reappear after interpositus nucleus lesion and extensive postlesion training. Behavioral Brain Research. 1992;51:103–114. doi: 10.1016/s0166-4328(05)80317-1. [DOI] [PubMed] [Google Scholar]
- Thompson RR. In search of memory traces. Annual Review of Psychology. 2005;56:1–23. doi: 10.1146/annurev.psych.56.091103.070239. [DOI] [PubMed] [Google Scholar]
- Weible AP, McEchron MD, Disterhoft JF. Cortical involvement in acquisition and extinction of trace eyeblink conditioning. Behavioral Neuroscience. 2000;114(6):1058–1067. doi: 10.1037//0735-7044.114.6.1058. [DOI] [PubMed] [Google Scholar]
- Weiss C, Bouwmeester H, Power JM, Disterhoft JF. Hippocampal lesions prevent trace eyeblink conditioning in the freely moving rat. Behavioral Brain Research. 2000;99(2):123–132. doi: 10.1016/s0166-4328(98)00096-5. [DOI] [PubMed] [Google Scholar]
- Woodruff-Pak DS, Lavond DG, Thompson RF. Trace conditioning: abolished by cerebellar nuclear lesions but not lateral cerebellar aspirations. Brain Research. 1985;348:249–260. doi: 10.1016/0006-8993(85)90443-3. [DOI] [PubMed] [Google Scholar]
- Yeo CH, Hardiman MJ, Glickstein M. Classical conditioning of the nictitating membrane response of the rabbit. II. Lesions of the cerebellar cortex. Experimental Brain Research. 1985;60:99–113. doi: 10.1007/BF00237023. [DOI] [PubMed] [Google Scholar]