Abstract
Objective
The purpose of this study was to characterize the sensorineural hearing losses of a group of children and adults along three parameters important to the hearing instrument fitting process: 1) audiometric configuration, 2) asymmetry of loss between ears, and 3) progression of loss over several years.
Design
Audiograms for 248 60- and 61-year-old adults and 227 6-year-old children were obtained from the audiological database at Boys Town National Research Hospital. Based on right-ear air-conduction thresholds, the configurations were assigned to one of six categories: sloping, rising, flat, u-shaped, tent-shaped and other. Left- and right-ear thresholds were compared to determine asymmetry of loss. Progression of loss was evaluated for 132 children for whom additional audiograms over an 8-year period were available.
Results
In general, the children’s hearing losses were more evenly distributed across configuration categories while most of the adult’s audiograms were sloping or u-shaped in configuration. The variability of loss at each frequency was greater for the children than the adults for all configuration categories. Asymmetrical losses were more common and the degree of asymmetry at each frequency was more extensive among the children than the adults. A small number of children showed either improved or deteriorated hearing levels over time. In those children for whom progressive hearing loss occurred, no f requency was more vulnerable than another.
Conclusions
The results of the present study suggest that substantial differences in audiological characteristics exist between children and adults. Implications for amplification include the development of appropriate fitting protocols for unusual audiometric configurations as well as protocols for binaural amplification in cases of asymmetric hearing losses.
Studies have shown a number of areas in which the auditory skills of children with normal hearing differ from those of adults. For example, children have poorer behavioral detection thresholds (Olsho, Koch, Carter, Halpin, & Spetner, 1988) and require higher signal-to-noise ratios to perform certain listening tasks as compared to adults (Hall, III & Grose, 1991; Veloso, Hall, III, & Grose, 1990). Children have also been found to have poorer use of temporal cues (Elliott, 1986; Elliott, Busse, Partridge, Rupert, & DeGraaff, 1986; Wightman, Allen, Dolan, Kistler, & Jamieson, 1989), poorer phoneme and word recognition (Hnath-Chisolm, Laipply, & Boothroyd, 1998), and poorer speech recognition in reverberant conditions (Nabelek & Robinson, 1982; Neuman & Hochberg, 1983).
The impact of hearing loss on the development of auditory skills, has sparked a debate regarding the amplification needs of children relative to those of adults. Some investigators suggest that children and adults with similar hearing losses require similar amplification strategies (Ching, Dillon, & Byrne, 2001; Ching, Reference Note 1; Snik, van den Borne, Brokx, & Hoekstra, 1995). Others suggest that young children may have unique amplification needs during the development of speech and language (Boothroyd, 1997a; Boothroyd, 1997b; Seewald, Moodie, Sinclair, & Cornelisse, 1996; Snik & Homberger, 1993). For example, studies have shown that hearing-impaired children require increased audibility of speech and a wider signal bandwidth to perform at levels similar to those of normal-hearing children or hearing-impaired adults (Stelmachowicz, Hoover, Lewis, Kortekaas, & Pittman, 2000; Stelmachowicz, Pittman, Hoover, & Lewis, 2001). Despite the ongoing debate, fitting strategies that have been largely developed for the adult population are routinely used to fit hearing aids on children, particularly when advanced signal processing devices are used.
At an even more basic level, differences between adults and children may exist in terms of the audiometric profile. Etiologies of presbycusis and noise exposure account for the majority of hearing loss in adults. In contrast, the cause of hearing loss in children is more varied, including etiologies such as meningitis, hyperbilirubinemia, anoxia at birth, and a wide range of genetic disorders. These varied etiologies may result in more diverse audiological characteristics. Specific knowledge of typical audiometric configurations in adults and children would be helpful in providing appropriate amplification for both groups. To date, there are no data comparing the audiometric characteristics of hearing loss in children or adults. Rather, studies on the incidence of hearing loss have focused on a variety of genetic syndromes, diseases, physical conditions, ethnic groups, or geographical regions (see for example, Fortnum and Davis (1997), Liu, Xu, Hu, Nance, Sismanis, Zhang and Xu (2001), and Cruickshanks, Wiley, Tweed, Klein, Mares-Perlman and Nondahl (1998)). Although a number of studies have provided information regarding the long-term medical management of progressive hearing loss in children (Berrettini, Ravecca, Sellari-Franceschini, Matteuci, Siciliano & Ursino, 1999; Fowler, McCollister, Dahle, Boppana, Britt, & Pass, 1997; Levi, Tell, & Feinmesser, 1993), the short-term amplification needs of these children were not addressed.
The purpose of the present study was to characterize the sensorineural hearing losses of a group of children and adults along three parameters important to the hearing instrument fitting process: 1) audiometric configuration, 2) asymmetry of loss between ears, and 3) progression of hearing loss over several years.
Methods
Audiograms for adults and children were obtained from the audiological database at Boys Town National Research Hospital. At the time of this study, the database contained audiograms for roughly 30,000 patients obtained over an 8-year period. Audiological data were available for 590 6-year-old children and 354 60- to 61-year-old adults. Six-year-olds were chosen to represent children who could reliably complete an audiometric examination in one visit (using conventional or play audiometry) and who likely possessed hearing loss early in life when speech and language skills are acquired1. Sixty-year-old adults were chosen to represent adults with primarily acquired hearing losses. Because audiograms were obtained from a clinic specializing in pediatric services, it was necessary to include both 60 and 61-year-olds to obtain a similar sample size for the two groups.
Right-ear air-conduction thresholds from each patient were obtained based on the following criteria: 1) all thresholds were selected in a single test session, 2) thresholds were present for each of the six octave test frequencies from 250 through 8000 Hz, 3) at least one threshold was ≥ 30 dB HL, 4) sensorineural hearing loss was confirmed using bone conduction audiometry, and 5) air-bone gaps did not exceed 10 dB at any frequency unless they were considered to be vibrotactile responses. In cases where thresholds were obtained using two different transducers (TDH-50 and EAR-3A), the better of the two thresholds was used. Of the 944 audiograms reviewed (590 children and 354 adults) data for 227 children and 248 adults fit the selection criteria and were included in the study.
Results
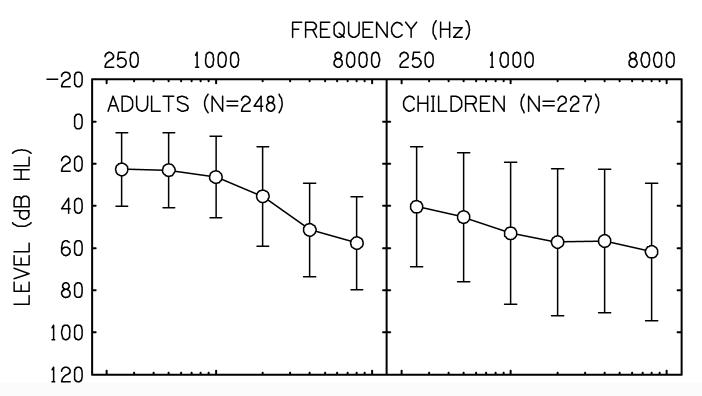
Audiograms were analyzed for audiometric configuration, symmetry of loss between ears, and progression of loss over an eight-year period. Figure 1 shows the mean pure-tone hearing thresholds for all audiograms (± one standard deviation) for the adults (left panel) and the children (right panel). Although the average configurations of hearing loss were sloping in nature for both groups, the children had slightly poorer thresholds in the low frequencies. In addition, the children’s thresholds deviated from the mean by an average of 12.5 dB more than the adult’s at all frequencies.
Figure 1.
Average of all right-ear hearing levels (± 1 standard deviation) as a function of frequency for the adults (left panel) and the children (right panel).
Audiometric Configuration
To describe the audiometric configurations that comprised the average thresholds in Figure 1, each audiogram was assigned to one of six categories. The algorithms used to define each category were:
1) SLOPING: thresholds occurred at equal or successively higher levels from 250 to 8000 Hz. The difference between thresholds at 250 and 8000 Hz was always >20 dB. To accommodate severe-to-profound hearing losses with only one or two thresholds in the low-frequency region (corner audiograms), thresholds indicating no response at the limit of the audiometer were not considered in the algorithm.
2) RISING: thresholds occurred at equal or successively lower levels from 250 to 8000 Hz. The difference between thresholds at 250 and 8000 Hz was always >20 dB.
3) FLAT: thresholds across frequencies did not vary more than 20 dB from each other.
4) U-SHAPED: one or more adjacent thresholds between 500 and 4000 Hz were ≥ 20 dB relative to the poorer threshold at 250 or 8000 Hz.
5) TENT-SHAPED: one or more adjacent thresholds between 500 and 4000 Hz were ≤ 20 dB relative to the better threshold at 250 or 8000 Hz.
6) OTHER: configurations that did not meet the criteria for inclusion in any other category.
The mean audiometric configurations for the first four categories (± one standard deviation) are illustrated in Figure 2 for the adults (left panels) and children (right panels). The number of audiograms falling into each category is indicated in each panel.
Figure 2.
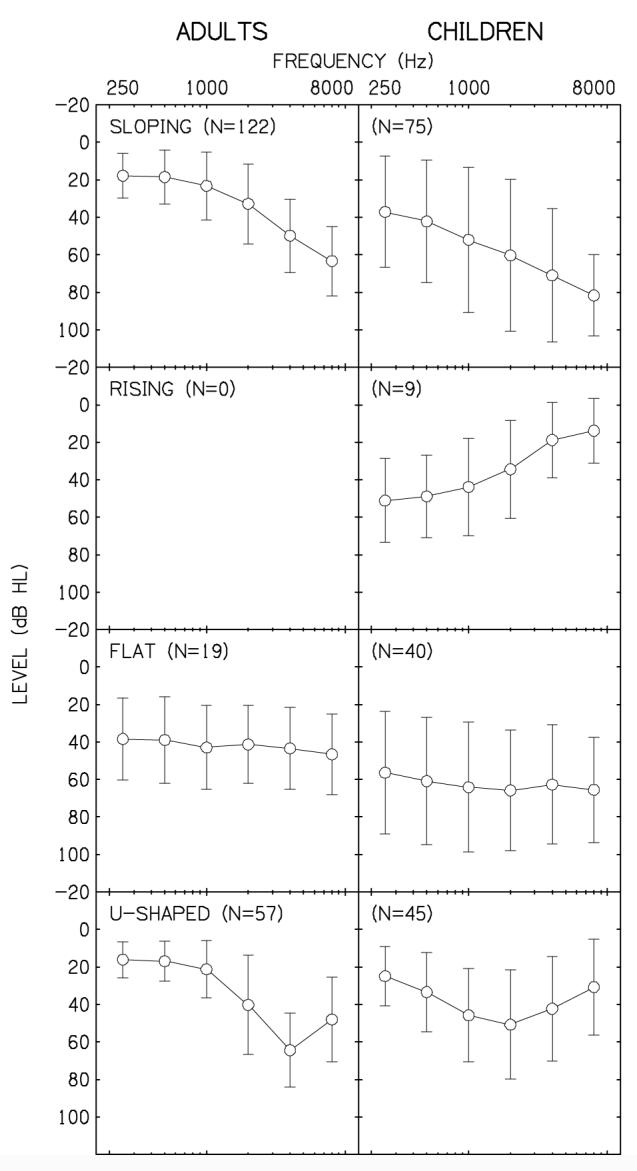
Average of hearing levels (± 1 standard deviation) for audiograms falling into the SLOPING, RISING, FLAT, and U-SHAPED categories. Results for adults and children are in the left and right panels, respectively.
In the SLOPING category, mean thresholds for the children were 15-20 dB poorer at most frequencies than for the adults. The audiograms falling into this SLOPING category most likely represent adults with presbycusis whereas the etiology for the children varied. Examination of the individual audiograms within the SLOPING category revealed greater variability (14.5 dB across frequencies) and many more children with severe-to-profound hearing losses (corner audiograms) compared to the adults. Although adults with severe to profound hearing losses certainly exist, it is likely that they feel that annual audiometric evaluations are unnecessary, and thus are not well represented in the database.
Although only a small number of the children’s audiograms were RISING in configuration, none of the adult’s audiograms met the criteria for inclusion in this category. It is possible that a number of adults had RISING audiograms at one time but the configuration of loss changed to a TENT-SHAPED, FLAT, or SLOPING configuration with age. Audiograms with a FLAT configuration revealed poorer thresholds overall and greater variability (10 dB across frequencies) for the children compared to the adults.
The mean configuration of audiograms in the U-SHAPED category differ for the children and adults. The adult’s average U-SHAPED configuration is characterized by a notch at 4000 Hz, consistent with noise exposure. In contrast, the children’s average configuration is more rounded (cookie bite losses), consistent with some forms of hereditary hearing loss. Examination of individual audiograms did reveal a few adults with rounded configurations as well as a few children with notched configurations. However, in general the U-SHAPED losses of each group were quite different.
Because of the unusual configurations and variability of the TENT-SHAPED and OTHER audiograms, the mean data tended to obscure the unique configurations within each category. To provide an illustration of these losses, individual audiograms from each category are illustrated in Figure 3. Audiograms from four adults and four children are displayed in the left and right panels, respectively. The TENT-SHAPED audiograms were often comprised of at least one threshold between 500 and 4000 Hz within or near the normal hearing range while the remaining thresholds occurred at much higher levels (≥20 dB difference). Several of the audiograms in the OTHER category appeared to be a combination of two configurations (e.g., SLOPING and TENT-SHAPED), however most were simply indescribable. Although more adults had TENT-SHAPED configurations and more children had OTHER configurations, few differences were apparent across groups within each category.
Figure 3.
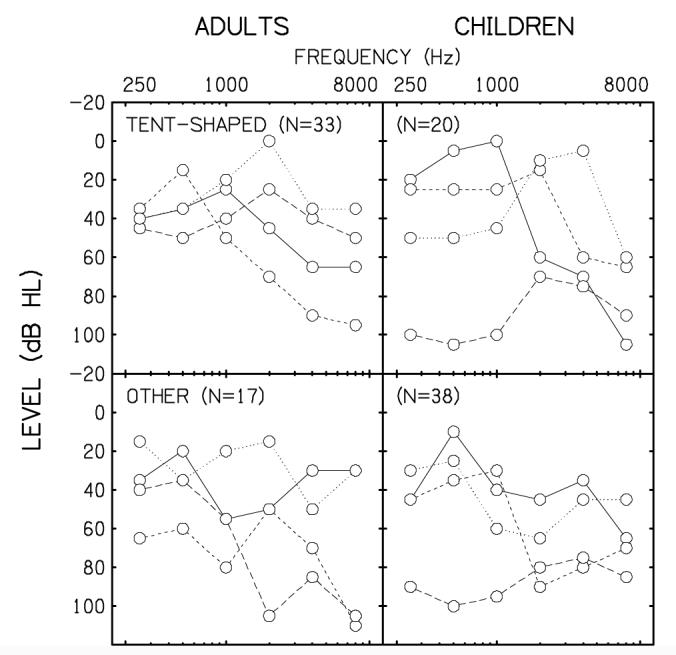
Audiograms for individuals falling into the TENT-SHAPED and OTHER categories for the adults (left panels) and children (right panels).
The percentage of audiograms falling into each category is given in Figure 4. The configurations are ordered according to the adult’s audiograms, from most to least frequently occurring (black bars). The open bars represent the children’s audiograms. The SLOPING configuration was most common for both groups followed by the U-SHAPED audiograms. Interestingly, SLOPING and U-SHAPED losses comprised nearly three-quarters (73%) of the adult’s audiograms and those configurations are often consistent with acquired hearing losses (presbycusis and noise trauma). The remaining audiograms (27%) were distributed across the TENT-SHAPED, FLAT and OTHER categories. In contrast, the SLOPING audiograms accounted for one third (33%) of the children’s audiograms with nearly equal numbers of U-SHAPED, FLAT and OTHER audiograms. Audiograms with a RISING configuration were the most infrequently occurring for both groups.
Figure 4.
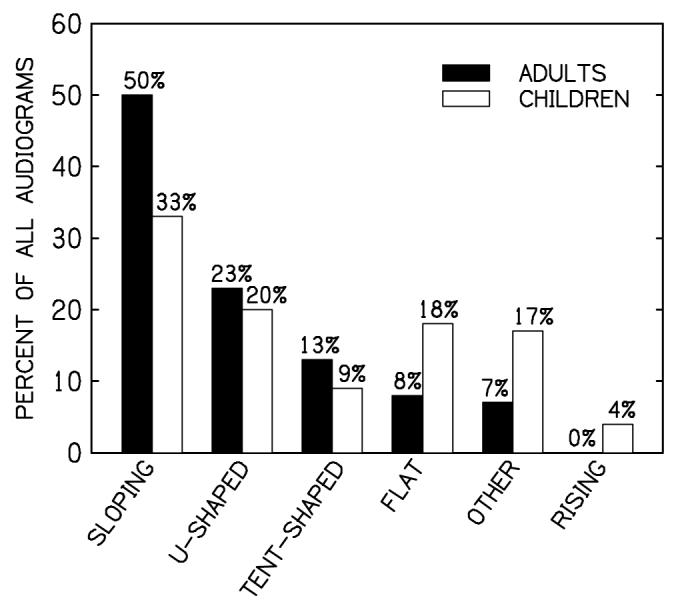
Percentage of audiograms as a function of category. Results for the adults and children are displayed in solid and open bars, respectively.
Asymmetry of Hearing Loss
To determine the symmetry of loss between ears, corresponding left-ear thresholds were obtained from the original audiograms. Thresholds at one or more frequencies were missing for 5 children and 4 adults. In these cases, composite audiograms were constructed for each patient from evaluations nearest the date of the original audiogram. This was possible for all but one child where the threshold at 250 Hz was unavailable. Figure 5 shows the right-ear thresholds as a function of the left-ear thresholds for the adults (left panels) and the children (right panels). The filled circles in each panel represent thresholds present for both ears whereas the open circles represent thresholds that exceeded the limits of the audiometer for either the right or left ear. The diagonal gray area in each panel is provided for reference only and represents the area in which thresholds between ears are within 20 dB of each other.
Figure 5.
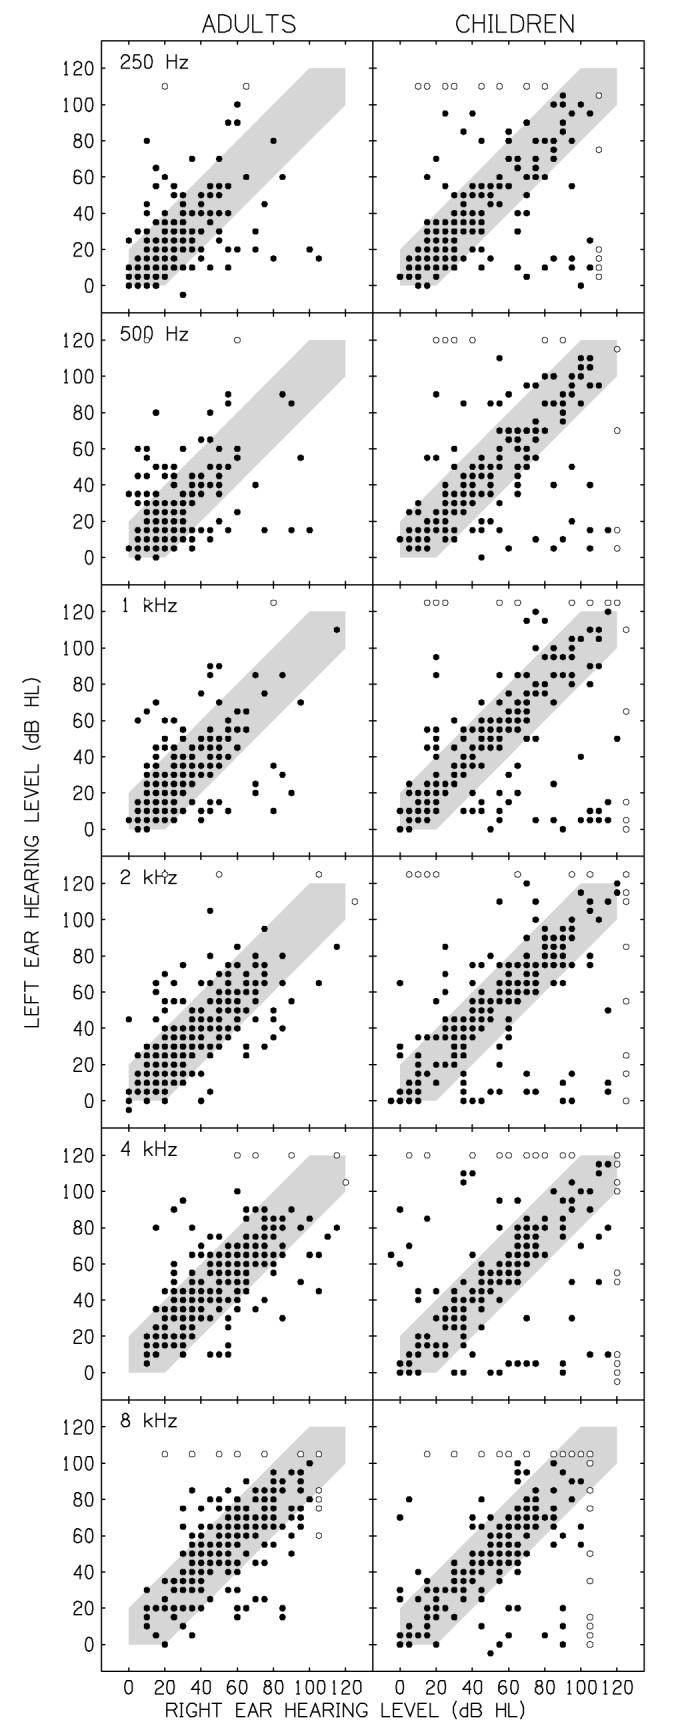
Scatter plots showing left-ear hearing levels as a function of right-ear hearing levels for the audiometric frequencies 250, 500, 1000, 2000, 4000, and 8000 Hz. Results for adults and children are in the left and right panels, respectively. Data points falling outside the gray area in each panel represent those thresholds having a >20 dB difference between ears.
With the possible exception of 8000 Hz, the children’s thresholds were fairly evenly distributed across hearing levels (data points falling inside the gray area) indicating more severe losses at each frequency than for the adults. In addition, asymmetrical losses (data points falling outside the gray area) were more common among the children and the degree of asymmetry at each frequency (distance of the data points from the gray area) was more pronounced than for the adults. Asymmetries > 20 dB between ears are summarized in the bar graph of Figure 6. This graph illustrates the average asymmetry between ears (+1 standard deviation) plotted as a function of frequency for each group. On average, the children’s audiograms revealed losses that were 17 to 25 dB more asymmetric at each frequency than the adult’s audiograms.
Figure 6.
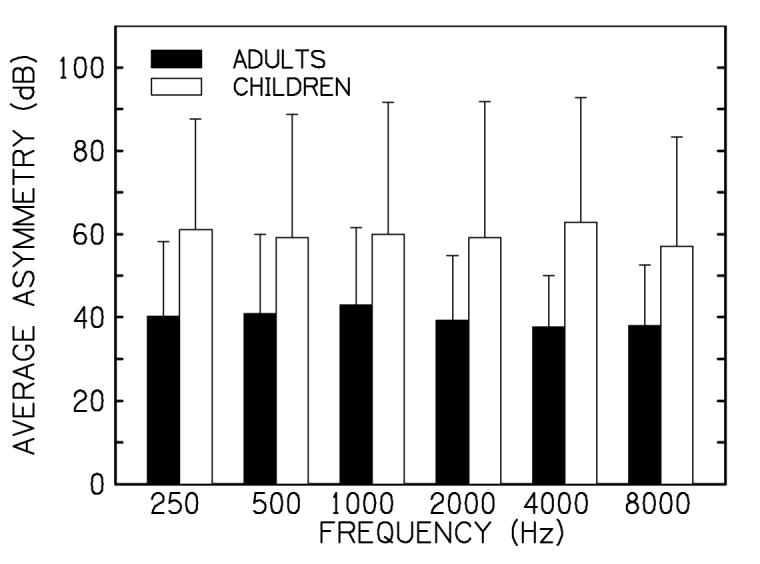
Average asymmetry of loss (± 1 standard deviation) as a function of frequency for the adults (solid bars) and children (open bars) having a >20 dB difference between ears.
In terms of clinical management, it would be helpful to know the number of children and adults with asymmetric thresholds and the number of frequencies at which these asymmetries occurred. Table 1 lists the number (and percentage) of adults and children with asymmetric losses >20 dB at one or more test frequencies (maximum of 6). From the original dataset, 94 adults and 92 children had asymmetrical hearing losses meeting the >20 dB criteria. Nearly half (42) of the adults had asymmetries occurring at only one frequency whereas less than one-third of the children had similar results. Substantially more children (22%) than adults (6%) had asymmetric losses across all 6 frequencies.
Table 1.
The number of adults and children with asymmetric losses at one or more frequencies. Numbers in parentheses are percent of total adults or children.
| Number of Frequencies with Asymmetric Hearing Loss | |||||||
|---|---|---|---|---|---|---|---|
| 1 | 2 | 3 | 4 | 5 | 6 | N | |
| Adults | 42 (45) | 18 (19) | 13 (14) | 9 (10) | 6 (6) | 6 (6) | 94 |
| Children | 26 (28) | 15 (16) | 12 (13) | 12 (13) | 7 (8) | 20 (22) | 92 |
Progression of Hearing Loss
To determine whether the hearing losses of these adults and children progressed over time, additional audiograms for the same patients were retrieved from the same clinical database. Unfortunately, relatively few adults had multiple audiograms over the 8-year period, thus limiting the analysis of progression to the children only. At least one additional audiogram was available for 132 of the original 227 children. Because many of these children had multiple audiograms over that period, the most recent hearing evaluation was selected as the post-test audiogram. The original audiogram obtained at 6 years of age was considered the baseline. As with the original dataset, post-test audiograms were accepted if the right ear hearing thresholds were present for each of the octave frequencies from 250 to 8000 Hz and if air-bone gaps did not exceed 10 dB at any frequency unless they were considered to be vibrotactile responses. In cases where thresholds were indicated for two different transducers (TDH-50 and EAR-3A), the better of the two thresholds was used.
Changes in hearing were determined by comparing the hearing thresholds from the post-test audiogram to the baseline audiogram (post-test — baseline) at each frequency. Although one would expect hearing thresholds to remain stable or deteriorate over time, the hearing thresholds of children can also improve from one test date to the next for a variety of reasons (e.g., fluctuating hearing loss, attention to task, etc.). These improved thresholds are largely ignored in the literature but are mentioned here because even improved thresholds can impact a hearing-aid fitting. For the present study, a positive difference between two thresholds at any frequency indicated a decrease in hearing sensitivity whereas a negative difference indicated an improvement in hearing. Hearing loss deterioration or improvement was defined as a change in hearing thresholds of ≥15 dB at 2 or more frequencies.
Using these criteria, the hearing levels of 17 children (13%) deteriorated over the 8-year period and the hearing levels of 7 children (5%) improved. Figure 7 shows the average deterioration (open circles) and improvement (filled circles) in hearing thresholds for each child as a function of the child’s age at the time of the post test. Data for the 108 children whose thresholds did not change by 15 dB or more are not shown. Although 15-20 dB improvements in threshold were observed for 7 children, 17 children showed a 15-40 dB deterioration in hearing thresholds. Interestingly, the baseline audiograms for 47% (8 of the 17) of the children showing progressive hearing loss were categorized as OTHER. Given that only 16% of all audiograms fell into the OTHER category (38 of 227), an unusual hearing loss configuration may indicate possible progression of hearing loss.
Figure 7.
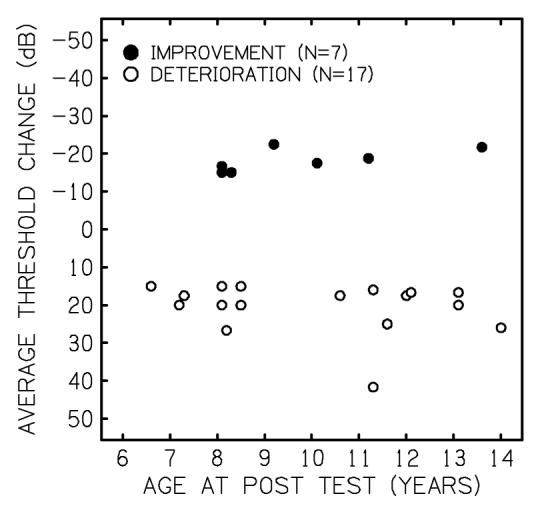
Average improvement (filled circles) or deterioration (open circles) in hearing levels as a function of age at post-test for 24 children showing ≥15 dB change in hearing levels for 2 or more frequencies.
Finally, Figure 8 illustrates the average threshold changes (±1 standard deviation) as a function of frequency for those children showing improved (filled circles) or deteriorated (open circles) hearing thresholds. In general, the largest improvement in thresholds occurred at 4000 Hz whereas the deterioration of thresholds was similar across all test frequencies, with slightly more variability between 2000 through 8000 Hz. These results indicate that the progression of hearing loss in these children occurred at all frequencies and that no frequencies were more vulnerable than any other.
Figure 8.
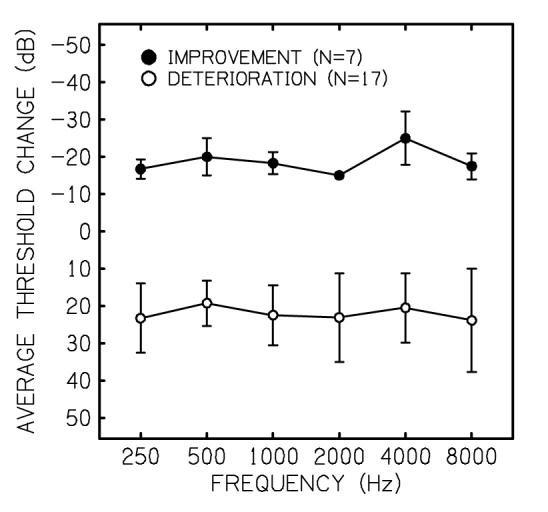
Average improvement (filled circles) or deterioration (open circles) in hearing levels (±1 standard deviation) as a function of frequency.
Discussion
The purpose of the present study was to characterize the sensorineural hearing losses of a group of children and adults in terms of audiometric configuration, asymmetry of loss, and progression of loss over time. Characteristics specific to children and adults in one or more of these aspects have the potential to impact the hearing instrument fitting process. In general, the results of the present study suggest that children have substantially different audiometric configurations compared to adults and that the children’s losses are more often asymmetric. Although progression of hearing loss could not be compared across groups, a small number of children showed improved or deteriorated hearing levels over time that might warrant adjustments to their amplification devices.
The current results have important implications when fitting hearing instruments to children. A close examination of the most common audiometric configurations in adults (SLOPING and U-SHAPED losses) indicates that these configurations are essentially identical from 250-4000 Hz. This suggests that a narrow range of hearing-instrument electroacoustic parameters may be appropriate for the majority of hearing-impaired adults, whereas the parameters appropriate for children may require more varied options (e.g., flexible frequency response, compression characteristics, and number of frequency bands). Most hearing-instrument fitting protocols were developed and validated using data from adults. The results from the current study suggest that, assuming a random sample, approximately 75% of the adults in these studies would have had similar audiograms. Since children appear to have more varied configurations of hearing loss, the blanket use of independently-developed fitting strategies or specific manufacturer’s algorithms developed using adult data is of questionable validity when fitting children.
Arguably, U-SHAPED, RISING, TENT-SHAPED, and OTHER configurations are the most difficult losses to fit. Recent advances in hearing-instrument technology provide signal-processing options such as multiple frequency bands and advanced compression characteristics that may accommodate these unusual configurations. However, it is unlikely that unusual configurations were considered during the development of any fitting strategies. The gain prescribed by these strategies generally mirrors the unusual configuration as if each point on the audiogram were independent. Even if advanced hearing instruments were able to accommodate these gain specifications, it is unclear if children would benefit from this approach. For example, would a young child benefit from a prescription that mirrors the unusual configuration of hearing loss or one that attempts to minimize large amplification differences across frequencies? This is a particularly important issue for young children who must use the amplified speech signal to develop speech and language skills. Inappropriate amplification in the early years may have long lasting consequences. Additional research is necessary to determine how various signal processing schemes influence speech perception and how hearing loss configuration may interact with specific signal processing technologies (e.g., directional microphones, noise suppression circuits, etc.) Because more children appear to have asymmetrical losses, and those children have more severe asymmetries relative to adults, it is possible that many children may require different signal processing strategies for each ear. Although the benefits to speech perception and localization have been reported only recently for cochlear implant users who also wear a hearing instrument in the opposite ear (Ching, Psarros, Hill, Dillon, & Incerti, 2001; Tyler, Parkinson, Wilson, Witt, Preece & Noble, 2002), little is known about the effect of two different signal-processing strategies on speech perception or it’s development. Clearly there is a need for research in this area to develop and validate binaural fitting protocols.
In terms of progressive hearing loss, the average threshold shifts from the initial test to the post test suggest that 13% of children would have required substantial adjustments to their hearing instruments within a period of 1 to 8 years. It is important to note however, that some forms of progressive hearing loss occur in children before 5 years of age (e.g. cytomegalovirus). It is possible that a higher percentage a children would have been considered to have progressive hearing loss if the age range in the present study had included children under the age of 6. It is also worth noting that adjustments in amplification would have been necessary for 5% of the children showing improved hearing thresholds as well. In both cases, the deterioration or improvement in hearing thresholds appeared to be independent of frequency indicating no predictable pattern of change over time. However, a considerable percentage of the children with deteriorating hearing thresholds (46%) had unusual hearing losses (OTHER configurations), suggesting that these children may be at greater risk for progressive hearing loss than children with typical configurations.
Summary and Conclusions
In the current study, the children’s hearing losses were more evenly distributed across configuration categories while the majority of the adult’s audiograms were sloping in nature. The variability of loss was also greater for the children than for the adults for all configuration categories. Asymmetrical losses were more common among the children and the degree of asymmetry at each frequency was more extensive than for the adult group. Progressive hearing loss was found in 13% of the children with 46% of those children having unusual hearing loss configurations. These results suggest that few children would benefit from the narrow hearing-instrument fitting parameters appropriate for most adults and that clinicians lack the protocols necessary to guide them in fitting individuals with unusual or asymmetric configurations.
Acknowledgements
The authors would like to thank Chad Rotolo for his help in gathering the retrospective data. This work was supported by a grant from NIH.
Footnotes
Although reliable thresholds can be obtained from younger children, a series of visits is often necessary to obtain complete audiometric data. Because these visits may span a considerable period of time and varying levels of cooperation, data were limited to the youngest age group having the largest number of complete audiograms obtained in a single test session.
Reference List
- Berrettini S, Ravecca F, Sellari-Franceschini S, Matteucci F, Siciliano G, Ursino F. Progressive sensorineural hearing loss in childhood. Pediatric Neurology. 1999;20:130–136. doi: 10.1016/s0887-8994(98)00123-4. [DOI] [PubMed] [Google Scholar]
- Boothroyd A. Auditory capacity of hearing-impaired children using hearing aids and cochlear implants: Issues of efficacy and assessment. Scandinavian Audiology Supplementum. 1997a;46:17–25. [PubMed] [Google Scholar]
- Boothroyd A. Auditory development of the hearing child. Scandinavian_ Audiology _Supplementum. 1997b;46:9–16. [PubMed] [Google Scholar]
- Ching TY, Dillon H, Byrne D. Children’s amplification needs--same or different from adults? Scandinavian Audiology Supplementum. 2001;29:54–60. doi: 10.1080/010503901750166664. [DOI] [PubMed] [Google Scholar]
- Ching TY, Psarros C, Hill M, Dillon H, Incerti P. Should children who use cochlear implants wear hearing aids in the opposite ear? Ear and Hearing. 2001;22:365–380. doi: 10.1097/00003446-200110000-00002. [DOI] [PubMed] [Google Scholar]
- Cruickshanks KJ, Wiley TL, Tweed TS, Klein BE, Klein R, Mares-Perlman JA, Nondahl DM. Prevalence of hearing loss in older adults in Beaver Dam, Wisconsin. The Epidemiology of Hearing Loss Study. American Journal of Epidemiology. 1998;148:879–886. doi: 10.1093/oxfordjournals.aje.a009713. [DOI] [PubMed] [Google Scholar]
- Elliott LL. Discrimination and response bias for CV syllables differing in voice onset time among children and adults [letter] Journal of the Acoustical Society of America. 1986;80:1250–1255. doi: 10.1121/1.393819. [DOI] [PubMed] [Google Scholar]
- Elliott LL, Busse LA, Partridge R, Rupert J, DeGraaff R. Adult and child discrimination of CV syllables differing in voicing onset time. Child Development. 1986;57:628–635. [PubMed] [Google Scholar]
- Fortnum H, Davis A. Epidemiology of permanent childhood hearing impairment in Trent Region, 1985-1993. British Journal of Audiology. 1997;31:409–446. doi: 10.3109/03005364000000037. [DOI] [PubMed] [Google Scholar]
- Fowler KB, McCollister FP, Dahle AJ, Boppana S, Britt WJ, Pass RF. Progressive and fluctuating sensorineural hearing loss in children with asymptomatic congenital cytomegalovirus infection. Journal of Pediatrics. 1997;130:624–630. doi: 10.1016/s0022-3476(97)70248-8. [DOI] [PubMed] [Google Scholar]
- Hall JW, III, Grose JH. Notched-noise measures of frequency selectivity in adults and children using fixed-masker-level and fixed-signal-level presentation. Journal of Speech and Hearing Research. 1991;34:651–660. doi: 10.1044/jshr.3403.651. [DOI] [PubMed] [Google Scholar]
- Hnath-Chisolm TE, Laipply E, Boothroyd A. Age-related changes on a children’s test of sensory-level speech perception capacity. Journal of Speech, Language, and Hearing Research. 1998;41:94–106. doi: 10.1044/jslhr.4101.94. [DOI] [PubMed] [Google Scholar]
- Levi H, Tell L, Feinmesser M. Progressive hearing loss in hard-of-hearing children. Audiology. 1993;32:132–136. doi: 10.3109/00206099309071862. [DOI] [PubMed] [Google Scholar]
- Liu XZ, Xu LR, Hu Y, Nance WE, Sismanis A, Zhang SL, Xu Y. Epidemiological studies on hearing impairment with reference to genetic factors in Sichuan, China. Annals of Otology.Rhinology and Laryngology. 2001;110:356–363. doi: 10.1177/000348940111000412. [DOI] [PubMed] [Google Scholar]
- Nabelek AK, Robinson PK. Monaural and binaural speech perception in reverberation for listeners of various ages. Journal of the Acoustical Society of America. 1982;71:1242–1248. doi: 10.1121/1.387773. [DOI] [PubMed] [Google Scholar]
- Neuman A, Hochberg I. Children’s perception of speech in reverberation. Journal of the Acoustical Society of America. 1983;73:2145–2149. doi: 10.1121/1.389538. [DOI] [PubMed] [Google Scholar]
- Olsho LW, Koch EG, Carter EA, Halpin CF, Spetner NB. Pure-tone sensitivity of human infants. Journal of the Acoustical Society of America. 1988;84:1316–1324. doi: 10.1121/1.396630. [DOI] [PubMed] [Google Scholar]
- Seewald RC, Moodie KS, Sinclair S, Cornelisse LE. Traditional and theoretical approaches to selecting amplification for infants and young children. In: Bess FH, Gravel JS, Tharpe AM, editors. Amplification for Children with Auditory Deficits. Bill Wilkerson Center Press; Nashville: 1996. pp. 161–191. [Google Scholar]
- Snik AF, van den Borne S, Brokx JP, Hoekstra C. Hearing-aid fitting in profoundly hearing-impaired children. Comparison of prescription rules. Scandinavian Audiology. 1995;24:225–230. doi: 10.3109/01050399509047540. [DOI] [PubMed] [Google Scholar]
- Snik AG, Hombergen GC. Hearing aid fitting of preschool and primary school children. Scandinavian Audiology. 1993;22:245–250. doi: 10.3109/01050399309047476. [DOI] [PubMed] [Google Scholar]
- Stelmachowicz PG, Hoover BM, Lewis DE, Kortekaas RW, Pittman AL. The relation between stimulus context, speech audibility, and perception for normal-hearing and hearing-impaired children. Journal of Speech, Language, and Hearing Research. 2000;43:902–914. doi: 10.1044/jslhr.4304.902. [DOI] [PubMed] [Google Scholar]
- Stelmachowicz PG, Pittman AL, Hoover BM, Lewis DE. Effect of stimulus bandwidth on the perception of /s/ in normal- and hearing-impaired children and adults. Journal of the Acoustical Society of America. 2001;110:2183–2190. doi: 10.1121/1.1400757. [DOI] [PubMed] [Google Scholar]
- Tyler RS, Parkinson AJ, Wilson BS, Witt S, Preece JP, Noble W. Patients utilizing a hearing aid and a cochlear implant: speech perception and localization. Ear and Hearing. 2002;23:98–105. doi: 10.1097/00003446-200204000-00003. [DOI] [PubMed] [Google Scholar]
- Veloso K, Hall JW, III, Grose JH. Frequency selectivity and comodulation masking release in adults and in 6-year-old children. Journal of Speech and Hearing Research. 1990;33:96–102. doi: 10.1044/jshr.3301.96. [DOI] [PubMed] [Google Scholar]
- Wightman F, Allen P, Dolan T, Kistler D, Jamieson D. Temporal resolution in children. Child Development. 1989;60:611–624. [PubMed] [Google Scholar]
- 1.Ching TY. Effective amplification for hearing-impaired children. The Hearing Journal. 2002;55(4):10–18. [Google Scholar]


