

Abstract
Single particle reconstruction using the random conical tilt data collection geometry is a robust method for the initial determination of macromolecular structures by electron microscopy. Unfortunately, the broad adoption of this powerful approach has been limited by the practical challenges inherent in manual data collection of the required pairs of matching high and low tilt images (typically 60° and 0°). The microscopist is obliged to keep the imaging area centered during tilting as well as to maintain accurate focus in the tilted image while minimizing the overall electron dose, a challenging and time consuming process. To help solve these problems, we have developed an automated system for the rapid acquisition of accurately aligned and focused tilt pairs. The system has been designed to minimize the dose incurred during alignment and focusing, making it useful in both negative stain and cryo-electron microscopy. The system includes a feature for montaging untilted images to ensure that all of the particles in the tilted image may be used in the reconstruction.
Keywords: Random conical tilt, Single particle reconstruction, Automated data collection, Electron microscopy
1. Introduction
Single particle reconstruction from electron micrographs is increasingly used for the determination of macromolecular structures in the range of several MDa down to several hundred kDa at resolutions up to 6 Å (Bottcher et al., 1997; Cheng et al., 2004; Ludtke et al., 2004; Stark et al., 2001). While higher resolution structures are typically determined by iterative projection matching methods using unstained cryo images, the random conical tilt (RCT) method is useful for accurately determining an initial structure at lower resolution. RCT simplifies the task of determining the orientation of each particle by collecting micrographs as tilt pairs. The tilt geometry defines two of the three Euler angles required for each particle, while alignment of the untilted particles defines the remaining azimuthal angle. A further advantage of the RCT method is that particles can be classified by their untilted views to ensure that a structurally homogeneous set is used in each reconstruction (Radermacher et al., 1986; Radermacher, 1988).
A significant hurdle in the wide adoption of the RCT method has been the difficulty of collecting accurately aligned and focused tilt pairs. When the sample is even slightly non-eucentric, the imaging area shifts dramatically during tilting; at high magnifications the area imaged in the untilted micrograph may be shifted entirely out of the field of view. Typically, the microscopist must make shift and focus adjustments manually during tilting, a time consuming and often inaccurate process. Although it has been possible to perform RCT of particles embedded in vitrified ice (Ruiz et al., 2001), the high percentage of tilted images suffering from defects due to drift and charging has generally limited RCT reconstructions to negatively stained samples.
RCT is an important first step in many single particle reconstructions, as it provides a reliable initial model for projection matching (Cheng et al., 2006). In addition, a recently proposed modification of RCT, the orthogonal tilt reconstruction (OTR) method (Leschziner and Nogales, 2006), holds great promise in that it makes use of the orientation restraints imposed by the tilt geometry, but does not suffer from the “missing cone” of data which results from having a limited tilt angle. OTR relies on randomly oriented particles, which will result in the need for much larger data sets in order to have sufficiently populated classes. With the increased interest in RCT and OTR, it is important to overcome the limitations inherent in manually acquiring micrographs in tilt pairs.
While the automated collection of tilted images has been solved for use in tomographic data collection (Koster et al., 1992; Rath et al., 1997; Ziese et al., 2002; Zheng et al., 2004), RCT is more demanding due to a combination of the higher magnification, more stringent focus requirements and the large tilt angle separating the image pairs. Together these constraints require an optimized strategy for efficient RCT data collection. To solve this problem, we have developed an automated scheme that rapidly and robustly acquires accurately aligned and focused tilt pairs. The system tracks and compensates for image shifts at intermediate tilt angles, and employs a beam-tilt based autofocusing routine at both the tilted and untilted positions. An option allows for the acquisition of multiple, adjacent 0° micrographs so that all of the particles in the tilted image will have untilted partners and therefore be useful for the reconstruction. Importantly, the electron dose for tracking and focusing is limited to only 6% of the total, making the system useful for RCT data collection from both negatively stained and frozen hydrated samples. Currently, the user must manually define targets for acquiring tilt pairs, but future integration with the automated targeting and acquisition software Leginon (Carragher et al., 2000) is underway.
2. Automated acquisition strategy
2.1. General system implementation
The manual collection of properly aligned and focused tilt pairs is quite challenging. Non-eucentricity of the specimen as well as misalignment between the optical axis and the tilt axis both contribute to large shifts in the imaging area and in defocus during tilting. To correct for the translational movement and focus change induced by tilting, the automated routine tracks specimen movement at several intermediate angular steps before reaching the final tilt angle. A single image is taken at each angular step and cross-correlated with the previous one to determine the tilt-induced sample displacement, which is then compensated for by adjusting the image/beam shift coils (Koster et al., 1992). The defocus is estimated in both the tilted and untilted positions to ensure that the images are taken at the desired defocus, using a modification of the beam-tilt method proposed by Koster et al. (1992).
Recording additional images during tracking and focusing introduces an undesirable added dose to the specimen. While it is possible to reduce exposure time for these steps relative to the conical tilt images, too low a dose results in a poor signal to noise ratio (SNR), making cross-correlation based displacement measurement, and thus the alignment and focusing, less accurate. One challenge in developing an automated RCT data collection scheme was to maintain an acceptably low electron dose while achieving accurate alignment and focusing. As done in some tomography implementations (Rath et al., 1997) one possible solution is to track and focus using an area remote from where the conical tilt images are taken. With such a scheme the same exposure levels could be used for tracking and focusing as used for the conical tilt images, leading to very accurate cross-correlation due to high SNR in the images. To closely reflect the displacement and focus change of the true image area, the auxiliary area would have to be defined along the tilt axis either manually or by some automated means prior to each data collection. User identification of the tracking and focusing area is not desirable for a fully automated routine, and automatic identification would increase system complexity as verification that the selected secondary area is appropriate for tracking and focusing would be necessary.
Instead, we have developed an on-site scheme where tracking and focusing are performed at the same location as the final conical tilt images. Lower magnifications are used to substantially reduce dose and to allow larger tilt steps. Additionally, we use 4× on-CCD binning to enhance the SNR in the tracking and focusing images. The tilted micrograph, which contains the particles actually used in the reconstruction, is acquired first to minimize its cumulative dose, while the untilted micrograph, which is used only for particle alignment, is taken second.
The general steps in our automated scheme are as follows (Fig. 1): (1) Tilting from 0°, where it is generally easier for the user to select the desired sample region, to the user-defined tilt angle at a lower magnification, with images taken at several intermediate angles to avoid losing the sample. (2) At the desired tilt angle a modified beam-tilt based focusing approach is used at an intermediate magnification to set the defocus to the user-specified value. (3) The tilted conical image is acquired at a user-defined magnification. (4) The stage is returned to 0° and the original microscope settings are restored, including the stage position. (5) To correct for drift and stage non-ideality induced displacements, another low magnification tracking image is taken and correlated with the first 0° tracking image. (6) Defocus is again set as in (2). (7) The untilted conical image is recorded.
Fig. 1.

General steps in the automated RCT data collection. The magnification at each step is indicated. Typical magnification values are 14,500× for tracking, 29,000× for focusing, and 62,000× for acquiring the tilt pair. The steps where the tilt pair images are acquired are indicated in bold outline.
2.2. On-site tracking scheme
In general, more accurate alignment can be achieved by increasing the number of tracking steps. However, this must be balanced against the added dose received by the specimen and the overhead time for image acquisition, cross-correlation, and stage relaxation at each step. Tracking the specimen shift at a lower magnification (typically 14,500×) reduces the severity of the eucentric error, allowing for a fairly coarse tilting step. To compensate for the short exposures used for tracking, images are acquired at 9 μm defocus and with 4× on-CCD binning to increase contrast.
The similarity between a pair of tilted images with fixed angular difference decreases with increasing tilt angles. Even with only a 4° angular difference between images there is a severe elongation of the cross-correlation peak at high tilt angles, leading to inaccurate determination of the image shift (Fig. 2). With the larger tilt steps used in our tracking scheme, the elongation of the cross correlation peak is even more severe. To correct for the angular dissimilarity, the image at higher tilt (αi) is stretched relative to the image at lower tilt (αi−1) in the direction perpendicular to the tilt axis prior to computing the cross correlation based upon the stretching factor (sfi) defined in Eq. (1) (Guckenberger, 1982).
Fig. 2.

Central regions of cross correlation images calculated from two pairs of tilted images with a 4° angular difference. (A) Images acquired at 8° and 12° tilts and (B) images acquired at 36° and 40° tilts show the increasing distortion of the cross correlation peak (highlighted with a circle) at higher tilt angles.
| (1) |
The magnitude of the stretching factor increases at higher tilt angles. For example, in tilting from 10° to 20° sf = 1.015, whereas tilting from 50° to 60° sf = 1.285, a near 30% expansion of the image. While a small amount of stretching can effectively correct for the angular dissimilarity, excessive stretching can lead to alignment errors due to imperfection in the determination of the tilt axis. To avoid unreasonable stretching at high tilts we have devised a “constant stretching” scheme where each tilting step is adjusted such that sf remains constant. For tilting from 0° to 60°, each tilting step can be calculated as follows:
| (2) |
| (3) |
Application of the “constant stretching” with five steps yields tilt angles α = 0°, 29°, 40°, 48°, 55°, 60°. In practice, however, we have found that the initial tilting from 0° to 29°, even at lower magnifications, frequently leads to alignment errors. For greater tolerance to eucentric error and more robust tracking, we use 10° as the first tilt step and vary the angular steps thereafter, yielding steps at α = 0°, 10°, 33°, 45°, 54°, 60°. The specimen displacement at subsequent steps is then predicted based on the shift measured at the last angular step (Zheng et al., 2004). The microscope optical system (image/beam coils) is adjusted to the predicted position prior to taking the next tracking image so that only a single image is needed at each tilting step. A total of seven low magnification images (including one for recentering when the stage returns to 0°) are acquired during tracking. In practice, we have found that this tracking scheme is very accurate, with mean shifts between the untilted and tilted images of 30 ± 7 nm perpendicular to the tilt axis and 60 ± 4 nm parallel to the tilt axis (see Fig. 5 for an example of an aligned tilt pair). The routine is also extraordinarily robust, with a eucentric error tolerance of up to 5 μm.
Fig. 5.

Tilted micrograph pair of the yeast Tub4 complex in negative stain. (Top) Micrograph acquired at 60° tilt angle. (Bottom) Aligned, montaged 0° images. The central micrograph is outlined. The tilt axis is vertical in these images. Scalebar, 100 nm.
2.3. Autofocusing
We have employed a beam tilt based approach for focus estimation (Koster et al., 1992). While approaches based on the direct measurement of defocus from the image itself can be more accurate, they are limited by the requirement for clearly visible Thon rings in the Fourier transform.
Although the Thon rings are prominent for images acquired on carbon supported specimens, ice embedded images taken under low dose conditions usually do not have sufficient signal for accurate focus estimation. The precision of the beam tilt approach can be impaired by many factors including astigmatism, stage drift, and the defocus ramp in the tilted position. As discussed in detail below, by recording one extra image it is possible to largely cancel out these factors. Thus even when using a lower magnification (typically 29,000×), it is possible to focus with sufficient accuracy to allow both tilted and untilted images at much higher magnifications to be recorded at the desired defocus. In total, six lower magnification images are required for focus estimation for each tilt pair– three for the tilted image and three for the untilted image.
2.3.1. Correction for drift and astigmatism
Koster et al. (1992) derived the mathematical expression for beam-tilt induced image shift:
| (4) |
where t⇀ and d⇀ are the beam tilt and the induced image shift vectors, respectively, f is the defocus and [F], a two-dimensional (2D) matrix, represents the effect of magnification and spherical aberration. a and b are the values of astigmatism in the two axes. [A] and [B] are the corresponding 2D matrices that reflect the contribution of astigmatism to beam-tilt induced image shift. These matrices need to be pre-calibrated before Eq. (4) is used for measuring focus. If a fixed beam tilt vector is used for both pre-calibration and focus measurement, Eq. (4) can be simplified into a vector form:
| (5) |
F⇀ and A⇀ correspond to the contributions from defocus and astigmatism to the beam tilt induced image shift d⇀, respectively. Eq. (5) can be further modified to reflect the contribution of mechanical and specimen drift by addition of a new term r⇀:
| (6) |
To minimize the effect from drift, three images are taken: the first is recorded when the beam is tilted to the negative end, the second at the positive end, and the third at the negative end again by tilting the beam back from the positive end. The second image is cross-correlated with the first and then the third in order to measure the image shifts along the direction from negative tilt to positive tilt, expressed as d1⇀ and d2⇀, respectively. Since the drift vector reverses its direction if it is measured in the reversed temporal order, the drift vector contained in d1⇀ is opposite to that in d2⇀. By assuming that the drift has a constant rate and direction during the short period when these three images are taken and the time interval between two neighboring beam-tilted images is the same, the drift in d1⇀ can be treated equal but opposite to that in d2⇀. Therefore the average of d1⇀ and d2⇀ should have minimal contribution from the drift as shown in Eq. (7).
| (7) |
The determination of F⇀ and A⇀ can be pre-calibrated together by measuring dm at two defocus settings by applying the same amount of defocus (Δf) above and below true focus, as are given in Eqs. (8) and (9).
| (8) |
| (9) |
With the pre-calibrated F⇀ and A⇀, the focus can thus be measured based upon Eq. (10) by taking three images as suggested above for drift minimization.
| (10) |
2.3.2. Minimization of errors induced by C2 settings
We have also noticed that on our Tecnai microscopes changes in C2 lens current can change the image shifts induced by tilting the beam. A series of measurements were performed using a gold-labeled carbon film on our FEI T20 transmission electron microscope with an accelerating voltage of 200 kV. The specimen was set to 7 μm defocus and the image shifts were measured at 50,000× magnification at various C2 settings. An equal and opposite beam tilt (4 mrad) was applied separately in both beam tilt axes. There is a clear increase in image shift with increasing C2 lens current (Fig. 3).
Fig. 3.
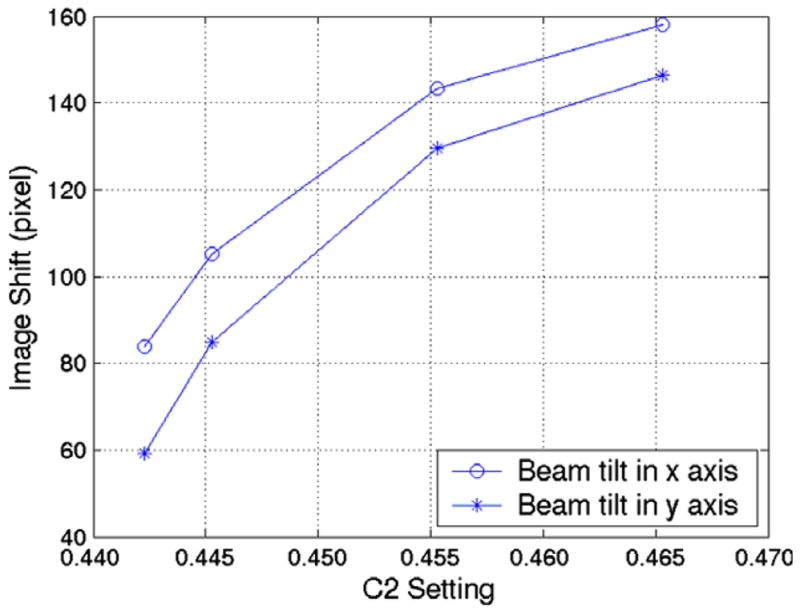
Beam-tilt induced image shifts vs. C2 lens current. Measurements were performed at 7 μm defocus, 50,000× nominal magnification, and 4 mrad beam tilt.
The differences in the image shift in the x and y directions may be caused by astigmatism or by different responses of the beam deflection coils that control beam tilt in x and y directions to the excitation current. To avoid the error caused by the variation of C2 settings, it is useful to perform the focus calibration and focus measurements at the same C2 setting. Since the beam-tilt induced image shift changes less rapidly at larger C2 settings, we generally use a large C2 current for both calibration and focus measurement.
2.3.3. Correction for microscope misalignment
To improve versatility and simplify user operation, tracking, focusing and data collection are all performed on the same image areas, with the alignment images taken at reduced magnifications in order to minimize radiation damage. Due to practical limitations in the accuracy of the microscope alignment, switching magnifications can change the focus. A pre-calibration approach is used to correct for this focus misalignment on either a test sample or an unimportant sample area. First true focus is set at the magnification where the conical tilt data will be taken, then switched to the focusing magnification to perform the calibration of F⇀ and A⇀. The switch from high to low magnification may induce a change in focus. Therefore, Eq. (9) can be modified to add the induced defocus term fa.
| (11) |
The average of the two displacement vectors obtained at two defocus settings now represents the combined effect from astigmatism and focus misalignment. Therefore, the calibrated D⇀ is stored along with the calibration of F⇀ and later used to determine the defocus unbiased by astigmatism and focus misalignment during data collection.
2.3.4. Autofocus at tilted position
Tilted images have a focus gradient perpendicular to the tilt axis, resulting in two adverse effects on focus measurement: elongation of the cross-correlation peak between focusing images and a high-contrast region near the edge of the field of view that is more defocused than the central area (Ziese et al., 2003). The elongation of the cross-correlation peak results in less accurate determination of the beam tilt induced image shift, and therefore less accurate defocus estimation. The higher contrast region due to the larger defocus near the edge contributes more signal to the cross correlation, biasing the defocus estimate toward the defocus near the edge. Ziese et al. (2003) proposed a scheme to correct for the elongation of the cross correlation peak by tilting the beam perpendicular to the tilt axis. As a result, one image is effectively further tilted due to the tilting beam and correspondingly the other is less tilted. Cosine stretching of the more tilted image is thus used prior to computing the cross correlation. While this scheme can reduce the peak elongation, tilting the beam perpendicular to the tilt axis brings additional oppositely defocused areas into the field of view and increases the focus difference between these two tilted images, making them less similar to each other. The common area between two tilted images is further reduced because of the tilting geometry. To overcome these disadvantages we propose to tilt the beam along the tilt axis instead. As a result, the two images acquired at positive and negative beam tilts have the same tilt angle and no stretching is needed. More importantly, the focus difference between these two images is also minimized because of the constant focus distribution parallel to the tilt axis and the common area is maximized. The resulting cross-correlation peak between two focusing images is very well defined, despite the low contrast due to a very short exposure time (Fig. 4).
Fig. 4.
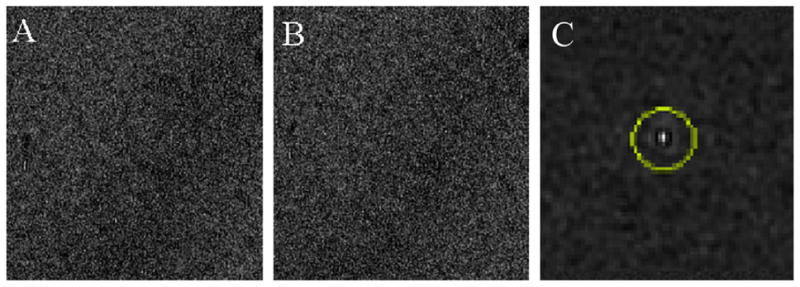
Cross correlation of focusing images at the tilted position. (A and B) Images acquired at a stage tilt angle of 60°. The beam was tilted along the tilt axis by 3 mrad. (C) Phase weighted cross correlation of the two images; the peak is highlighted with a circle. The images were acquired with a 0.05 s exposure at 29,000× magnification, and 4× binned to 1024 × 1024 pixels.
2.4. Montage of untilted micrographs
The imaged area of the specimen is greater in the tilted position than in the untilted position. This results in particles in the tilted image that cannot be used for the reconstruction because their corresponding untilted views are not available. To remedy this, we have included an option to acquire a montage of adjacent images in the untilted position. First a central untilted image is acquired, followed by two images shifted perpendicular to the tilt axis and overlapping the first image by about 30% (Fig. 5). In practice, this approach has doubled the number of useful particles per tilt pair (see Section 4).
3. Dose estimate
Doses were measured on an FEI T20 transmission electron microscope using the tool provided in the FEI low-dose server at all the magnifications and beam intensities used during the data collection. The doses at nominal magnifications 62,000×, 29,000×, and 14500× were 9.49, 1.21, and 0.27 e−/Å2s, respectively. Tracking and focusing images can be acquired with only one tenth the exposure time used for the conical tilt images, limiting the additional dose required for all tracking and focusing steps to 6% of the total (Table 1). Keeping additional dose to a minimum allows for data collection under both negative stain and cryo conditions with little radiation damage to the sample (see Section 5 and Fig. 6).
Table 1.
Typical electron doses for automated collection
| Image type | Magnification | Exposures | Dose per exposure (e−/Å2) | Cumulative dose (e−/Å2) |
|---|---|---|---|---|
| Tracking | 14,500 | 6 | 0.027 | 0.162 |
| Focusing | 29,000 | 3 | 0.121 | 0.525 |
| Tilted image | 62,000 | 1 | 9.49 | 10.015 |
| Tracking | 14,500 | 1 | 0.027 | 10.042 |
| Focusing | 29,000 | 3 | 0.121 | 10.405 |
| Untilted image 1 | 62,000 | 1 | 9.49 | 19.895 |
| Untilted image 2 (optional) | 62,000 | 1 | 9.49 | 29.385 |
| Untilted image 3 (optional) | 62,000 | 1 | 9.49 | 38.875 |
Fig. 6.

Tilt pair acquired under cryo conditions. (A) Tilted (top) and untilted (bottom) images of frozen hydrated E. coli 70S ribosomes were recorded with a cumulative dose of less than 20 e−/Å2 for the tilted image. The tilt axis is vertical in these images. Scalebar, 100 nm. (B) Average power spectra of 256 × 256 pixel regions boxed out along the lines indicated by arrows in (A). The isotropic power spectra indicate a lack of drift or charge induced blurring.
4. Automated data collection—a sample data set for single particle reconstruction
The automated system has been used to acquire numerous RCT data sets of negatively stained samples. As part of an ongoing project, a set of 47 tilt pairs of the yeast Tub4 complex in negative stain was acquired in a single four and a half hour microscope session. The 2048 × 2048 pixel images were taken at 50,000× magnification, at an accelerating voltage of 120 kV with a defocus of 1.7 μm and an average total dose of 20 e−/Å2. The average time to acquire each set of tilted images was 2 min, with an additional 1–2 min spent in manual target determination. Each of the image pairs had particles that could be used in the reconstruction data set.
A total of 4142 particle pairs were selected using the tilted particle picking routine in WEB (Frank et al., 1996). The montaging feature more than doubled the number of useful particles—1955 particles were picked from the central untilted micrograph alone while 2187 particles were selected from the two additional untilted micrographs. This single data collection session provided enough data for the RCT reconstruction of two classes of particles to a nominal resolution of 25 Å. The details of this structure will be published separately.
To determine the accuracy of the autofocusing routine, the defocus of each micrograph was estimated from its power spectrum with SPIDER (Frank et al., 1996). For the tilted micrographs, average power spectra were calculated along strips parallel to the tilt axis, and the average value across the defocus ramp was determined. The user-defined defocus was 1.7 μm for both the tilted and untilted particles; the average measured defocus was 1.79 ± 0.07 μm for the untilted images and 1.88 ± 0.14 μm for the tilted images. The greater deviation from the user-defined defocus in the tilted images is likely due to imperfect beam alignment; the image center at the lower focusing magnification is shifted relative to the image center at higher magnification.
5. Data collection under cryo conditions
We used Escherichia coli 70S ribosomes as a sample for testing the performance of the automated RCT system under cryo conditions. We collected several micrograph pairs to demonstrate the ability of the system to accurately track and focus with frozen samples (Fig. 6A). While mechanical drift can be a considerable problem when moving a cryostage, we have found that the approximately 40 s required for tracking and focusing after the stage has been moved to the tilted position is sufficient time for the stage to stabilize before acquiring the high magnification image.
Another common problem with RCT under cryo conditions is the greater thickness of ice along the electron path at the tilted position. This frequently leads to charging of the sample, causing a fraction of the images to be blurred and therefore unusable. While our system cannot eliminate charging, it does offer the advantage of being able to rapidly collect a large number of tilt pairs from which the best images can be kept after screening for defects induced by charging or drift (Fig. 6B).
6. Summary
Both random conical tilt and the recently proposed orthogonal tilt reconstruction methods require the collection of hundreds of tilted image pairs. The difficulty of manually acquiring accurately aligned and focused tilt pairs has led us to develop an automated RCT data collection system which is useful for both negatively stained and frozen hydrated samples. The system can collect an accurately aligned and focused conical tilt pair in 2–4 min, with average alignment errors of less than 70 nm and variation in defocus of 140 nm for tilted images and 70 nm for untilted images. The alignment and focusing scheme limits the dose required for the tracking and focusing steps to about 6% of the total. Additionally, an image montage at 0° greatly increases the number of particles recorded in the tilted image that can be used in the reconstruction. The RCT software has been integrated into UCSF Tomography (Zheng et al., 2004), which can be freely downloaded for academic use at www.msg.ucsf.edu/tomography.
References
- Bottcher B, Wynne SA, Crowther RA. Determination of the fold of the core protein of hepatitis B virus by electron cromicroscopy. Nature. 1997;386:88–91. doi: 10.1038/386088a0. [DOI] [PubMed] [Google Scholar]
- Carragher B, Kisseberth N, Kriegman D, Milligan RA, Potter CS, Pulokas J, Reilein A. Leginon: an automated system for acquisition of images from vitreous ice specimens. J Struct Biol. 2000;132(1):33–45. doi: 10.1006/jsbi.2000.4314. [DOI] [PubMed] [Google Scholar]
- Cheng Y, Zak O, Aisen P, Harrison SC, Walz T. Structure of the human transferrrin receptor-transferrin complex. Cell. 2004;116:565–576. doi: 10.1016/s0092-8674(04)00130-8. [DOI] [PubMed] [Google Scholar]
- Cheng Y, Wolf E, Larvie M, Zak O, Aisen P, Grigorieff N, Harrison SC, Walz T. Single particle reconstructions of the transferrin-transferrin receptor complex obtained with different specimen preparation techniques. J Mol Biol. 2006;355:1048–1065. doi: 10.1016/j.jmb.2005.11.021. [DOI] [PubMed] [Google Scholar]
- Frank J, Radermacher M, Penczek P, Zhu J, Li Y, Ladjadj M, Leith A. SPIDER and WEB: processing and visualization of images in 3D electron microscopy and related fields. J Struct Biol. 1996;116:190–199. doi: 10.1006/jsbi.1996.0030. [DOI] [PubMed] [Google Scholar]
- Guckenberger R. Determination of a common origin in the micrographs of tilt series in three-dimensional electron microscopy. Ultramicroscopy. 1982;9:167–173. [Google Scholar]
- Koster AJ, Chen H, Sedat JW, Agard DA. Automated microscopy for electron tomography. Ultramicroscopy. 1992;46:207–227. doi: 10.1016/0304-3991(92)90016-d. [DOI] [PubMed] [Google Scholar]
- Leschziner AE, Nogales E. The orthogonal tilt reconstruction method: an approach to generating single-class volumes with no missing cone for ab initio reconstruction of asymmetric particles. J Struct Biol. 2006;153:284–299. doi: 10.1016/j.jsb.2005.10.012. [DOI] [PubMed] [Google Scholar]
- Ludtke SJ, Chen DH, Song JL, Chuang DT, Chiu W. Seeing GroEL at 6 Å resolution by single particle electron cryomicroscopy. Structure. 2004;12:1129–1136. doi: 10.1016/j.str.2004.05.006. [DOI] [PubMed] [Google Scholar]
- Radermacher M, Wagenknecht T, Verschoor A, Frank J. A new 3-D reconstruction scheme applied to the 50S ribosomal subunit of E. coli. J Microsc. 1986;141:RP1–RP2. doi: 10.1111/j.1365-2818.1986.tb02693.x. [DOI] [PubMed] [Google Scholar]
- Radermacher M. Three-dimensional reconstruction of single particles from random and nonrandom tilt series. J Elect Microsc Tech. 1988;9:359–394. doi: 10.1002/jemt.1060090405. [DOI] [PubMed] [Google Scholar]
- Rath BK, Marko M, Radermacher M, Frank J. Low-dose automated electron tomography: a recent implementation. J Struct Biol. 1997;120:210–218. doi: 10.1006/jsbi.1997.3924. [DOI] [PubMed] [Google Scholar]
- Ruiz T, Kopperschläger G, Radermacher M. The first three-dimensional structure of phosphofructokinase from Saccharomyces cerevisiae determined by electron microscopy of single particles. J Struct Biol. 2001;136:167–180. doi: 10.1006/jsbi.2002.4440. [DOI] [PubMed] [Google Scholar]
- Stark H, Dube P, Luhrmann R, Kastner B. Arrangement of RNA and proteins in the spliceosomal U1 small nuclear ribonucleo-protein particle. Nature. 2001;409:539–542. doi: 10.1038/35054102. [DOI] [PubMed] [Google Scholar]
- Ziese U, Janssen AH, Murk J-L, Geerts WJC, Van Der Krift T, Verkleij AJ, Koster AJ. Automated high-throughput electron tomography by pre-calibration of image shifts. J Microsc. 2002;205(2):187–200. doi: 10.1046/j.0022-2720.2001.00987.x. [DOI] [PubMed] [Google Scholar]
- Ziese U, Geerts WJC, Van Der Krift TP, Verkleij AJ, Koster AJ. Correction of autofocusing errors due to specimen tilt for automated electron tomography. J Microsc. 2003;211:179–185. doi: 10.1046/j.1365-2818.2003.01153.x. [DOI] [PubMed] [Google Scholar]
- Zheng QS, Braunfeld MB, Sedat JW, Agard DA. An improved strategy for automated electron microscopy tomography. J Struct Biol. 2004;147:91–101. doi: 10.1016/j.jsb.2004.02.005. [DOI] [PubMed] [Google Scholar]